1
GAST006
A STUDY OF CONSUMER SATISFACTION TOWARDS RESTAURANTS’ SERVICE QUALITY IN SURABAYA
Monika Kristanti
Petra Christian University, Indonesia
Sienny Thio
Petra Christian University, Indonesia
Regina Jokom
Petra Christian University, Indonesia
Endo Wijaya Kartika
Petra Christian University, Indonesia
ABSTRACT
The restaurant industry in Surabaya has shown rapid growth recently. This requires the restaurant businesses to recognize their competitive advantages in order to win the competition. One of the competitive advantages is a good service quality that will create consumer’s satisfaction. This research is aimed to know the consumer’s satisfaction towards service quality of restaurants in Surabaya and to identify if there is significant satisfaction differences based on consumer’s demographic which are gender, age, occupation, level of education and level of income. The consumers of eleven upscale restaurants in Surabaya, Indonesia were surveyed to define their expectation and perception towards the service quality of the restaurants that they experienced based on the SERVQUAL model. SERVQUAL model has five dimensions such as tangible, responsiveness, reliability, assurance and empathy. The questionnaires used were five point Likert type scales which were distributed to 553 consumers who were dine-in by using convenience and quota sampling technique. The quota for each restaurant is 50 questionnaires. The method of analysis used were descriptive statistics, customer satisfaction index, independent sample t-test and one-way ANOVA. The result shows that empathy has the biggest customer satisfaction index, 0.9714, compared to the other dimensions. It means that consumers are satisfied that the restaurant’s staffs are helpful and give personal attention to the consumers. Assurance has the lowest customer satisfaction index, 0.9332. It can be said that the consumers are satisfied that the staffs have good product knowledge, able to handle complaint and courteous to the consumers. Overall, customer satisfaction index is 0.9610 that means consumers are satisfied to the service quality that the restaurants in Surabaya have. In addition, there is no significant satisfaction differences for the consumers with different age group, different level of education and different level of income; there is only significant satisfaction differences for the consumers of different gender, that is men are more satisfied than women, and different occupation, that is civil servants are more satisfied than other occupations.
Keywords: Customer Satisfaction, Service Quality
INTRODUCTION
The restaurant industry is one of the most competitive industries in the world. As the restaurant industry continues to expand, the issue of service quality has received increasingly more attention. The customer has many choices when dining out in restaurants. The customer is impatient and sophisticated, if the restaurant is not providing service quality and satisfaction, the customer will leave to another restaurant (Seyanont, 2007).
2
(Seyanont, 2007). High quality service and satisfying customer should be done continuosly, despite of low customer complain. Around 95% unsatisfied customers will not complain, but mostly will never come back again (Kotler & Amstrong, 2006).
In achieving customer satisfaction more effectively and efficiently than competitors, restaurant should determine the needs and wants of the target markets. In order to define those needs and wants, the restaurant must understand the demographic characteristics of the customer. By knowing the demographic profiles, restaurant owners get a better understanding of who and what their customers are thus able to give better service quality (Abdul Talib, Hashim, Karuthan & Kumar, 2012).
Regarding demographic profiles of customer, there is a previous research that was done by Yuanji Zheng (2011), factors determining the choice of international restaurants by Bangkokians. The result of the research showed that there are differences among respondents in their choice of international restaurants regarding service quality when classified by gender, age and income; and there is no differences among respondents regarding service quality when classified by education.
People with different demographic characteristics (gender, age, income and education) have different traits. These people need different services according to their traits. If the restaurant offers a greater number of quality service, restaurants will enhance the chance to give customer satisfaction (Yuanji Zheng, 2011).
Research Question and Objectives
There are 2 (two) research questions in this study. First, how the customer satisfaction toward restaurants’ service quality in Surabaya is; and second, whether there are significant satisfaction differences related to demographic characteristics (age, gender, income, occupation and education level).
The objective of this research is (1) to find out the customer satisfaction toward service quality given by the restaurants in Surabaya and (2) to test if there are significant satisfaction differences based on demographic characteristics.
LITERATURE REVIEW Demographic
Wilson and Gilligan (2005) stated that markets can be subdivided into groups on the basis of one or more demographics variables such as age, sex, income, education, occupation, religion, race, nationality, family size and family life cycle. Therefore Kotler and Amstrong (2006) explain each variable as follows:
a) Age
Consumer needs and wants change with age. Neal said age is a powerful determinant of consumer behavior which affects a variety of consumer states including interests, tastes, purchasing ability, political preferences and investment behavior (Lim, Bennett & Dagger, 2008).
b) Gender
Companies start developing their products according to the needs of each gender. Brody and Hall, Dittmar, Mattila said that gender may impact on perceptions of interaction quality, physical environment quality, outcome quality and systems quality due to gender role socialization, decoding ability, differences in information processing, traits, and the importance placed on core or peripheral services (Lim, Bennett & Dagger, 2008).
c) Income
Income will affect consumer buying power. d) Education
Education level of a person will affect the buying pattern. e) Occupation
3 f) Religion
Consumer needs and wants may vary according to their religion. g) Race
Race is affected by the culture and environment surrounding him/her since childhood.
h) Nationality
Nationality diversity usually affects the items purchased, such as Indonesian citizens living abroad still prefer to eat in Indonesian restaurant.
i) Family size
In accordance with the number of family member at home, needs become not similar with each other.
j) Family life cycle
According to the stages which their passed, the consumers buy goods that are suitable with their needs. For example, a father with one child would be adequate to buy a small car for four people instead of buying a big car.
Service Quality
Lewis & Booms (1983) define service quality as a measurement of how excellent the level of service provided to meet customer expectations are. According to this definition, service quality can be defined through the fulfillment of the needs and desires of consumers and the precision of delivery to offset the consumer expectations. Thereby, there are two major factors that affect service quality, which are expected service and perceived service (Parasuraman, et al., 1985). If the perceived service is in accordance with the expected service, the service quality will be perceived as positive or good. If the perceived service exceeds the expected service, the service quality will be perceived as the ideal quality. Conversely, when perceived service worse than expected service, the quality of service will be perceived as negative or bad. Therefore, the performance of service quality depends on the ability of the service provider in fulfilling the expectations of the customers consistently (Cited in Tjiptono, 2005).
Service quality is measured by five dimensions as follows: (Lovelock, Patterson, & Walker, 2011)
a) Tangible
It is appearance of physical facilities, equipment, personnel, and communication material.
b) Reliability
It is the ability to perform the promised service dependable and accurately. c) Responsiveness
It is the willingness to help customers and provide prompt service. d) Assurance
It is related to competency, courtesy, and credibility of staffs and how the staffs give the secure feeling to the guests.
e) Empathy
It discusses how good the communication between staffs and guests is, and also how the staffs understand the customer.
Customer Satisfaction
Kotler and Keller (2006) define satisfaction as a person’s feeling of pleasure or disappointment which resulted from comparing a product’s perceived performance or outcome against his/ her expectations. On the other hand, Lamb (2004) stated that customer satisfaction is the feeling that a product has met or exceeded the customer’s expectation.
4
customer was satisfied more than the younger. Moreover, the higher income group was not easy to satisfy. It means, if socio-economic level increases, the satisfaction will be decreased (cited in Siddiqui, 2011).
RESEARCH METHODS
The type of the research is descriptive quantitative aimed to identify the consumers’ satisfaction toward service quality of the restaurants in Surabaya and to know if there is a significant satisfaction differences based on consumer’s demographic which are gender, age, occupation, level of education and level of income. The consumers’ satisfaction is measured by comparing expectation and perception towards the service quality of the restaurants based on the SERVQUAL model. SERVQUAL model has five dimensions such as tangible, responsiveness, reliability, assurance and empathy.
The population of the research was the consumers of eleven upscale restaurants in Surabaya, Indonesia who were dine-in. The sampling methods were convenience and quota sampling, 50 questionnaires for each restaurant. The questionnaires used were five point Likert type scales distributed to 553 consumers in eleven upscale restaurants.
The method for data analysis used were descriptive statistics (frequencies and mean), customer satisfaction index, independent sample t-test and one-way ANOVA. The scale of customer satisfaction index is divided into four. First, less than 0.60 is considered not satisfied. Second, 0.60 to 0.80 is considered satisfied enough. Third, more than 0.80 to 1.00 is considered satisfied, and forth, more than 1.00 is considered very satisfied (Wijaya & Yosin, 2012).
FINDING AND DISCUSSION
The questionnaires were distributed to 553 consumers in eleven upscale restaurants in Surabaya which are Chinese Restaurants, Indonesian Restaurants, Western Restaurants and Asian Restaurants.
The majority of respondents are men (52.4%), at the age of 16 to 34 years old (66.2%), working as employee, 60.7% (civil servants, private sector employees, entrepreneurs and professional), having bachelor degree (47.6%), having average level of income per month more than IDR 2,000,000,-, dining in the restaurans three to four times a month (32.5%), mostly dining in together with families (48.5%) and having average level of spending per visit IDR 100,000 to 499,999 (58.2%).
Customer Satisfaction Index
The largest customer satisfaction index for the five dimensions of service quality is empathy, 0.9714, which means consumers are satisfied with the restaurants’ staffs who are always ready to help and give personal attention.
………
Table 1
……… The smallest customer satisfaction index is assurance, 0.9332. It means the consumers are satisfied as the staffs have good product knowledge, able to answer consumers’ questions and handle complaint, and the staffs are courteous to the consumers.
………
Table 2
……… Overall, the customer satisfaction index towards service quality is 0.9610, that means consumers are satisfied to the restaurants’ service quality.
5
Consumers’ Satisfaction Differences based on Gender
There is a significant satisfaction differences between men and women, that is men are more satisfied than women.
………
Table 3
……… Men and women have significant satisfaction differences since males and females are differentiated by both biological differences and gender identity differences. Some personality specialties combined with masculinity and femininity account for the diversification among male and female’s consumer behaviors (Yuanji Zheng, 2011). The differences are more stronger since men and women think differently, believe different things and have different view, priority and habit (Pease & Pease, 2007). Women are more difficult to be satisfied toward service quality than men because women tend to choose comfortable and clean restaurant and like good interior and exterior of a restaurant. On the other hand, men are easier to be satisfied since men give less attention to cleanliness, comfort or restaurant design, men are more likely to find restaurant that can give higher prestige (Bruni, 2008). In addition, women always give attention to detail, women always judge everything in detailed and are very alert to issues; on the contrary, men give less attention to detail and issues (Kartajaya, 2003).
Others, Gilligan suggested that the socialization of women to maximize the interpersonal aspects of their relationships contributes to their emphasis on the process component of service encounters. Likewise, Hall and Rosenthal said that women’s higher decoding ability of non-verbal cues, especially of facial expressions increased their sensitivity to the non-verbal behavior of contact employees. This argument was supported by Mattila, who found that women were less satisfied than men when the customer contacted employee displayed negative emotions (Lim, Bennett & Dagger, 2008).
Darley and Smith stated that females had been found to be comprehensive information processors while males were more selective tending to process heuristically and leave out subtle cues. Laroche found that women undertook a comprehensive review of both personal and non personal in-store information. Women tended to rely more heavily on the service environment and tangible cues in the environment to make service evaluations. In comparison, males considered less information and tended to take shortcuts, relying more on personal than on non-personal cues. Therefore, women will be more sensitive to the quality of the service environment (Lim, Bennett & Dagger, 2008).
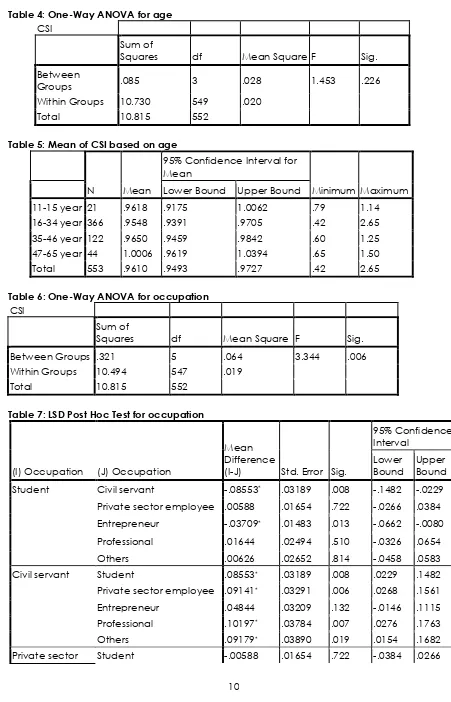
Consumers’ Satisfaction Differences based on Age
There is no significant satisfaction differences between age group. All age group are satisfied toward service quality in the restaurants.
………
Table 4
……… The highest mean of customer satisfaction is at the age of 47 to 65 years old, that is 1.0006. It means that consumers are very satisfied to the service quality in restaurants in Surabaya. On the other hand, the lowest mean of customer satisfaction is at the age of 16 to 34 years old, that is 0.9548. It means consumers are satisfied to the service quality in restaurants, but still it cannot fulfill the consumers’ expectation yet.
………
Table 5
6
is supported by the research of American Customer Satisfaction Survey Index which proves that consumers at old ages are easier to be satisfied than consumers at young ages (Siddiqui, 2011). This opinion is also supported by Haddad, Al-Dmour and Al-Zu’bi (2012) that there are different needs for each generation, in addition to the different priorities and lifestyles which each age group leads.
Other support comes from the research of Lim, Bennett and Dagger (2008) which is found that consumer age affects service quality perceptions. Callan and Bowman suggested that mature person (over 55 years of age) were a discerning group that placed more importance on value of money than actual price or discounts. Mature person also significantly perceived the ease of maneuvrability around the site and small food portions as important aspects of service quality compared to their younger counterparts. Others, Morrow stated that mature customers would be less critical of physical environment quality compared to younger individuals that were more demanding. Thus, mature customers will rate this dimension higher than their younger, more critical counterparts.
Beside those stated above, it also said that consumer behaviors vary among people with different age. Young generations tend to have extensive interests, especially in new and innovative things, and care more about hedonic benefits. On the contrary, the older generations feel more comfortable with traditions and are more likely to focus on utilitarian benefits. It shows that consumers with different age may have different intention and behavior according to their desires and favors. Consumers at different stages of age normally will not have the same consumption patterns or attitudes in the process of service consumption (Yuanji Zheng, 2011).
Yuanji Zheng’s opinion is supported by Reynolds and Hwang (2006) that conducted research about influence of age on customer dining experience factors at US Japanese restaurant. The research showed that young generations are adventurous and not intimidated to try something new and different while dining out and these generations tend to frequent a variety of restaurants on a regular basis. In the mean while, older diners usually are more persistent to try something new and different, and these diners perceive going out to eat in a restaurant as an opportunity to socialize in a welcoming and comfortable atmosphere. The young and older generations have very distinctive preferences for service quality, and there is significant differences between dining experience levels of customers of different ages.
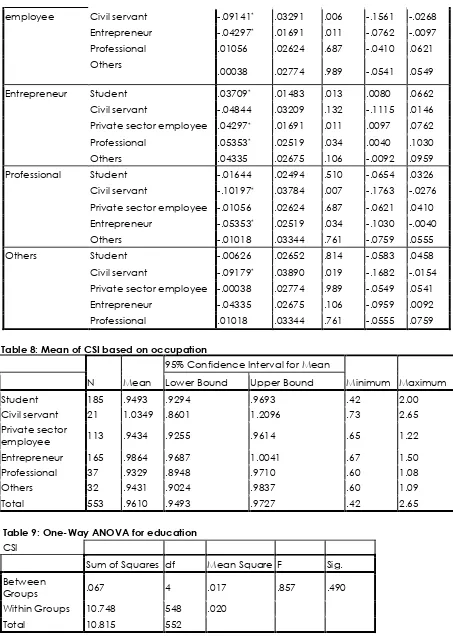
Consumers’ Satisfaction Differences based on Occupation
There is significant satisfaction differences between different occupation. This significant difference happens because type of occupation affects expectation and perception of a person when dine in the restaurants (Wilson & Gilligan, 2005).
………
Table 6
……… There are some types of occupation that have significant satisfaction differences toward service quality in restaurants. People who work as students, have significant satisfaction differences with civil servants and entrepreneurs. People who work as civil servants have significant satisfaction differences with private sector employees, professional, and other kind of jobs, such as housewife. People who work as private sector employees have significant satisfaction differences with entrepreneurs, and people who work as entrepreneurs have significant satisfaction differences with professional.
7
………
Table 7
……… The highest mean of customer satisfaction is civil servant group, that is 1.0349. It means that the consumers are very satisfied toward service quality in restaurants. The second highest mean of customer satisfaction is entrepreneur group, that is 0.9864 which means the consumers are satisfied to the restaurants’ service quality.
………
Table 8
……… Civil servants, in general, are people that are rarely dine in the restaurant. If someone rarely go to the restaurant, the expectation is usually lower, so that these people are easier to be satisfied than people who are always dine in the restaurant. Entrepreneurs are people who become the owner of his own business. These kinds of people know that making a perfect service quality is difficult and it makes these people understand and can accept more service quality that is given.
Based on the stated above, it can be seen that people with different occupation will have different satisfaction. Supporting the opinion of Wilson and Gilligan, the research of Haddad, Al-Dmour and Al-Zu’bi (2012) found that there is a significant relationship between occupation and the variance in customers’ satisfaction.
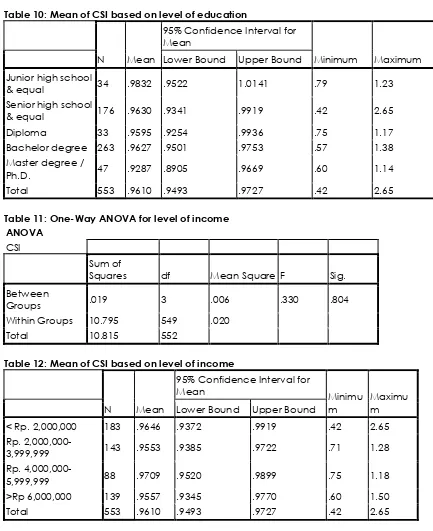
Consumers’ Satisfaction Differences based on Level of Education
There is no significant satisfaction differences between each level of education. People in all level of education are satisfied toward service quality in the restaurants.
………
Table 9
……… The post graduate level has the lowest customer satisfaction compared to the other levels. It can happen since a person who has high education level will have broader knowledge and the way of thinking that is more critical and complex so that the person will be more difficult to be satisfied.
………
Table 10
……… This is supported by the research that is done by Rahayu, that level of education affects customer satisfaction (2009). In addition, Frater (2006) said that guests with low education rating the quality of customer service higher than educated guests on their perceptions.
Xuemin and Xining said that education level influences the ideology. Moreover, education has an important effect on people’s consumption skills, hence education plays a role in helping improve consumers’ consumption quality and meet their consumption needs (Yuanji Zheng, 2011). Other support is comes from Haddad, Al-Dmour and Al-Zu’bi (2012), people with different education levels have different mentalities and needs that will match their different intellectual thinking hence the variance in satisfaction according to this variable.
Consumers’ Satisfaction Differences based on Level of Income
There is no significant satisfaction differences between customers in each level of income. Customers in all level of income have the same satisfaction toward restaurants’ service quality.
………
Table 11
8
Eventhough the customers in all level of income have the same satisfaction, still there are customers who have highest satisfaction. The highest is the customer in level of income IDR 4,000,000 – 5,999,999.
………
Table 12
……… Scott and Shieff suggested that consumers with different income levels have been found to have different perceptions of service quality. Consumers with higher income levels may perceive service quality differently from their lower-income counterparts (Lim, Bennett & Dagger, 2008). In addition, Yuanji Zheng (2011) said that income will affect a person values and preferences. Income is important indicators for consumer’s perception of service quality that will lead to satisfaction. Others, Kassim (2006) found that income is considered one of the most powerful factors in customer perception and satisfaction.
CONCLUSION
Based on the research, there are some conclusions as follows:
1. Empathy has the biggest customers satisfaction index, 0.9714 which means the consumers are satisfied
2. Customer satisfaction index is 0.9610 which means consumers are satisfied towards restaurants’ service quality
3. There are significant satisfaction differences toward service quality for the consumers of different gender and different occupation
4. There are no significant satisfaction differences toward service quality for the consumers with different age group, different level of education and different level of income
REFERENCES
Abdul Talib, S., Hashim, R., Karuthan, C. & Kumar, M. (2012). Malaysian fine dining restaurants: profiling of consumers’ demographics and dining-out behavior and determination of purchasing orientation via demographic features. Journal of Global Business and Economics, 5(1), 50-71.
Bruni, F. (2008, October 8). Old gender roles with your dinner. The New York Times, pg. 8. Frater, J.L. (2006). Quality of customer service: perceptions from guests in all-inclusive resorts in
jamaica. Proceeding of the Northeastern Recreation Research Symposium, 403-410. Haddad, A.E., Al-Dmour, H. & Al-Zu’bi, Z.M.F. (2012). Perceived service quality and customer
satisfaction: an empirical investigation of the rebranded telecommunication companies in Jordan. European Journal of Social Sciences, 34(1), 118-137.
Kartajaya, H. (2003). Marketing in venus. Jakarta: PT. Gramedia Pustaka Utama.
Kassim, N.M. (2006). Telecommunication industry in Malaysia: demographics effect on customer expectations, performance, satisfaction and retention. Asia Pacific Business Review, 12(4), 437-463.
Kotler, P. & Amstrong, G. (2006). Principles of marketing (11th ed). New Jersey: Prentice-Hall, Inc.
Kotler, P. & Keller, K. L. (2006). Marketing management (12th ed). Upper Saddle River: Pearson Education Intl, Inc.
Lamb, C.W., Hair, J.F. & McDaniel, C. (2004). Marketing (7th ed). South-western: Thomson. Lim, C.G., Bennett, R.R. & Dagger, T. (2008). The impact of service contact type and
demographic characteristics on service quality perceptions. Journal of Services Marketing, 22(7), 550-561.
Lovelock, C.H., Patterson, P.G., & Walker, R.H. (2011). Service marketing: people, technology, strategy (7th ed). Australia: Pearson Education Australia.
9
Rahayu, S.R. (2009). Pengaruh gender dan tingkat pendidikan terhadap kepuasan konsumen mengenai pelayanan Hypermart Solo Grand Mall. Retrieved July 20, 2012, from Muhammadiyah University Surakarta: http://etd.eprints.ums.ac.id.
Reynolds, J.S. & Hwang, J. (2006). Influence of age on customer dining experience factors at US Japanese restaurants. Tourismos: An International Multidisciplinary Journal of Tourism, 1(2), 29-43.
Seyanont, A. (2007). Comparative study of the service quality of casual dining restaurants in Phuket: perspective of Thai and international customers. Retrieved October 5, 2012, from Oklahoma State University: http://dc.library.okstate.edu.
Siddiqui, K., (2011). Individual differences in customer behavior. Interdisiplinary Journal of Contemporary Research in Business, 11(2), 475-485.
Tjiptono, F., & Chandra, G. (2005). Service, quality and satisfaction. Yogyakarta: Penerbit Andi.
Wijaya, O.A. & Yosin, M. (2012). Analisa tingkat kepuasan pelanggan terhadap kualitas layanan food court the square surabaya. (TA No. 33010305/MAN/2012). Unpublished undergraduate thesis, Universitas Kristen Petra, Surabaya.
Wilson, S. & Gilligan. (2005). Strategic marketing management. New Jersey: Prentice-Hall, Inc. Yuanji Zheng. (2011). A study of some of the factors determining the choice of international
restaurants by Bangkokians. AU-GSB e-journal, 4(1), 156-167
APPENDICES
Table 1: Mean and Customer Satisfaction Index for each dimension of service quality
VARIABEL MEAN HARAPAN MEAN
PERSEPSI
CSIEmpathy 4.0732 3.9566 0.9714
Reliability 4.3134 4.1368 0.9591
Tangible 4.1890 3.9983 0.9545
Responsiveness 4.4231 4.1835 0.9458
Assurance 4.4213 4.1260 0.9332
Table 3: Independent Sample T-Test for gender
Levene's Test for Equality of
Variances t-test for Equality of Means
F Sig. t df
Sig. (2-tailed)
Mean Difference
Std. Error Difference
95% Confidence Interval of the Difference
Lower Upper
CSI Equal variances
assumed 1.247 .265 2.261 551 .024 .02685 .01187 .00353 .05018
Equal variances not
assumed 2.304 507.986 .022 .02685 .01165 .00396 .04975
Table 2: Customer Satisfaction Index
N Minimum Maximum Mean Std. Deviation
CSI 553 .42 2.65 .9610 .13997
10
Table 4: One-Way ANOVA for age
CSI
Sum of
Squares df Mean Square F Sig.
Between
Groups .085 3 .028 1.453 .226
Within Groups 10.730 549 .020
Total 10.815 552
Table 5: Mean of CSI based on age
N Mean
95% Confidence Interval for Mean
Minimum Maximum Lower Bound Upper Bound
11-15 year 21 .9618 .9175 1.0062 .79 1.14 16-34 year 366 .9548 .9391 .9705 .42 2.65 35-46 year 122 .9650 .9459 .9842 .60 1.25 47-65 year 44 1.0006 .9619 1.0394 .65 1.50
Total 553 .9610 .9493 .9727 .42 2.65
Table 6: One-Way ANOVA for occupation
CSI
Sum of
Squares df Mean Square F Sig.
Between Groups .321 5 .064 3.344 .006
Within Groups 10.494 547 .019
Total 10.815 552
Table 7: LSD Post Hoc Test for occupation
(I) Occupation (J) Occupation
Mean Difference
(I-J) Std. Error Sig.
95% Confidence Interval
Lower Bound
Upper Bound
Student Civil servant -.08553* .03189 .008 -.1482 -.0229
Private sector employee .00588 .01654 .722 -.0266 .0384
Entrepreneur -.03709* .01483 .013 -.0662 -.0080
Professional .01644 .02494 .510 -.0326 .0654
Others .00626 .02652 .814 -.0458 .0583
Civil servant Student .08553* .03189 .008 .0229 .1482
Private sector employee .09141* .03291 .006 .0268 .1561
Entrepreneur .04844 .03209 .132 -.0146 .1115
Professional .10197* .03784 .007 .0276 .1763
Others .09179* .03890 .019 .0154 .1682
11
employee Civil servant -.09141* .03291 .006 -.1561 -.0268
Entrepreneur -.04297* .01691 .011 -.0762 -.0097
Professional .01056 .02624 .687 -.0410 .0621
Others
.00038 .02774 .989 -.0541 .0549
Entrepreneur Student .03709* .01483 .013 .0080 .0662
Civil servant -.04844 .03209 .132 -.1115 .0146
Private sector employee .04297* .01691 .011 .0097 .0762
Professional .05353* .02519 .034 .0040 .1030
Others .04335 .02675 .106 -.0092 .0959
Professional Student -.01644 .02494 .510 -.0654 .0326
Civil servant -.10197* .03784 .007 -.1763 -.0276
Private sector employee -.01056 .02624 .687 -.0621 .0410
Entrepreneur -.05353* .02519 .034 -.1030 -.0040
Others -.01018 .03344 .761 -.0759 .0555
Others Student -.00626 .02652 .814 -.0583 .0458
Civil servant -.09179* .03890 .019 -.1682 -.0154
Private sector employee -.00038 .02774 .989 -.0549 .0541
Entrepreneur -.04335 .02675 .106 -.0959 .0092
Professional .01018 .03344 .761 -.0555 .0759
Table 8: Mean of CSI based on occupation
N Mean
95% Confidence Interval for Mean
Minimum Maximum Lower Bound Upper Bound
Student 185 .9493 .9294 .9693 .42 2.00
Civil servant 21 1.0349 .8601 1.2096 .73 2.65
Private sector
employee 113 .9434 .9255 .9614 .65 1.22
Entrepreneur 165 .9864 .9687 1.0041 .67 1.50
Professional 37 .9329 .8948 .9710 .60 1.08
Others 32 .9431 .9024 .9837 .60 1.09
Total 553 .9610 .9493 .9727 .42 2.65
Table 9: One-Way ANOVA for education
CSI
Sum of Squares df Mean Square F Sig.
Between
Groups .067 4 .017 .857 .490
Within Groups 10.748 548 .020
12
Table 10: Mean of CSI based on level of education
N Mean
95% Confidence Interval for Mean
Minimum Maximum Lower Bound Upper Bound
Junior high school
& equal 34 .9832 .9522 1.0141 .79 1.23
Senior high school
& equal 176 .9630 .9341 .9919 .42 2.65
Diploma 33 .9595 .9254 .9936 .75 1.17
Bachelor degree 263 .9627 .9501 .9753 .57 1.38 Master degree /
Ph.D. 47 .9287 .8905 .9669 .60 1.14
Total 553 .9610 .9493 .9727 .42 2.65
Table 11: One-Way ANOVA for level of income ANOVA
CSI
Sum of
Squares df Mean Square F Sig.
Between
Groups .019 3 .006 .330 .804
Within Groups 10.795 549 .020
Total 10.815 552
Table 12: Mean of CSI based on level of income
N Mean
95% Confidence Interval for Mean
Minimu m
Maximu m Lower Bound Upper Bound
< Rp. 2,000,000 183 .9646 .9372 .9919 .42 2.65 Rp.
2,000,000-3,999,999 143 .9553 .9385 .9722 .71 1.28
Rp.
4,000,000-5,999,999 88 .9709 .9520 .9899 .75 1.18
>Rp 6,000,000 139 .9557 .9345 .9770 .60 1.50