1x1 m x % b q ! F a i l f m e a t af the R~qairemants For the blegree of
A e ~ ~ ~ u t i c a l Engineer
California fno&i$u$s of T e ~ B n ~ i o g y Pasadem, Califor mi&
1960
The author wishes to express his appreciation to EJrofesgior Lester L e e s whcss groundwork for this investigation was invalblable, and to Pxofeesor Tosbi Kubota for the great amount of time, energy, and expert guidance e w e - d e d in the r e ~ e a r c h . He i s gratefml to P4rI
~ 3 u l Baloga and member a cf the hyper s c n i ~ e s a f for sugge stione and asslismnce in all phases cf model pregasation and test; to Mr. C. A.
Bartosh and membass of the GALGPT machine o h c p far the careful production of models and t e s t devices; ta Mre. Betty Eaue and Miss Georgette Pauwels for t h ~ computing; to Mrs. Betly Wood and M r S.
Neil Kindig for preyu*raticn of the figurers; and to Mrs. Geraldine Van Gieson Lor the excellent typing of tha -nuscript.
The physical chtlracteristlcs of the ablation pawe ns are deesribed.
A theora?rical approach to calculate the heat transfer to the w a l l of an ablating body under flow conditions encounfared in the CALCIT hyperrrcnis.
tunnets is outlined. Simplification i e achieved by assunling the, -par pressure next to the sublimiag'body i e at its equilibri vaiue. The G A L G n hypersonic teat facilities ara deacrfbed briefly. Methods of nunufacture a r e given for COZ-ice, NZO-ice, and Gl0H1 60-ice models.
Teckmiquee a d special tesr eguipnient ueed in obtzrining experiments resultst with HZO-ice and
ClQNl6Q'i~e
(camphor) are dkiaeribed. An illuvtration of the computational technique used to determine the heat~ o n a f a s rate@ to the waif and the w a l l temperatux@ dietxibutisno i.8
included. Figures tc show the agreement batweea theory and experiment are presented and reasonable results are obtained for temperature
distribution, but heat-transfer rates [ablation rate@) are greates for
~ e a r y than far @xpaar%mekaE.
Acknowledgment 8
Abstract
Table sf Gontsnts List sf Figureo Eiat af Symbols
U.
Theory of Wsat Transfer to Ablating Bcdiea 5 U. 1. Goncentration and Stagnation EothlpyDistxibutions in the Boundary U y e r ,
LB = pr = Sc '= 1 5
3. Blowing Correction for N e a t Transfer 9
XU4 Gxper in,antal hvestigation BO
UX. 1
.
l n i t r o d u ~ t i s a BOaB0
2. W i n d Tunaels 10UI. 3. Model Support and Shield 11
Ux.4. M a w d a c ~ u r e of Models I d
III.
5. Exploratory T e s t s , Role cf the Tripla mint 14 Ulb. 6. Teat Conditioe~o f s z Q ~ n t i m e i v a 16HII.
9 . ataGathering Technique % 7UU.8. Equillbrim-Sbpe Modelrr 18
XV. R e s u l t s and Db scusaioa 22
Vo Goshg:Eusia;anas 28
PART P&*GE
Appendix A
--
Roperties of Materials 3 2Appsndix
B --
illustration of the ComputationalTechnique 3 4
Appendix G
--
Gorrectien for Canduetion Effects at&be Nose 37
Appendix D
--
Analysis of Equilibri 39LIST OF
4 The GALCIT Leg 2 Hypersonic
T
Leg 2 Model RoLecE~r
Solubility of BZ(PJZ) in H20 when Pirrtial Pressure of Gaa Plus H 2 0 Vapox messare.
=
1arm.
8 Severe Cratering of WZO-Ice Model in Leg 1 50 9 Goatrotled Gratering of M20-Ice Model in L e g 1 58 lbd HZO-Ice Madel i n Leg; f. After Quantitative Data
Run,
Po =
2.00 atm. 5 fl l
CIOH160wI~e
Model in Leg 1 Dwing Q ~ n t i t a t i v emta Run,
Po =
2 . 3 4 atm. 5412 S b p e for .H20-Ice Model in Leg 1,
= 2 . 0 0 atm. 5 2
,
EqubiBibri pe for C1 OH1 $Q-Pce Model in Leg 1
Po
= 2.34atm.15 Pressure Distribution can
-M =
5.8 Equilibrium-Shape Pressure Model, ClOHlBO*I~e 54
16 Ablation Rare a(. $ha Nose. HZO-Ice 17 Ablation mte at the Nose, HpO-Ice
Ablation Ptars at the Ncae, ClON1 $B-lce Ablation Rate at the Noss, CiON160-l~@
Ablation F ~ t o at the Nose,
CIOHi6Q-Ice
Surface Temperature, W 2 0 - l c eSurface Temperature, MZQ-Ice
Surface Tamperatura, G
ao
Pi a6 OmIce .Surface Temperature, CIOPI168-Ice
Ablation Heat T ransPe+ Rate Along Surface, WZO-lee
Ablation Neat Transfer Rate Along Surface, W,O-Ice
Ablation Meat Transfer Rate Along Surface.
C1 &0-Ice
Ablation Heat Transfer P3ate Along Surface,
C10H160-I~@
Abhtioa Heat Tranktfer Ra$a Along S U P ~ B C B 09
Aa,
= 5.8 Equilibxiura- pe Model, Gl0N1 60-Pce Axial Abiatfoa Rate Across theNo@@
Area onM = 5 . 8 Equilibri -Shape Model,
C10H160wI~e
m
e
P
specific heat at conc~tant prsesur e32 diameter of b&y
z
coefficient of m a a s diffusion of specie8 1 into species 2(9) in the g a s pbaee
$3 e f f e c t i v e heat capacity
k esaefficient sf ebarmal c&rradu~tivity
KE
se fracrion of subliming matextar1"i so fzactian of the ith species
Z~ internal heat capacity of aclid ternpa x0tu.r @
& rate of mass aildigion to the b o u n a ~ y layer
~a her, gp,/pw) C H o
Re.
~ ? rI? @ a t f c p3e"6?883Ug@
PO' sBgmtion p;a~e@bure behind narmel
smmtHc;
pv vapor prerPeure of t b ~ subliming X* ber, (ep p ) / k
4
local beat transfer rateh,
net heat transfer rate ts inf;er4sf0;3p of solid s radiue of curature st nose of bodyradiue of cross-seedion d body af revolution
r w a f r e e stream E;eyxlolds n her per u i t length
-..----
p ,
g
8) in the solid phase8 df stgnce along sufa'erce, nleasured from forward stagnation poinr
*
beg*( p / p ~ ~ 9
0 time
absolute temperaLure
v conlponenls of velocity parallel and normal to gas- eolid interface
axial ablation velocity
'8,IV *
L molecular weight of the ith species x axial distance, measured from nose
elope of curve G H J ~ N
=
I t9
Efabsolute viaccssity density
9 a n g a r diamnee from the nopie
air or gas composing free stream flow
flow quantities evaluated at outer edge of g a s bourndary layer aslid material
8 zero maas additioa; a l a s re,z;esvoir value
t3 solid
s. p. ~ t a g m t i o n p i n t
w waft
w f r ~ e stzean.1 ahead e8f bow s b c k wave
Ablation is the process whereby a body absorbs heat by giving up p r t of its nhasu, either by r~2ilelting w i t h or witixou svsporation, or by direct sublinlation from the eolid stare. Ablation s h i l a r to the type
~~a?r~icPereP;B i a this report ba f~uascE nicr~st ~5;$a~jf?+loaky ia M B ~ U P B S In t1'118 farm of meteorites which enter the earth's atmosphere at high vslocity and generally (if they are neitiler too large nor too sanall) ~ p c r i e e bofcro:
t hey strike the ground.
*
AbIaticn s b w s promise a s an engineering wwpon againsz high heat transfar rateaa d ,
high alaterisl temperatureai u several applications, the n.ost cbvicus being for noee cones of bllis- l i e mlseiles, or other bo4ieo entering the earth's atmosphere. Lees 2 yointn out that the heat transter rate at the throat 4f liquid fuel rocket nczales can be as high as 1000 B I ' u / ~ ~ . 2 see., and ~ l u e s of the order uf 2500
-
3000 BTV/P/~~.' soc. m ~ a y be reached at the forward stagnationSublimation abliltion or meIting ablation where
a
significant par- tion of the molten material is vaporised offerss
reduetion in the heat transfer rate to the b d y for two general xeaaons:(1) Absorption of it significant portion cf t$e incident heat in iataat h a t of sahib Eion (evaporation) of the body
( 2 ) Insulation of the bcdy by i t s own vapor in the boundary l a y e r . Gonsider a semi-infinite slab of material subjected to an im- pulsive consant beat transfer at the surlace.*%i Zfthe temperature, eha
9 Sin-I Cheng 1 pre seats gome interesting comments on and photographs of meteoric abfation. (Super scripts denote references at the emad ~f ~ Q X * .
**
L e e s 2 points out that a t r i a n g u l a r timewise d i s t r i b u t i o n of heat transfer s a t e is a good approximation to the heat pulse during r e e n t r y .distilnee from the surface, the :in:e, and ::?B heipk flu^ are denoted by T , X, t and for reapectivc'ly, then
where p, c, k, and K.
,
are rsgpectively the density, specific heat, rharrnal condue tivity and thar*mal diflueivity of the golida r f c (s) dsno tea the c plemenWr y error function. h parlicubr, at the @-face X s 0 , the tennperat*e i s given by
&ad henee, dvm. in the c&o@ 8f a% terra1 with high conductivity and heat capacity, there is a limit tc the h ~ a t transfer rate tbta~aintains eurface t~rnpratures below the fusion point a$ the material involved. When the materlal begins to malt
at
the surface, a c e r e f n amount ~f beat i sabsorbed i a changing the phase of the mataris1 f r gotid to liquid &ad
&e heat transfer into &a ~soEid iB@ rgduced by that amouat. (TBids d s a ~
nor aplJly to amcrphasoua terials wbjch do net b v e o sIa1.p melting temperature. )
tf
the Liquefied raaterial i s ccnvecfsd aamy from the melting region and resolidifies i n the region or' Low heat triznrsfer xateor i n the wake, namely if ~orodywrnic ablaticn occurs, the melted terial acts Eta an sgeat wMeh redistributes c r reduces the h a t t ~ a n s f e r to the aolid body. 5ubl tfon ablatioa affers
a
particularly good means cf regur;lting surface temperatures to tolerabla levelehecauea of Elre heat blocWng effect af the ablered material and abscabticn of heat by eke l a t ~ n t heat of a u b l h a t i o n . Ala'o a s seen by the G l a u s i u s ~
w h e s ~ Q t conseant, an increase ir T w i l t reg& in an increase in p V end hence he heat absorption and bloc-go effect by blowing will be
increased until a balanca is achiev-do By thig mechianis=, the teablarion pnociens i s self-regulating. 1x1. addition rhe vapor pssseure curve ver s u ~ i
tenlperarure i a B O steep trkdt theoretically one b.ss only lo fin4 a saritsabla n;arerial go reguhts the nlaximPwi> ter;.pcratuse experienced to a given leveL. Further, as shown by ~ r i a n : s ~ for applicaticn~ ~ u c h as recovery
of a s t e l l i t o rhs rcq.aired ~e~b~:-ei~iu- ior an ablating uosc cone n a y be l e s s t-n f o r a radiarinp noge conc +when zhs requixed -*eight f o r i n ~ d t i a n i s co;lsidered. Schemes where a gas is cjccred ar the nose of a body have tha! d i ~ d m ~ t a g e of excess vieight and mechanical c o f i ; ~ p l @ x i t y of p
am A . g a t i n g 1 devices, aild p f ~ ~ l b t 3 g ~
Lsee 6 9 8
'* ''
5, KuboLa,
Bethe and Adrns, Fay srnd Riddell, soberts9, and others tlave worked out the theory Ear the heat transferrare to bodiee in hypetsonic flaw including the e f f e c t s of ioniwkion,
d i s sochtion, combustlen in the bounder y byer, recombine$ion, radiatf on from the hot g a s e s behind the bow shock and hack lradiati~n from $he body.
By
speeialieing these general seaults to the conations existing in the GALCIT hyper sonib tunnels*, i t i s possible to o b a i n theoretical r eijultay be ueed to predict the salient iru3croscopic par
*
See page 10 for a brief description of tha GALCIT hyperlaonic facibitf @a.tem~perature, heat tranefes rate, and ablation rate for
a
given material, model s-pe, and tunnel operating conditions. These result@ are based on well under stood nuid mechanical sapects cf the p ~ o b l e m and allow the experimental r esul'ia obtained to atlrve a ea
check on the portions of the theory still retained. Si'ince the flow cc&itions in hyper sonic tunnel& of the GALCIT type ase now well known, it f s hoped that these reeulte will prove an intereeting supplamcsnt t o the result@ obtained in high energy Boareps such ae air arc jets and socket e aasts where highenthalpies are obtained, but where flow conditions are Lese wall known.
Lees 5 shows that for flows of b~llndary layer t y p e whers L e = Pr
=
Sc=
1,KA
and hs ~ a t i s f y identical diuer ent2sl equations. Hence*it the bounbry condittcns impsed cn Q and hB at the wall and rst the edge of the boundary lslyer are comprrtible, and EA and hs are slowly
w w
vsrying along the body surface, then the distributions of ha and
KA
w i l l be $ibihr. msbd %hi B f & ~ t , the? C O ~ @ @ E V & ~ ~ Q W g*~fchemical specie s, and defining
&(Ly +
tT)=
p, U, C (h * hA.
@ e W
Combining Eqo (1) and rbe above relations yields
ing Ulat the vapor preseure of the solid matarial is at i t s thermo- dymraig: equili bri
and Ep. f l ) becwnee
*
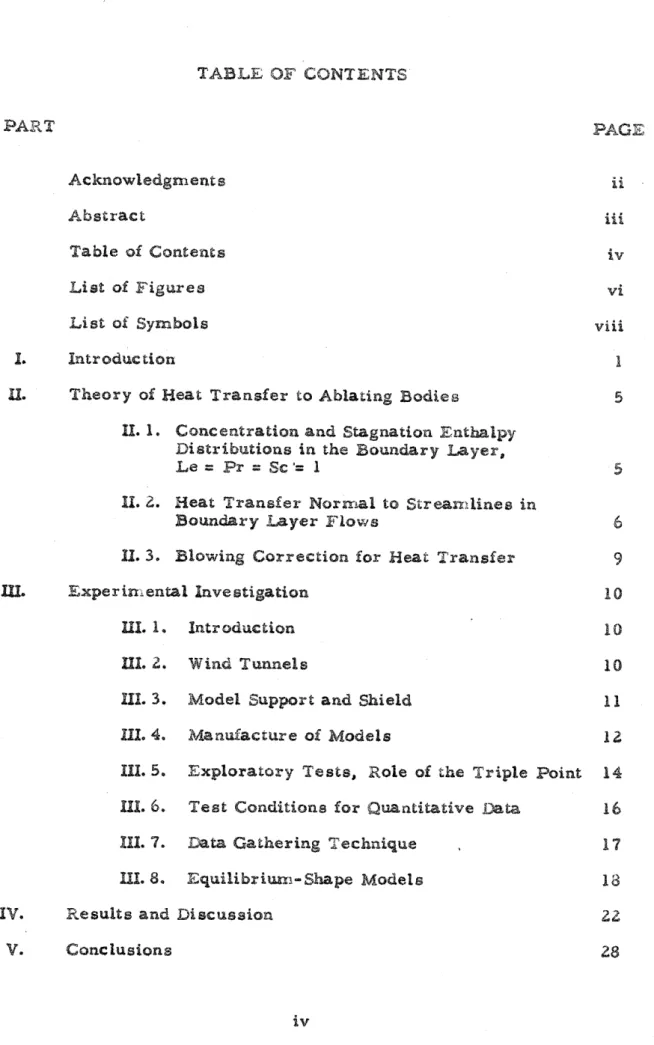
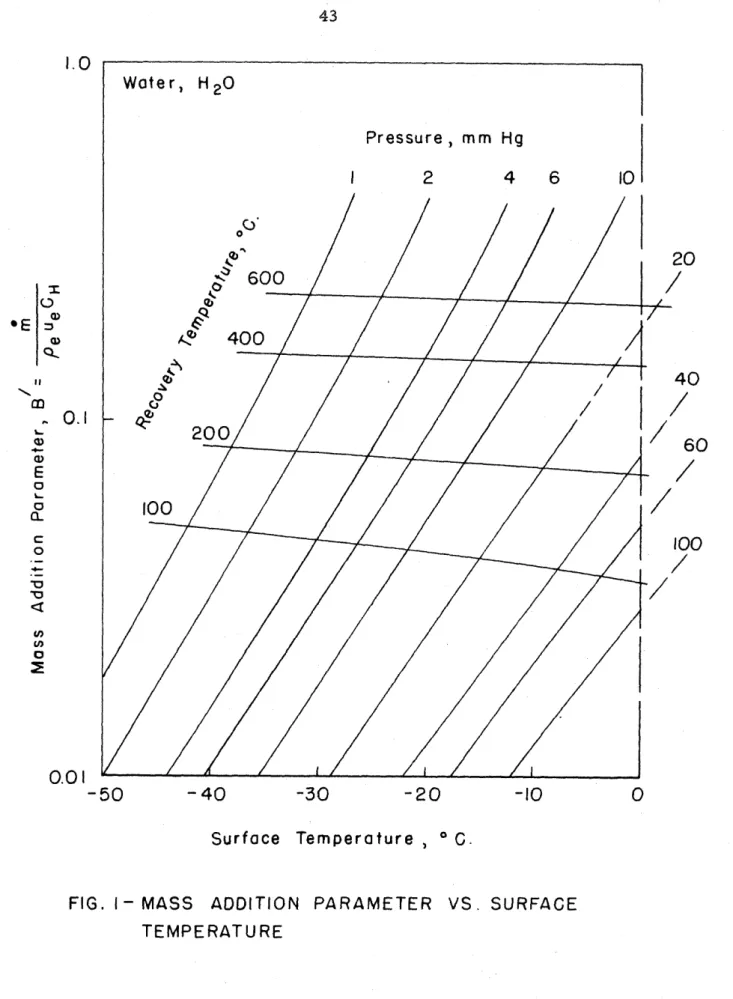
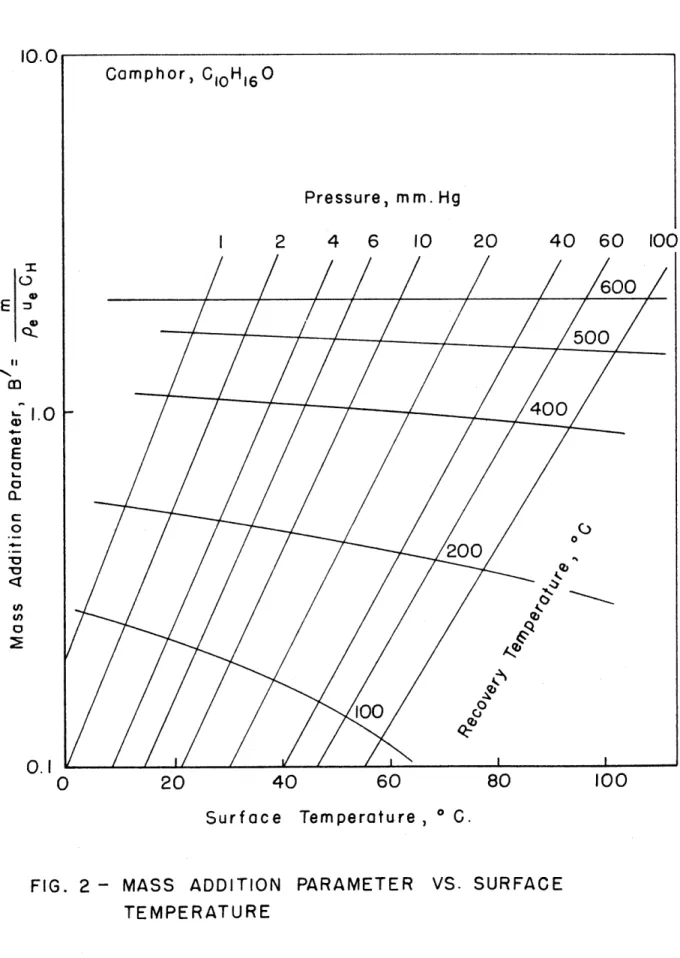
Figures 1 through 3 w e r e prepared by T. Kutota from 6 Eqs. (2)
Glausius-Clapeyron vapor prsseure equation. W i t h figures such as 1
*&rough 3 for 6% p a r t i c d r wall terial, the equilibrium wall temperature can immediately be determined once the recovery temperature and pressure distrf b a $ i ~ n are kgaowa.
(gas p b s e ) / / / / / / / / / / r
at the surface of any body immersed in
a
fluid. Coneider an ablating gas-@@lid interface with coordknates fixed in the interface.&a the ga pbase $hare are three terms t o be conaidered for the treat transfer at the wall:* (1) conduction to tba wall. (k 8T ) ;
s i ; ~
( 2 ) diffusion of different species ta the wall carrying their associated BKi
@ ~ ~ & I P Y *
(P Dl 1
hiIw
i (3) blowing of material away from itha wall
=
& hw (g).
In the $@lid pbase there are two term8 to be conaidered for the heat tranl~lfer at the wall: f l ) conduction of hmt into the interior of the '
solid*
4ps
; ( 2 ) convection of entbalpy to the wall (since the coordiwtes are fixed in the interface), 65 h, (s).
*.w
Hence balancing heat to the waH in tihe gas
=
heae sway from thehw(gl a
[C X~
hi] W(a) =
$< h, . ( g ) + ( l - P i ) l a (g)Ew &w Ew Aw
*
We ignore here radiation and chemical reactions at the wall.See Reference 5 for an accounting of the terms in the general case.
Substituting Lqs. (51, (61, and (7) in Eqo (4) and rearranging terms
where
1
hE (g)-
hE (s)]_
i s the &tent heat of sublimationLy .
Defining
Ga
= xihLT ,
6.2
(LV +
LT) = Be UeC
(h-
hA )E-I
' e wu GH (ha
-
hA ) thenI f 4 is takenaa pe
w @ w
Gw
5 x=h[ L V +
LT) 0In order to obtirin results that will allow use of pioneering work by other authors 10 in computing the heat transfer parameter, one can define
The c a s e of melting ablation is not considered here. In the case of body terials of high latest heat of sublimation and/or i c w conductivity. it i s poesible to ignore haat conduction into the sokid and take
The oxperlmenwl investigation of subliming ablation was conducted in t h ~ GALCIT hypersonic wind tunnels. The models used in the experf-
=&Gats w e r e hemisphere-cylinders of l-inch diameter made of H20-ice, CION1 60-ice, and GOZ-ice. In the fir st phase of the investigation, the nlodels were tested at wide ranges of temperature and pressure in order tc explore the general behavior cf these material@ in hypersonic air
streams. (See Sactian
UI.
5. )In
the aecond p h s e of the investigation, the temperature distributions and the rate e of ablation w e r e meaeured on NZO-ice a dCl
OWlbOwlce models. ltn the third phase of the investigatiotl, a e t a y of the equilibri e h a p s of ablating bodies was conducted w i t h W 2 0 - i c e and GH
O-ice models initially of hemisphere-@ ylinder sbaape.10 14
In addftfm to the a b k t i o n n~eadelo, two m e a l pa.eeBuge model8 were chine& with oriffceg d f ~ t x i b u l s d on thasi ~sr~%rEac$; one =&ode1 was of
\
hemis&ere-cylinder arbpe, and the other of $be "eguitibri
''
s b p e ~b&b~l~@gl;aa b b t f ~ n pg t e s ware computed by the method outlined in Seetion 11. and compared w i t h experimental values.
The experiments were performed in. the GAECIT hypersonic wind tunnels legs 1 and 2. Both tunnels are of the continuous running closed return type, and are supptied by the same compseseor plant, hence they are run alternately. The deaign features of these two tunnels are set
forth in the following table:
Leg 1 Leg 2
- - - - . - - -- -
m c h No. aangs 5.8 [mla?r%n) 6 eo l o
-% Reservoir Temp., OC 149 M a x Reservoir Preo~urs, peig 108 T e s t Section, a m e n a i ~ n s ~ b. 5 x 5
Leg 1 i s
a
fixed contour nozzle and leg 2 ie a virriable contour nozzle with ten pairs of hand-operated jacks. ( S e e Figure 4. ) Leg 2 is a complete operating 3/8 scale model of rha 21 x 2 i inch hypersonic tunnel at the Caltech Jet Propuleion Laboratory. Both legs 1 and 2 feature alltomatic control of the reoervcir temperature and pressure. The temperaturesare maintained by niclnr ome w i r e electrical-resistance heaters imm~diately preceding the t e s t seclicns.
Becau.se of the higi2 te~rperatures encountered in the CrALCIT leg 2 hypersdnic tunnel i t 18 necessary to bring t h ~ t el airaow up to t e n p ~ r a t u r e while the wind
is
blowing: also f l ~ w hati to be started atH ~ U C ~ Mgher pressures than w e r e used for these tests. Hence in order ta prseerve bodies w i t h low melting points cr htgh vapor presleure
cbrircter, such as HZO-iee or solid camphor (@
H
O), i t was man&-$6 16
tory tc protect the models from the airstream. This was acecmpliohed by withdrawing the model from. the ieirstrsarr~ rand holding it in a cooled
protective case which could be opened and a l l o w the model tc be, raised into the air stream through a cutout in the tunlie1 flcor after the deeired flow conditions had baan established. The device for accomplishing Cask is shown in Figure 5. Becauee of the high melting point cf camphor and the high Lidtent heat of HZ0-ice, i t was satisfactorgr tc coal the model
with ordinary atmospheric cooling air. Had GO3-ice or other low mairing point materials been tested in leg 2, cooler tsnnperaturtrs could have been obuined by using liquid
NZ
for the coaling medium. Cooling b y a means d liquidN2
wae t r i a d in leg 1 and model tsmperature?s on the order of - 2 0 0 ~ ~ were obtained.In
leg i because of the lower reservoir temperatures, i t is possible to bring the airnow up to full sagmtion temperature while the tunnel air is cbnneled through by-pass lines and then to establish flow in the tunnel at: full stagnation conditions in aboutcae minute after model installation; hence no device for model protection was; required.
rn
40The GOZ-ice models were first de by placing commercial dry ife in
a
high pressure mold kith micarta eting fixed in place. The GO2 was allowed to melt, and was then refrozen by immersing the mold i nLiquid
N2 .
The molds weze then tbawad to remove the atcdels which often came ouL with eoneiderable velocity (this can baa
dangerousneuver i f one i e eurioue enough t o look down into tbe mold). Later COZ-ice modele were nufactwad by compressing the crushed dry i c e
in
a
mold, which i s a far better and safer technique.The HZO-ice models w e r e the marat difficuit to g~ufactur e. Fji r
the air had to be removed from
a
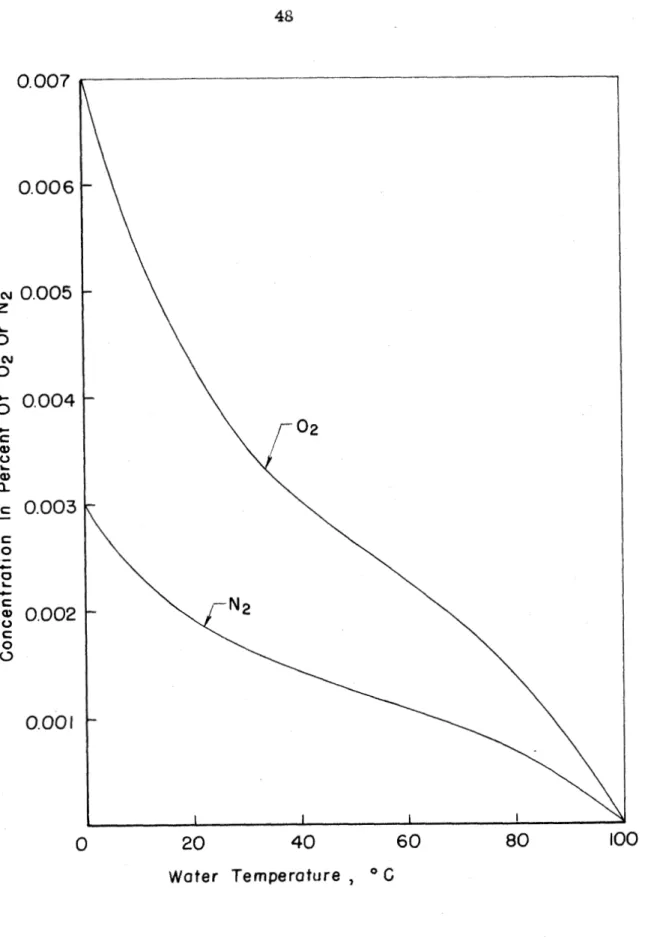
supply of distilled water by holding the water under mcuurn. The solubility of O2 andN2
inM20
i a given byHenry's law,
Ki
= St p.
4where
K
is concentration of the i ti2 gas species, Sr i e the coefficient cfH
eolubility at a given temperature, and p irr the partial presaure of the &as over the liquid. (See Figure 6 for values of
M
and KN in Hz8m )a2 2
Because of the solubility cbracterletlcrr of air in water, the gas over the water to be used f ~ r the models was evacuated of air for a period of
at lease one day to scavenge the air from the liquid. Then rha water was a e c t e d into molds with micarta stings fixed in place, held under if m c u and frozen (under vacuum) in an ordinary freeeez. In order for thiis
the anolde so that the bubbles of vapor, which bave a large area, w i l l scavenge all the air from the eyrtem. The greatest difficulty with HZQ-
i c e models lies in keeping the sides af the model. uniform. Any slight irregularity in eurface slope causes considerable variation in both
pressure and prestaure gradient, and hence heat transfer rate, or ablation rate, thus rnaking it very difficult to o b h i n good d a k repeatability with this type of model. These difficulties appeared to l a v e little effect cn the
surfme temperature distrlbutian, hawever, becauae of the steepness of the v a p r presauret cuxve varouo temperature.
Tha C1OHlbO-i~e models were made by pressing granulated earn- phor under 8000 ibs. hydraufie pressure in brass molds. This metbod produced models cf good dimensional accuracy and fairly uniform
denoity*, and is recommended Par G I O W l b O - i ~ e and GOZ-ice models.
The accuracy of r h i ~ technique is reflected in the u n i f ~ r m i t y of ablation results for the camphor models.
To
obtain model temperature data, copper-cons&ntsm thermo- couplee models wsrs de (See Figure 7. ), a t h the thermocouples fixedon the e a e r i o r of
a
hallow m ~ i c a r a sting. The thermocouple w i r e s were lead $a a ~ S r c ferentht dizection on the micsrl;st sting far 0.20 to 0 . 5 0 inch fro=. the thermoc~uple junction in order to decraage e r r o r s eauecd by conduction in the thermocouple wire itself. The i c e was then froeen on the stings in the ease of the WZO-ice model%, or depoolted in auecessivel a y e r s similar to
a
candle- model S.5 Z x g t s r a t ~ r v Testa: B&oIe o.f the TsfpPs mint
Exploratory teats w e r e r m in legs 1 and 2 w i t h HZO-ice and GOZ-ice models tc e ine general aspects of the ablation phenomena.
The n~odels were tested at zero angle of attack er Md@ ~ 0 n d i t l ~ n a d temperature and pressure and were viewed by Clae &-ked eye and through
a short focal length telescope. The GOZ-ice models w e r e found to exhibit fklring on the surface and hence to lose a W r g e s h r e cf their material by fragmentation.
**
For thia reason and bacauae ~f the? digficulties ofn;anufacture and storage of GOZ-ice models, no quantiative dam were attempted with this type of model. It should also be noted (See Figures
*
Tha wlue of the density achieved in this manner withC10H160*
i c e was 4 per cent lower %ban the value listed in phydcarl tizbles.
a* Other investigatorsiZ using GOZ-ice models b v e had difficulty with fragmentsr tion.
2 and 3. ) that the wlues of
B*
achieved with GOZ-ice and 6 1 0 H 1 6 C ) - % ~ ~ are very nearly the -me and ti~erafore preclude working with bothmaterials to spread the range of $3' values attainable. The miues of A h obtained with GOZ-ice w i l l be larger, however, because of .the lower
wall temperatures.
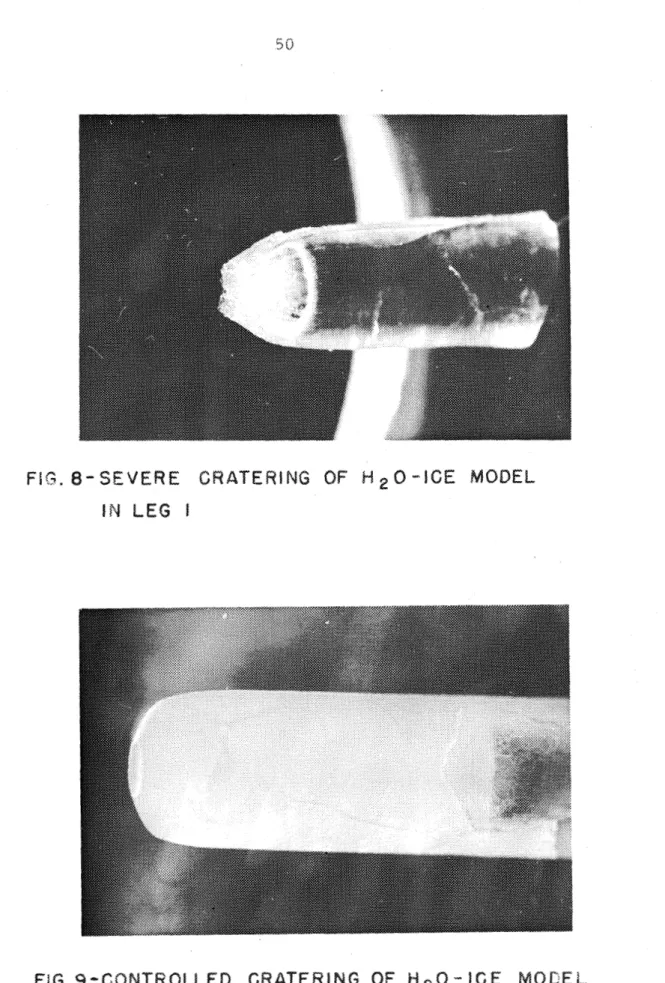
The H 2 0 - i c e modeis were observed to melt at the nose in leg I for supply pressures greater than 34 p ~ i a at To 2 149@6. If the pressure wae appreciably greater than tMt5 value,
a
distinct crater or melt regicn of gzeater or less aeverity would form at the nolae. depending on thegnitude cf the reservoir pressure. (See Figures 8 and 9.) T h e
raason for malting i a seen from the relationship between the p b s e s of a c r y e a t l i n e substance and the temperature and pressure (%e sketch. ).
In the sketch, the loeus of points OA represent the boilfng temperature of the given substance i n the liquid state at t h e corroajponding pressures the locus of points
OB
represents the melting conditiaas for the solids a t e ; the locus of points
OC
gfvca the conations under whfch the solid will sublima, and O i s the triple point at which all thee qtates may eaaA@C. The d o t t ~ d line from Q represeats suppreesion of the freeeing point, or supercooling. The triple poiar fog tkw ntcst comrncn form of ZZO-ice occurs at O@C and 0.0686 p e h pressure. At a recovery tcm- perature af 149 0 C in leg 1, it was found possible to hold T, less t b n O ~ C so lorag a srhe
reservoir pressure was l e ~ s than 2 atm. and melting at the nose w a s not t t p p r e n t at pressaree l e s s than 34 prria.Baeed on this sh&ple relationship and using Figure 1, i t i s easy to determine the reservoir conditions of ternpsrature and pressure which will induce stagnation p i a t melting at any given Xaach n
af tke low v i s c o s i t y of water, once the HZO-ice melted i t was ~onvected
b
away, thus causing the cratering effect. Malting was not a problem with any of the other rn~teterials thkt were tested.
Since say cratering w i t h the models made accurate qusntitative dsur imgossible to obtain, ell t e s t s with N20-ice models were run at reservoir gemperatares and pressures such t h t the model nose tsm- perature was approxin~ately O 0 6. I
The test conditions used for all quantitative da@ nneasuren~ents on ablation rate are set forth in the following chart:
Moo 5,8 8,O
OC 1 49 48 2
Po
am.(C10M160)
2. 34, 3. 79 5,86%
aem.(HZO)
2, OQ 3,70Angle of AtWck 8 Q
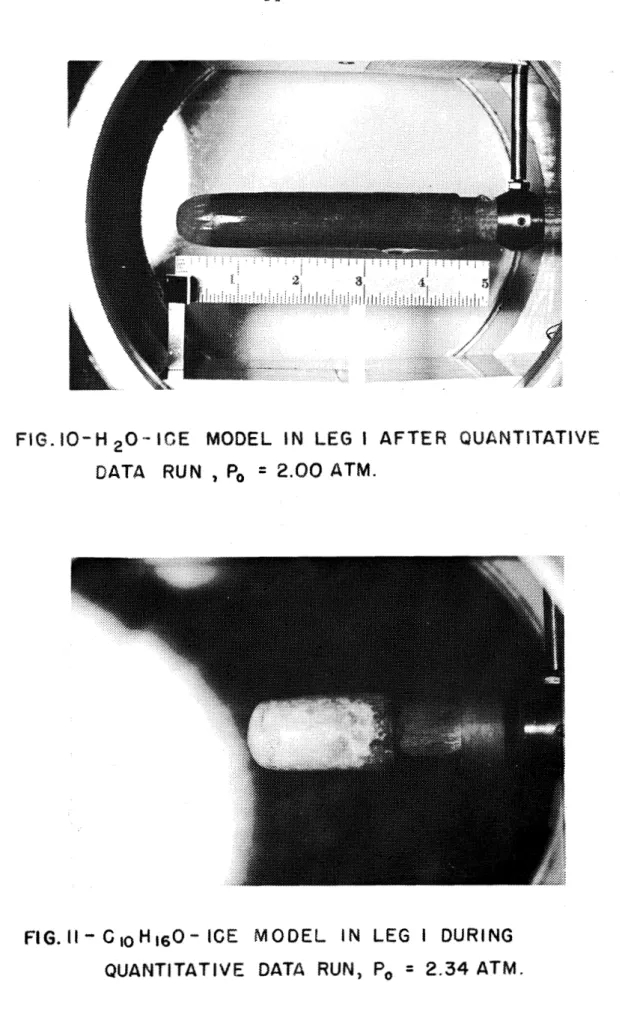
To obtain quantitative cia& on ablation rates, t i m e lapiae pharo- graphs w a r e taken of the model profiles w i t h
a
35 mm single~jlense r e f l e x camera fitted with a, 135 mm telephoto lensa w i t h extension tube for close w c r kBy
toking:a
eeries of photographsof
a model atspecified time p e r i d s during
a
run, a tima: laprae sesies of the abhtion prcceas wae obtlrined. The photographie f gea of ~kae model were later carefuHy measured on an optical cornparatas to aeewaciea on the order. c-f 0.0003 inches on the f i l m f. 001 inches absoluta), giving the ablation rate at all points on thht silhouette of the mially ~ymmetric body. (See Figures 10 rhrough 13. )
T h e Camera was inwlbriaably positioned at E~ast 3 $see from the
1-inch diameter model, hence the cosine error introduced in photographing the model silhouetrs was negligible. Errors rcaused by distortion in the photcgraphic process were cheeked by pbtogragiaing
a
&-inch ocale cmd measuring the inch mark@ on tha film; errors Prom this eourca are deemed t o have bean leaa than 0 . 1 per cent.Perhaps the largest source of error w a e lack of picture etarpness.
caused nlainly by the tunnel plate glasp, windows; this effect u7as aggravated by the oil always present in the funnel and found on the windows after tunnel o~mra tion.
3Aoilel ten2psrature a t a were recorded or, a Brown self-isalancing potentiometer, which w a s calibrated to the temperature of distillel ice slush and boiling distilled watel-. Becaj~se t e m p r a t a r e gradients will
exist within the nlatarial eveit a f t e r the wall temperature hae stabilized, accurate mil temperatuxe ilata are obtained only when the thermocouple is coincident with the gas-soliil i l t e r f a c e ,
To
minimize this effect, only~ ; ~ Q L T ) S C ten-iperatu~e data v,tMch w e r o obtained at the end of a data rran were used.
Model prassusa data w e r e recorded
on
a precision lead-serow mercusy micro-n~anometer for the higher presoures near the stagnation point (local body slope iriore t a n 45@ to the Qcw directioa) and a silicone oil multipze manometer bank for the pressure o r i f i c e s farther back on . the body. (See Figuses 14 and 15. )There is good reasoll to believe that an ablating body under con- ditions such as w e r e encountered in these t e s t o will approach an equilibrium
shape, if one cl;amines the two extrenies of body shape for laminar b o a n a r y layer flow: (1) If the nose s k a p ~ is highly ccnvex or pointed (see sketch)
heat tranefsz and E L ~ X ~ I T ~ U ~ ~ ab=1Xat%on rate x v i l l dcp@Cur at
"Lizs forward ~tbtgsation point and the body w i l t become more blunt;
(t)
Zf
the nose shape i s initfallg flat then the heat trander and ablation( 8 ) Highly Convex (b) Fkt Nose
03 NO@@
rstee near the @boulder are brger than at the forwazd stagnation point.
This fact can be seen from Eq. (91.
If
the nose i s Plat, then ue w i l l increase a e the flow opproach~s the shoulder;aleo
dueids will increase apprwehing idinityat
the corner.*
* ern^'^,
Rose. and Detra show axperimenrally and theoretically that the peak heat transfcr rate tor a flat-noaei! cylindrical body 4 t ha,
11 corner ra&us ie reached at the eahcgadesp and not art: the farward s t k g ~ t i o n point. ~ b o n e s l Lf px s experimental data to show that the
h p a e tranefer prameter,
~ u /
and the non-dimensional velocity, a@/&@,
increase very rapicily as t;hs sharp corxxer of a flat no%@ cylinder i o gkpprm~hed.Initially then, these two extremes in body sbape wtfi be expected to approach each other and there may exlst some intermediate s b p a ,
ao in
the f o r s g ~ f n g sketch.In
part (c) of the &katch, the feedback batweantsansfar rate per unit cross plecticn area i s nearly constant. wMle the ablation rate per unit crose aseftion area i e eona*mt.
The condition fos
an
rquilibri shape d e e d on eimple geomerrical~@n@idssstload 2 i IB
T . Kubolir* he& ammined the determiation of the equiLibri
ehape theorertically, ass in@
a
m d i f i e d Nawtonhn pres sura distribution near the etagnation p i s t ,as
0. and using the 8( ~ u / Iws
a s usedin
Beference 10. (Sic AppendicesB
and D. ) His reaults indicate tWt the radius at the r s a g ~ t i o n pPnt increase8 w i t h time.a Ae shown in AppendFv
D8
ha alao obtained b reeultwrlue for due/d(a/r) to f i t tMs relationship. ing an ellipsoidnrl nose e b p e one can determine the ratio of the
the ellipsoid that w i l l agree with ehis aquation For the fonditions of tha fiZO-fce at Po n 2.34 atmosphere&, MIp3 t 5.8, and
To =
149'~, hisresults indici~ta that the aquilibri ellipsoid determined by this equation
would bave i t s aaaJor
a d s
perpandlcuhr tb tha now ctlrection and a ratio of major axis to minor adsof
4.6 to ]I. For the eanditions of 610M160-ice atP
2 . 0 0 atmospPlerea,Mw
e 5.8 and To= L49
OC,hi@
resulte indicatethat an ellipsoid with i r e nlajor ads perpendicillar to the W w direction,
and
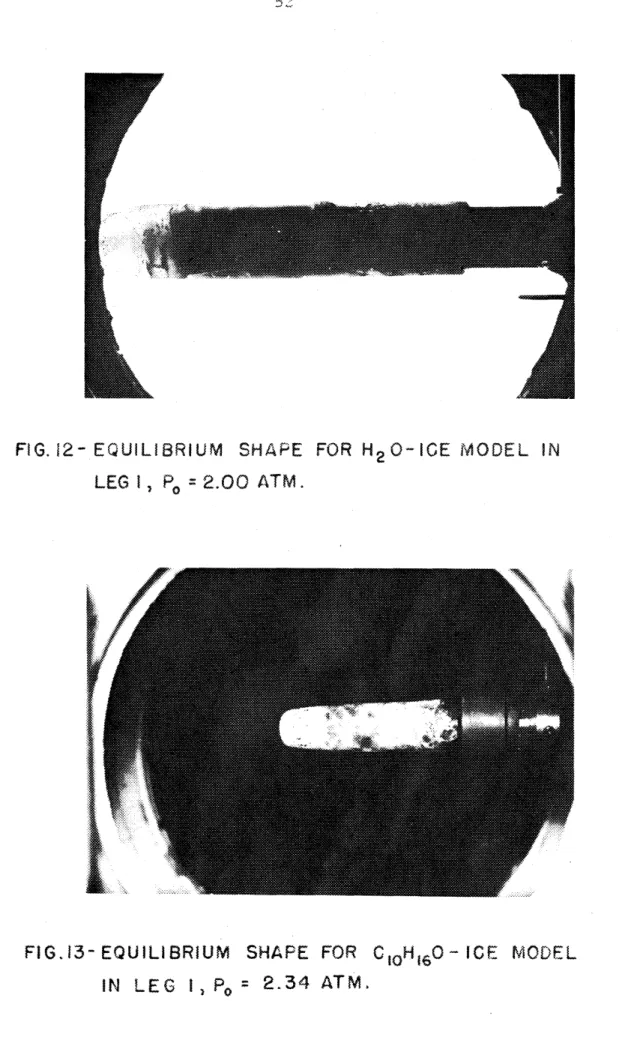
s ratio of amjor a x i s t6a anlncr arcis Df 6 . O t o 1 would be obained.To check these ideas, WZO+Lce and C 1 Q W 1 6 0 e I ~ e models with langth tct diameter ratios on the order of 7 were constructed and tested in leg 1.
(See Figuree 12 and 13. ) Tbatee moclela were run for 3 4 minutes and 39 minutas rerapectfvely to allow them to approach thais equilibri
sbpct 8s clolsely a s poseibla. An examination
cf
Figures 12 and 13indicates t b t the nose skpes can indeed ba quite accurately approximated by oblate elltpsoida with their 1 to the fksw diraceion out to the region cf @lopa. on the order of 30 degrees to the now d?lreeti~xo Fer the case of HZB-ise the ratio of major axis to minor
B obtained experimsntally w a ~ 1.7 to 1,
a d
forC W
0-ice the 10 It6GIOMl
bO-Lce moclel,a
preasutrs made1was
constsucted duplicating the fi~%Eal @hope of the actiuzl ~ 4 ~ d e L and w&la tested in leg 1 to determine the pseesure distributian along Ule surfrtce. From these pressure ata,cctlcaticns were n&ade af the haat t r a n e f e ~ rate and eac~psa2.ed w i t h the
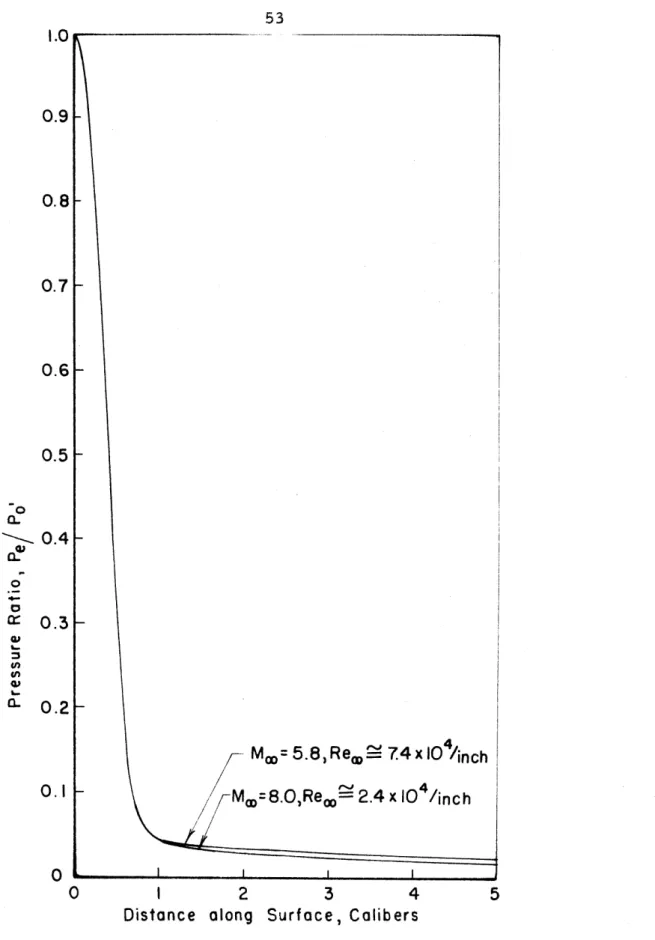
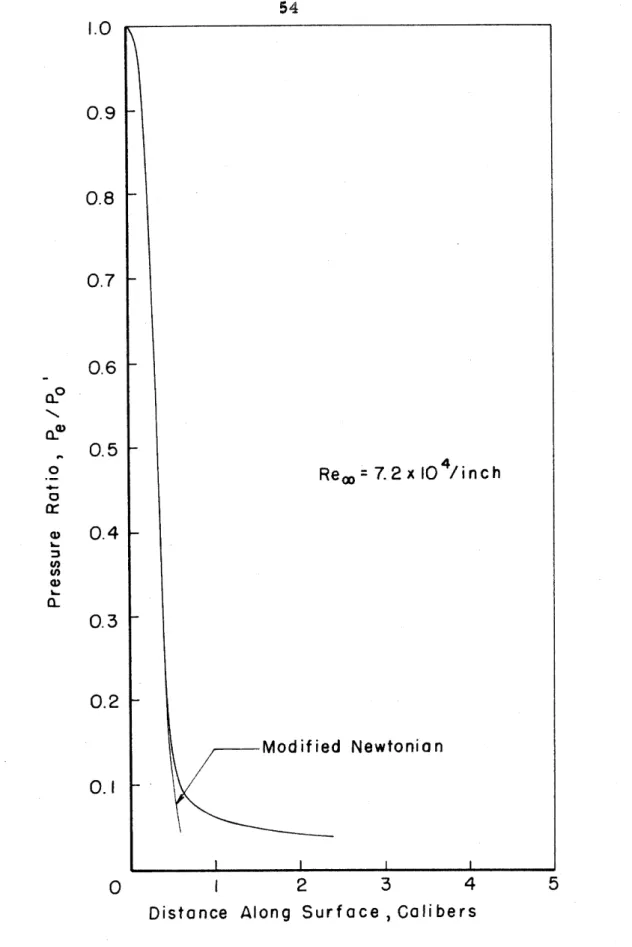
The prarraure distributions obtained for both the hemisphere- cylinder and the equitibri -shape m d s l s are pzesentad in Figures 14
and
15, respectively.PV. RESULTS AND
DISGUSSIQNParticutax hope for the accuracy of the experimental dlata i s derived from the excellent linearity Car the ablation rates at the nose.
(See Figuree 16 thsough 2 0 . f At the start of each teat there was an adjustment period while the gunel flow conditions and model temperature
stabilized although the tunnet was run for approxi tely 15 minutes at full r a ~ e r v o i r coladftio9ee;i baflklrra eals=h t e s t to deer-@@ $he efface@ of nrarozaitba
block temperature agiuetmcnt. Thsse transient effecte caueed some
lies ts accur in the abliatiaa rateo fer the first mfnuta or two 0%
each run. Hence, the plots of ablartion rate at the nose do not include the f i r s t data points where obvious errors were involved. That is,
t
=
0 and x O are taken at the time and nose p o i t i o n arbcut 2 minutee after the start of the flow. (The ablation rate at the nose is defined as th@ rate at wMch the nose rseedertis with time. )The temperature measuring system as
a
whols -- the Brown self- balancing potentiometer and the copper-constantan thermocouples-
waeQ o
cartainly accurate to within
-
1 C. However temperature gradients within the ablating matorfwls caused such islcatter in the experimentalFigures 21 through 25. ) The fact that the cnset of melting at the nose is predicted accurately and with good repeatability by Figure 1 in the kase of HZO-ice indicmrtee that the actual wall temperatures w e r e close to the theoretieat predictions.
A calcuhtion was carxiad out $0 @st% te the rate of conducttow of heat into the interior of the model,