Weights and Measurements
This section has been written to give you instant access to a table of weights and measurements when you are entering your recipes. You should understand that the table of weights and mea- surements is only approximate. You can never be precise for many reasons:
The moisture contents of products vary constantly.
The sizes of individual pieces or particles will vary from container to container.
The exact weight of a gallon or a pound of product is seldom a convenient, round number.
It is impractical to say that a pint of water is 1 9/10 cups. It is simpler 2 cups.
Products containing moisture become lighter as they dry out.
Wet products containing sugar become heavier when the moisture evaporates and they become thicker.
A cup of l our could weigh 4 ounces. If you sift it, it may weigh less.
Any measurement such as a level teaspoon or level cupful is seldom exactly accurate.
The most accurate measurements are l uid ounce (FZ), weight ounce (WZ), count (CT), or por- tion of a recipe (PR). These are the measurements that we use in this book and in this section, adopted from the Software Creation. Accuracy is essential in food and beverage cost control.
Practical Weights
The following products are used so frequently in recipes that it is simpler to use the practical weights and measures rather than the actual i gures. In the case of hydrogenated shortening and whipped butter, in which air is incorporated into the product, the exact weight should be used when using recipes for more than 25 servings. You make the decision according to your experi- ence and record it in weight ounces (WZ), l uid ounces (FZ), or count (CT) (Figure A-1).
Figure A-1
Product Pound Cup Ounce Tablespoon
PRACTICAL MEASURE 2 cups 8 WZ 2 tbl 1/2 WZ
Salts 2 1/8 cups 9 3/4 WZ 1 5/8 tbl 2/3 WZ
Fats/lard/butter 2 cups 8 WZ 2 tbl 1/2 WZ
Sugar granulated 2 1/2 cups 7 1/2 WZ 2 1/8 tbl 1/2 WZ
Whipped butter 2 2/3 cups 6 WZ 2 2/3 tbl 1/3 WZ
•
•
•
•
•
•
•
•
Appendix
Examples of Typical Weight Difference
Water weighs 8.14 pounds per gallon (WZ). Milk weighs 8.59 pounds per gallon (WZ).
Light syrup weighs 10 pounds per gallon (WZ). Honey weighs 11.75 pounds per gallon (WZ).
(1 gallon 5 128 l uid ounces (FZ)) (Figure A-2).
Figure A-2
Group Characteristics Example Cup Fluid Ounce Tablespoon Very dry, light, weight Oregano, whole 1 WZ 16 TBSP WZ 5 0.063 (1/16) Dry light leaves, ground Thyme leaf 2 WZ 8 TBSP WZ 5 0.125 (1/8) Moist product, ground Curry powder 4 WZ 4.5 TBSP WZ 5 0.250 (1/4) Wet products like meat Peaches, sliced 9 WZ 2 TBSP WZ 5 0.500 (1/2)
Ordinary liquids Water 8 WZ 2 TBSP WZ 5 0.500 (1/2)
Thick liquids Molasses 11.2 WZ 1.3 TBSP WZ 5 0.750 (3/4)
The following charts are for reference purposes.
Water Conversion from Fluid to Weight
Cups Pints Quarts
Fluid
Ounces Pounds and Ounces
0.5 0.25 0.125 4 0 4.00
1.0 0.5 0.250 8 0 8.25
1.5 0.75 0.375 12 0 12.50
2.0 1.00 0.500 16 1 0.50
2.5 1.25 0.625 20 1 4.75
3.0 1.50 0.750 24 1 9.00
3.5 1.75 0.875 28 1 13.00
4.0 2.00 1.000 32 2 1.25
4.5 2.25 1.125 36 2 5.25
5.0 2.50 1.250 40 2 9.50
5.5 2.75 1.375 44 2 13.75
6.0 3.00 1.500 48 3 1.75
6.5 3.25 1.625 52 3 6.00
7.0 3.50 1.750 56 3 10.25
7.5 3.75 1.875 60 3 14.25
8.0 4.00 2.000 64 4 2.50
Cups Pints Quarts
Fluid
Ounces Pounds and Ounces
8.5 4.25 2.125 68 4 6.50
9.0 4.50 2.250 72 4 10.75
9.5 4.75 2.375 76 4 15.00
10.0 5.00 2.500 80 5 3.25
10.5 5.25 2.625 84 5 7.25
11.0 5.50 2.750 88 5 11.50
11.5 5.75 2.875 92 5 15.50
12.0 6.00 3.000 96 6 3.75
12.5 6.25 3.125 100 6 8.00
13.0 6.50 3.250 104 6 12.00
13.5 6.75 3.375 108 7 0.25
14.0 7.00 3.500 112 7 4.25
14.5 7.25 3.625 116 7 8.25
15.0 7.50 3.750 120 7 12.50
15.5 7.75 3.875 124 8 1.00
16.0 8.00 4.000 128 8 5.00
Figure A-3 (concluded)
Abbreviations for Recipes (Unit Measure)
Unit of Measure Abbreviation Unit of Measure Abbreviation
milliliter ml large lge
demiliter dm medium Med
Liter L small Sm
package pkg inch In
Weight wt minute Min
volume vol gram G
Gram Gm ounce Oz.
Pound Lb. or # cup Cup or C.
pint pt. quart Qt.
Gallon Gal. each Ea.
Fluid ounce Fz weight ounce Wz
Count Ct Bunch Bch.
Batch B Dozen Doz.
teaspoon Tsp. or t. tablespoon Tblsp., Tbl., or TBL.
Figure A-4
Water Conversion from Fluid to Weight ( concluded )
Abbreviations for Inventory
Abbreviation Unit of Measure Abbreviation Unit of Measure
* weight not available bchd. bunched
bskt. basket bu. bushel
crt. crate ctn. carton
contr. container hmpr. hamper
lb. pound lyr. layer
oz. ounce pk. pack
pkg. package pt. pint
sk. sack std. standard
var. various wbd. wirebound
wrpd. wrapped
Figure A-5
Other Abbreviations
Abbreviations Unit of Measure ºF degree Fahrenheit
ºC degree Celsius
psi pressure per square inch
cm centimeter
in. inch
A.P. as purchased
E.P. edible portion (less preparation waste) Figure A-6
Common Abbreviations and Descriptions
Abbreviation
Ingredient
Description Abbreviation
Ingredient Description
AMR american CRSNT crescent
AST assorted CUBD cubed
BLNCHD blanched DCD diced
BM bilmar DETR detergent
Abbreviation
Ingredient
Description Abbreviation
Ingredient Description
BNLS boneless DRND drained
BRDED breaded DRSG dressing
BRKN broken DVL`S devil`s
BRSKT brisket EA each
BRST breast ENR enriched
BTRSCH butterscotch FD food
BUTR butter FLKD l aked
BX box FRNCH STYL french style
CAFF FREE caffeine free FRSH fresh
CANADN canadian FRZ-DRY freeze-dried
CAULFLWR caulil ower FURN furniture
CHED cheddar GB goldberger
CHIN chinese GERSTYL german style
CHIPD chipped GM general mills
CHLLD chilled GRHM graham
CHOC chocolate GRN green
CHOPD chopped GRND ground
CKD cooked GRTD grated
CLEAND cleaned HLF half
CLEND & HULD cleaned and hulled HLVD halved
COARSLY coarsely HLVS halves
COTT cottage ICBRG iceberg
CRMBLD crumbled IND individual
CRNBRY cranberry INST instant
CRND corned ITAL italian
CRSHD crushed JUL julienne
Figure A-7 (continued )
Common Abbreviations ( continued )
Common Abbreviations ( concluded )
Abbreviation
Ingredient
Description Abbreviation
Ingredient Description
KELGS Kellog’s PROV provolone
LNTHWSE lengthwise PRTNS portions
LO FT low fat PS paper supplies
LO SOD low sodium PUR purpose
LRG large QTRS quarters
LT SYR light syrup RCH Rich’s
LVS leaves RGH rough
MAND Mandarin RND round
MARA maraschino RNSD rinsed
MEX Mexican RSTD roasted
MNCD minced S LEE Sara Lee
MOZZ mozzarella SAND sandwich
MSHD mashed SAUT sauteed
MTLS meatless SCRD scored
ND nondairy SDLS seedless
NTRL natural SECT sections
OZ ounce SED seeded
PCKD precooked SEMISWT semisweet
PCKLD pickled SOFTND softened
PCS pieces SHRED shredded
PELD peeled SHVD shaved
PIZA pizza SIRLN sirloin
PK packet SL slices
PLD pulled SLCD sliced
PLN plain SLCS slices
PLSTC plastic SLD solid
PNUT peanut SMKD smoked
PR pair SNKA Sanka
PRECKD precooked SP spice
PREM premium SPLT split
Gram Weight Conversion Table
NOTE: When you know the weight ounces, multiply by 28.35 to i nd the grams. Divide the grams by 453.6 to i nd the pounds.
Ounces Grams Pounds Grams
1 28.35 1 453.6
2 56.70 2 907.2
3 85.05 2.5 1134.0
4 113.40 3 1136.8
5 141.75 4 1814.4
6 170.10 5 2268.0
7 198.45 6 2721.6
8 226.80 7 3175.2
9 255.15 8 3628.8
10 283.50 9 4082.4
11 311.85 10 4536.0
12 340.20 15 6804.0
13 368.55 20 9072.0
14 396.90 25 11340.0
15 425.25 30 13608.0
16 453.60 35 15876.0
17 481.95
18 510.30
19 538.65
20 567.00
21 595.35
22 623.70
23 652.05
24 680.40
Figure A-8
Standard Measures References
Beverage Yield Chart: U.S. Measurement System
Size per Bottle Quart
Yield per 1 21/8 oz Drink
Yield per 1 21/4 oz Drink
Yield per 1 21/2 oz Drink
10/10 32.0 oz 28.3 25.6 21.3
9/10 28.8 oz 25.5 23.0 19.2
8/10 25.6 oz 22.7 20.5 17.1
7/10 22.4 oz 19.8 17.9 14.9
6/10 19.2 oz 17.0 15.4 12.8
5/10 16.0 oz 14.2 12.8 10.6
4/10 12.8 oz 11.3 10.2 8.5
3/10 9.6 oz 8.5 7.7 6.4
2/10 6.4 oz 5.7 5.1 4.3
1/10 3.2 oz 2.8 2.6 2.1
Size per
Bottle Fifth
Yield per 1 21/8 oz Drink
Yield per 1 21/4 oz Drink
Yield per 1 21/2 oz Drink
10/10 25.6 oz 22.7 20.5 17.1
9/10 23.04 oz 20.4 18.4 15.4
8/10 20.48 oz 18.1 16.4 13.6
7/10 17.96 oz 15.9 14.4 12.0
6/10 15.36 oz 13.6 12.3 10.2
5/10 12.80 oz 11.3 10.2 8.5
4/10 10.24 oz 9.1 8.2 6.8
3/10 7.68 oz 6.8 6.2 5.1
2/10 5.12 oz 4.5 4.1 3.4
1/10 2.56 oz 2.3 2.1 1.7
Metric Size Fluids
Metric
U.S. FL.
OZ.
3/4 Oz.
1 Oz.
1 21/8 Oz.
1 21/4 Oz.
1 21/2 Oz.
Closest Previous Container
(U.S. Oz.) 1.75 Liter 59.2 78.9 59.2 52.6 47.4 39.5 1/2 Gal. 5 64 oz.
1.0 Liter 33.8 45.1 33.8 30.0 27.0 22.5 Qt. 5 32 oz.
750 Milliliters 25.4 33.9 25.4 22.6 20.3 16.9 5th 5 25.6 oz.
500 Milliliters 16.9 22.5 16.9 15.0 13.5 11.3 Pt. 5 16 oz.
200 Milliliters 6.8 9.1 6.8 6.0 5.4 4.5 1/2 Pt. 5 8 oz.
50 Milliliters 1.7 Miniature 5 1.6 oz.
Figure A-9
Size per Bottle 1/2 Gallon
Yield per 1 21/8 oz Drink
Yield per 1 21/4 oz Drink
Yield per 1 21/2 oz Drink
10/10 64 oz 56.6 51.2 42.7
9/10 57.6 oz 51.0 46.1 38.4
8/10 51.2 oz 45.3 41.0 34.1
7/10 44.8 oz 39.6 35.8 29.9
6/10 38.4 oz 34.0 30.7 25.6
5/10 32.0 oz 28.3 25.6 21.3
4/10 25.6 oz 22.7 20.5 17.1
3/10 19.2 oz 17.0 15.4 12.8
2/10 12.8 oz 11.3 10.2 8.5
1/10 6.4 oz 5.7 5.1 4.3
Size per Bottle Liter Ounces
Yield per 1 21/8 oz Drink
Yield per 1 21/4 oz Drink
Yield per 1 21/2 oz Drink
10/10 33.8 29.9 27.0 22.5
9/10 30.4 26.9 24.3 20.3
8/10 27.04 23.9 21.6 18.0
7/10 23.66 20.9 18.9 15.8
6/10 20.28 18.0 16.2 13.5
5/10 16.90 15.0 13.5 11.3
4/10 13.52 12.0 10.8 9.0
3/10 10.14 9.0 8.1 6.8
2/10 6.76 6.0 5.4 4.5
1/10 3.38 3.0 2.7 2.3
Size per Bottle 750 ml Ounces
Yield per 1 21/8 oz Drink
Yield per 1 21/4 oz Drink
Yield per 1 21/2 oz Drink
10/10 25.4 22.4 20.3 16.9
9/10 22.86 20.2 18.3 15.2
8/10 20.32 18.0 16.2 13.5
7/10 17.78 15.7 14.2 11.9
6/10 15.24 13.5 12.2 10.2
5/10 12.70 11.2 10.1 8.5
4/10 10.16 9.0 8.1 6.8
3/10 7.62 6.7 6.1 5.1
2/10 5.08 4.5 4.1 3.4
1/10 2.54 2.3 2.0 1.7
Figure A-10 (continued on next page)
Beverage Yield Chart: U.S. Measurement System
( continued )
Size per Bottle
1.75 liters Ounces
Yield per 1 21/8 oz Drink
Yield per 1 21/4 oz Drink
Yield per 1 21/2 oz Drink
10/10 59.2 52.3 47.3 39.5
9/10 53.28 47.1 42.6 35.5
8/10 47.36 41.9 37.9 31.6
7/10 41.44 36.6 33.1 27.6
6/10 35.52 31.4 28.4 23.7
5/10 29.6 26.2 23.7 19.7
4/10 23.68 20.9 18.9 15.8
3/10 17.76 15.7 14.2 11.8
2/10 11.84 10.5 9.5 7.95
1/10 5.92 5.2 4.7 3.9
Figure A-10
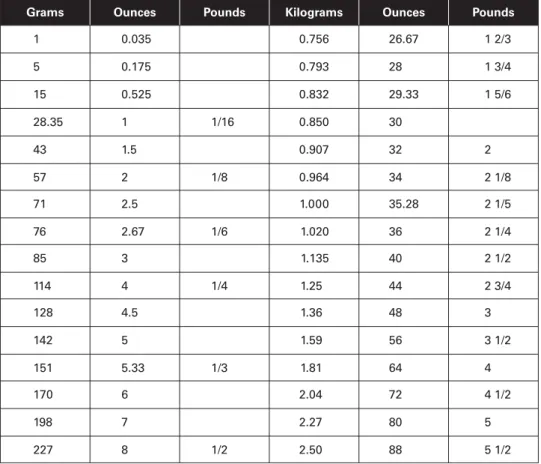
Approximate Equivalents in Metric and U.S. Measures of Weight
Grams Ounces Pounds Kilograms Ounces Pounds
1 0.035 0.756 26.67 1 2/3
5 0.175 0.793 28 1 3/4
15 0.525 0.832 29.33 1 5/6
28.35 1 1/16 0.850 30
43 1.5 0.907 32 2
57 2 1/8 0.964 34 2 1/8
71 2.5 1.000 35.28 2 1/5
76 2.67 1/6 1.020 36 2 1/4
85 3 1.135 40 2 1/2
114 4 1/4 1.25 44 2 3/4
128 4.5 1.36 48 3
142 5 1.59 56 3 1/2
151 5.33 1/3 1.81 64 4
170 6 2.04 72 4 1/2
198 7 2.27 80 5
227 8 1/2 2.50 88 5 1/2
Figure A-11 (continued)
Beverage Yield Chart: U.S. Measurement System
( concluded )
Grams Ounces Pounds Kilograms Ounces Pounds
255 9 2.72 96 6
283 10 2.95 104 6 1/2
302 10.67 2/3 3.18 112 7
312 11 3.63 128 8
340 12 3/4 4.08 144 9
368 13 4.54 160 10
378 13.33 5/6 5.44 192 12
397 14 5.90 208 13
425 15 6.35 224 14
454 16 1 7.26 256 16
510 18 1 1/8 8.17 288 18
529 18.67 1 1/6 9.07 320 20
567 20 1 1/4 10.89 384 24
605 21.33 1 1/3 12.70 448 28
623 22 13.60 480 30
681 24 1 1/2 14.51 512 32
737 26 18.14 640 40
Figure A-11 (concluded)
Equivalent Measures for Fluids
NOTE: This table gives measurement/weight equivalencies for water. Other liquids may vary.
3 Teaspoons = 1 Tablespoon
16 Tablespoons = 1 Cup
28.35 Grams = 1 Ounce
1 Cup = 1/2 Pint
2 Cups = 1 Pint
2 Pints = 1 Quart
4 Quarts = 1 Gallon
768 Teaspoons = 1 Gallon
1 lb (water)* = 16 Fluid Ounces
1 lb (water)* = 1 Fluid Pint
2 lb (water)* = 1 Fluid Quart
Figure A-12
Approximate Equivalents ( concluded )
Volume Conversions for Recipe Writing
Teaspoon Tablespoon Quart Cup
1 Teaspoon 1.0 0.333333 0.0052083 0.020833
1 Tablespoon 3.0 1.0 0.015625 0.062500
1 Cup 48.0 16.0 .25 1.0
1 Pint 96.0 32.0 .50 2.0
1 Quart 192.0 64.0 1.0 4.0
1 Gallon 768.0 256.0 4.0 16.0
Figure A-13
Common Measurements and Conversions
Weight Volume (Fz) Count (Ct)
grams teaspoons each
ounces cups slices
pounds pints can
quarts bottle
gallons leaves
Figure A-14
Pounds and Ounces to Grams
Ounces To Grams Pounds To Grams
1 28.35 1 453.60
5 141.75 5 2268
10 283.50 10 4536
12 340.20 25 11340
16 453.60 50 22680
Figure A-15
Teaspoon and Tablespoon
Teaspoons Tablespoons
3 Teaspoons 5 0.5 Ounce 1 Tablespoon 5 3 Teaspoons 6 Teaspoons 5 1 Ounce 2 Tablespoons 5 1 Ounce 48 Teaspoons 5 1 Cup 4 Tablespoons 5 .25 Cup 96 Teaspoons 5 1 Pint 8 Tablespoons 5 .5 Cup 192 Teaspoons 5 1 Quart 16 Tablespoons 5 1 Cup 960 Teaspoons 5 5 Quarts 128 Tablespoons 5 .5 Gallon 768 Teaspoons 5 1 Gallon 256 Tablespoons 5 1 Gallon
Metric Equivalents: Weights
1 Gram 0.3547 Wz 1 Wz 28.35 Grams
1 Kilogram 2.2046 Pounds 1 Pound 0.454 Kilograms
1 Metric Ton 1.1023 English 1 English Ton 0.9072 Tons 1 Kilogram 1000 Grams
Figure A-17
Dry Measures
2 pints 1 quart 4 pecks 1 bushel
8 quarts 1 peck 36 bushels 1 chaldron
28.35 grams 1 WZ 8 WZ .5 pound
226.80 grams 8 WZ 16 WZ 1 pound
453.60 grams 16 WZ
Figure A-18
Liquid Measures
3 teaspoons 1 tablespoon 2 pints 1 quart
16 tablespoons 1 cup 4 quarts 1 gallon
2 cups 1 pint 31 ½ gallons 1 barrel
4 gills 1 pint 2 barrels 1 hogshed
Figure A-19
Other Equivalencies
1 pound 16 WZ
1 cup 8 FZ
1 pint 2 cups (16 FZ) 1 quart 2 pints (32 FZ) 1/2 gallon 2 quarts (64 FZ) 1 gallon 4 quarts (128 FZ) Figure A-20
Avoirdupois
16 drams 1 WZ 112 pounds 1 long hundredweight (CWT)
16 ounces 1 pound 4 quarters 1 hundredweight
25 pounds 1 quarter 2000 pounds 1 short ton
100 pounds 1 short hundredweight (CWT) 2240 pounds 1 long ton Figure A-21
Measure of Volume
1 Cu. Centimeter 5 0.061 Cu. Inch 1 Cu. Inch 5 16.39 Cu. Centimeters 1 Cu. Decimeter 5 0.353 Cu. Foot 1 Cu. Foot 5 28.317 Cu. Decimeters 1 Cu. Meter 5 1.308 Cu. Yard 1 Cu. Yard 5 0.7646 Cu. Meter
1 Ster 5 0.2759 Cord 1 Cord 5 3.642 Steres
1 Liter 5 0.908 QuartDry 1 Quart Dry 5 1.101 Liters 1 Liter 5 1.0567 Quarts Liquid 1 Quart Liquid 5 0.3785 Liter 1 Dekaliter 5 2.6417 Gallons 1 Gallon 5 0.3785 Dekaliter
1 Dekaliter 5 0.135 Peck 1 Peck 5 0.881 Dekaliter
1 Hektoliter 5 2.8375 Bushels 1 Bushel 5 3.524 Hektoliters Figure A-22
Linear Measure
1 Centimeter 5 0.3937 Inch 1 Inch 5 2.54 Centimeters 1 Decimeter 5 0.328 Feet 1 Foot 5 3.048 Decimeters 1 Meter 5 1.0936 Yards 1 Yard 5 0.9144 Meter 1 Dekameter 5 1.9884 Rods 1 Rod 5 0.5029 Dekameter 1 Kilometer 5 0.62137 Mile 1 Mile 5 1.6093 Kilometers Figure A-23
Square Measure
1 Sq. Centimeter 5 0.1550 Sq. Inch 1 Sq. Inch 5 6.452 Sq. Centimeters 1 Sq. Decimter 5 0.1076 Sq. Inch 1 Sq. Foot 5 9.2903 Sq. Decimeters 1 Sq. Meter 5 1.196 Sq. Yards 1 Sq. Yard 5 0.8361 Sq. Meter 1 Acre 5 3.954 Sq. Rods 1sq. Rod 5 0.2529 Acres
1 Hectare 5 2.47 Acres 1 Acre 5 0.4047 Hectare
1 Sq. Kilometer 5 0.386 Sq. Mile 1 Sq. Mile 5 2.59 Sq. Kilometers
Fractional Equivalents for Use in Converting Recipes
The following chart is designed to help you change fractional parts of pounds, gallons, cups, etc., to accurate weights or mea- sures. For example, reading from left to right, the table shows that 7/8 of a pound is 14 ounces, 1/3 of a gallon is 1 quart plus 1 1/3 cups, 1/16 of a cup is 1 tablespoon, and so on.
1 Tablespoon 1 cup 1 pint 1 quart 1 gallon 1 pound
1 3 tsp. 16 TBL. 2 cups 2 pints 4 quarts 16 WZ
7/8 2 1/2 tsp. 1 cup less 2 TBL 1 2/3 cups 3 1/2 cups 3 quarts 1 1 pint 14 WZ
3/4 2 1/4 tsp. 12 TBL. 1 1/2 cups 3 cups 3 quarts 12 WZ
2/3 2 tsp. 10 TBL. 1 2 tsp. 1 1/3 cups 2 2/3 cups 2 quarts 1 2 2/3 cups 10 2/3 WZ 5/8 2 tsp. (scant) 10 TBL. 1 1/4 cups 2 1/2 cups 2quarts 1 1 pint 10 WZ
1/2 1 1/2 tsp. 8 TBL. 1 cup 2 cups 2 quarts 8 WZ
3/8 1 1/8 tsp. 6 TBL. 3/4 cup 1 1/2 cups 1 quart 1 1 pint 6 WZ
1/3 1 tsp. 5 TBL. 1 1 tsp. 2/3 cup 1 1/3 cups 1 quart 1 1 1/3 cups 5 1/3 WZ
1/4 3/4 tsp. 4 TBL. 1/2 cup 1 cup 1 quart 4 WZ
1/8 1/2 tsp. (scant) 2 TBL. 1/4 cup 1/2 cup 1 pint 2 WZ
1/16 1/4 tsp. (scant) 1 TBL. 2 TBL. 4 TBL. 1 cup 1 WZ
Figure A-25
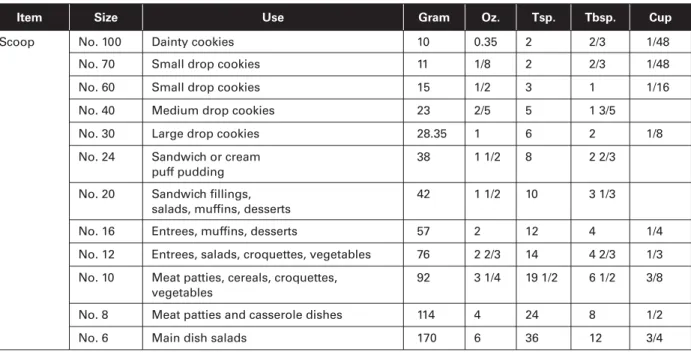
Food Portioning Aids
Hint:
A pastry bag with tip may be used for portioning meringue for shells, i lling cream puffs, stufi ng eggs, and adding dressing to salads.
Item Size Use Gram Oz. Tsp. Tbsp. Cup
Scoop No. 100 Dainty cookies 10 0.35 2 2/3 1/48
No. 70 Small drop cookies 11 1/8 2 2/3 1/48
No. 60 Small drop cookies 15 1/2 3 1 1/16
No. 40 Medium drop cookies 23 2/5 5 1 3/5
No. 30 Large drop cookies 28.35 1 6 2 1/8
No. 24 Sandwich or cream puff pudding
38 1 1/2 8 2 2/3
No. 20 Sandwich i llings, salads, mufi ns, desserts
42 1 1/2 10 3 1/3
No. 16 Entrees, mufi ns, desserts 57 2 12 4 1/4
No. 12 Entrees, salads, croquettes, vegetables 76 2 2/3 14 4 2/3 1/3 No. 10 Meat patties, cereals, croquettes,
vegetables
92 3 1/4 19 1/2 6 1/2 3/8
No. 8 Meat patties and casserole dishes 114 4 24 8 1/2
No. 6 Main dish salads 170 6 36 12 3/4
Figure A-26 (continued on next page)
Item Size Use Gram Oz. Tsp. Tbsp. Cup
Ladles 1FZ Sauces, relishes 228.35 1 6 2 1/8
2FZ Gravy, sauces 57 2 12 4 1/4
4 FZ Creamed dishes and vegetables 114 4 24 8 1/2
6 FZ Stews, baked dishes, chili, creamed dishes, vegetables, soups, chili, stews
170 6 36 12 3/4
8 WZ Soups, chili, stews 227 8 48 16 1
12 WZ Large soups, goulash 340 12 72 24 1 1/2
24 WZ Kitchen dipper 681 24 144 48 3
32 WZ Quart dipper 907 32 192 64 4
Demiliter 496 17 1/2 105 35 2 1/16
Liter 1000 35.28 210 70 4 1/8
2 Quart 1990 64 384 128 8
Figure A-26
Critical Temperatures for Quality Control
Degrees
Fahrenheit Produces
212º Water boils at sea level. Most resistant bacteria killed within 2 minutes.
195º Water above this point sprayed from dish washing machine rinse nozzles vaporizes so readily that rinse action is reduced.
180º Water at this temperature in rinse line of the dishwasher will give 170 F°—killing temperature—at utensil.
170º Practically all common disease-producing bacteria killed at this temperature.
160º Some foods start to cook on utensils here.
140º Bacterial growth practically stopped. May die.
98.6º Body temperature. Bacteria`s most rapid growth.
70º Room temperature. Bacteria grow fast.
50º Bacterial growth slowed greatly; almost stopped below this point.
45º– 40º Store fruits and vegetables.
37º– 33º Store dairy products.
36º–33º Store meat and poultry.
32º Freezing point of water. Practically no bacterial growth.
30º–23º Store i sh and shelli sh.
10º–6º Store ice cream.
0º–10º Store frozen foods.
Food Portioning Aids ( concluded )
Canned Goods Information
Canned Goods Overview
Some excellent reasons for using canned fruits and vegetables include the following:
less expensive than fresh produce easy storage—no refrigeration required wide variety available all year
no waste—everything in the can is edible little or no preparation required
quantities needed easily calculated portion cost easily calculated immediately available in emergency
Are Canned Goods Less Nutritious Than Fresh?
The attention given to “freshness” by some gourmets and food writers have made many of us feel that we are doing something wrong when we use canned or frozen foods. Fresh local products certainly taste better and are nutritionally superior to preserved foods. But when the so-called “fresh” foods have actually been plucked before they are ripe, trucked thousands of miles to market, and perhaps stored for a time before you buy them, the advantage of “fresh- ness” is extremely low. The fact is that canning and freezing, when done properly, preserve most of the vitamins, minerals, and l avor of the original. In addition, canning and freezing make it possible for you to have year-round variety in your daily diet, with plenty of fruits and vegetables, even in midwinter, at less cost than fresh ones l own in out of season from faraway places. We would face far greater troubles in feeding this nation and the world if it were not for modern methods of preserving foods.
Grades
The most important factor in considering canned goods is the grade, or quality. The different qualities of a product are the top qualities, the next-to-the-top qualities, and the lower quali- ties. The grade names used for expressing these qualities are the letters A, B, and C. The cor- responding canning industry grade names are Fancy, Choice, Extra Standard, and Standard.
For some products, only two grades, A and B, have been developed. Peas and carrots are an example. Some products, such as asparagus and apples, do not have a B grade. Mostly, the grades run from A through C.
Grade A or Fancy: Excellent high-quality foods. Practically uniform in size, color, and texture.
Practically free from defects. Grade A products are carefully selected as to size, color, texture, uniformity, and other qualities.
Grade B or Choice ( for fruits) and Extra Standard ( for vegetables): High-quality foods.
Reasonably uniform in size, color, and texture. Reasonably free from defects. Vegetables are more mature, fruits less uniform.
Packing Media
Densities of syrups differ according to the fruit being canned. Some fruits, such as berries, can carry a very heavy syrup, while others, such as pears, would break down in a very heavy
•
•
•
•
•
•
•
•
syrup. The density is measured by Brix instruments known as the Brix Hydrometer and/or refracto meter, and is expressed in terms of degrees. For example: the cut-out density of syrup in choice peaches is expressed as “brix cut-out” 18 degrees or more but less than 22 degrees;
1 degree brix equals approximately 1 percent sugar by weight. The difference between in-going and cut out densities is due to the natural blending or equalization of the juice of the fruit and the syrup and also to the absorption of the sugar by the fruit after canning. An in-going syrup of 50 degrees will cut out 22 degrees or more. Such tests are always made 15 days or more after the product is canned. The following packing media are used:
Brine solution is added to most vegetables. Brine solution may be water and small amounts
of salt; or the solution may be water and small amounts of sugar and salt and be used for l avoring such products as peas and corn.
Natural juices from the product are sometimes added. Pineapple and tomatoes are
examples of foods to which natural juices from the product are added. Other natural fruit juices are added to special packs of fruit. These have lower sugar and sweetness than light syrup, but slightly more than water pack, and have far better palatability and are still acceptable for most sugar-controlled diets. “Solid pack” (SP) products have no liquid added, such as, preheated SP pie, peaches, or apricots. (These are regulated by federal law.)
Plain water
is used for “salt-controlled” dietetic packs of vegetables, for “reduced” or
“low caloric” dietetic fruits, and for pie pack fruits.
Syrups are used almost entirely for fruits and/or sweet potatoes. Usually, the syrup density varies according to the grade; that is, the syrup with the greatest amount of sugar is used for the best grades and sugar content decreases with the grade. However, higher costs and a trend toward less sugar in the diet is leading to an ever-increasing amount of choice in light syrup or choice in juice fruits. Typically, the following applies:
Extra Heavy Syrup Fancy Grade Fruit Heavy Syrup Choice Grade Fruit Light Syrup Standard Grade Fruit
Water Dietetic Fruits and Vegetables; Pie Fruit
What Is “Drained Weight”?
Simply speaking, drained weight is the net weight of a portion of fruit or vegetable after the syrup, juice, or water is drained off for two minutes through a colander-like sieve. It is impor- tant to know the drained weight of a product packed in a liquid medium. Recommended mini- mum drained weights are included in the federal standards and are published in other sections of this guide.
How to Determine Drained Weights
For a No. 10 can of fruit or vegetables, use a circular sieve with vertical sides, 12 inches in diameter, with 8 meshes to the inch. For a No. 2 1 ∕ 2 can (and smaller), use a sieve 8 inches in diameter, with 8 meshes to the inch. For tomatoes only use similar sieves, with 2 meshes to the inch. For all products, record the weight of the sieve. Set the sieve over the pan in an inclined position. Empty the contents of the can in the screen so as to distribute the contents evenly.
Promptly weigh the screen with the contents inside. Subtract the weight of the empty screen;
the difference is the drained weight of the product. If a screen of the foregoing type is not available, use a colander.
•
•
•
Containers
Containers normally are variously-sized cans that may be plain or enamel-lined on the inside.
Tin cans are made of steel that has been coated inside and out with tin. Enamel linings may be yellow or gray in color and are used for foods that can cause an unfavorable reaction with tin. There are many types of enamel linings. One type is used for red-colored foods, such as beets and berries, in which the color tends to bleed out when in contact with tin; another type is used for foods containing sulphur, such as corn. These foods could discolor the inside of a plain can, and sometimes the food itself is discolored. A third type of can has an enamel liner inside with a strip of tin (approximately 1/16 inch) along the inside seam. This is called an HTF can (high tin i llet). This type is now used in canning asparagus.
Can Equivalents
One #10 can equals approximately 7/#300 cans One #10 can equals approximately 6/#303 cans One #10 can equals approximately 5/#2 cans One #10 can equals approximately 4/#2 1/2 cans One #10 can equals approximately 2 1/4/#3 Cyl. cans
Sizes: Counts
Size refers to sieve size, or girth of an item. Range of count refers to number of pieces in a can.
The sizes of fruit are designated by the numerical count, according to the size of the can, for instance, 6/#10 Peaches, 30/35 count; or 6/#10 apricots, 86/108 count.
Sieve sizes and actual sizes are used to designate the sizes of vegetables: 5 Sv. peas; 4 Sv. beans;
medium slices carrots; tiny whole beets; mammoth asparagus; medium olives, and so forth. In fruits, usually the larger the size, the higher the grade. In vegetables, the reverse is usually true:
The larger the size, the lower the grade.
Fill of Container
Unless dei ned by Food and Drug regulations, the USDA grades recommend generally that cans be i lled as full as practicable without impairment of quality, and that the product and packing medium occupy not less than 90 percent of the capacity of the can. For all practical purposes, this is determined by measuring the head space inside the can. Head space is mea- sured from the top of the double seam down to the surface of the product in the can.
FDA regulations have dei ned the i ll of container for only a few canned fruits and vegetables.
Containers that fail to meet those requirements must be labeled “below standard in i ll.”
Maximum Gross Head-space Permitted to Avoid a Charge of Slack Filling
Can Size
Maximum Gross Headspace in Thirty-seconds of an Inch
No. 300 19
No. 303 19
No. 2 19
No. 2 1/2 20
No. 3 Cylinder 27
No. 10 27
Figure A-28
Common Can Sizes and Their Appropriate Contents
Can Size Principal Products
No. 5 squat 75 oz. Squat
No. 10 Institution size-fruits, vegetables, and some other foods
No. 3 Cyl Institution size-condensed soups, some vegetables; meat and poultry products; economy family-size fruit and vegetable juices
No. 2 1/2 Family size-fruits, some vegetables
No. 2 Family size-juices, ready-to-serve soups, and some fruits
No. 303 Small cans-fruits, vegetables, some meat and poultry products, and ready-to-serve soups No. 300 Small cans-some fruits and meat products
No. 2 (vacuum) Principally for vacuum pack corn
No. 1 (picnic) Small cans-condensed soups, some fruits, vegetables, meat, and i sh 8 oz. Small cans-ready-to-serve soups, fruits, and vegetables
6 oz.
Figure A-29
Common Can Sizes and Their Appropriate Weights and Volumes
*Volumes represent total water capacity of the can. Actual volume of the pack would depend upon the contents and the head space from the l uid level to the top of the can.
Can Size Volume (WZ) Average Fluid (FZ) Average Cups Cans per Case Approx. Weight
75 Squat 6 4 LB 11 WZ
No. 5 56 6 4 LB 2 WZ
No. 10 105.1 99 to 117 12 to 13 6 6 LB 9 WZ
No. 3 Cyl. 49.6 51 or 46 5 3/4 12 46 FL. WZ
No. 2 1/2 28.55 27 to 29 3 1/2 24 12 WZ
No. 2 19.7 20 or 18 2 1/2 24 1 LB 13 WZ
No. 303 16.2 16 or 17 2 24 or 36 1 LB
No. 300 14.6 14 or 16 1 3/4 24 15 1/2 WZ
No. 2 (vacuum) 12 1 1/2 24
No. 1 10 1/2 to 12 1 1/4 48
8 oz. 8.3 8 1 48 or 72 8 WZ
6 oz. 5.8 6 3/4 48 6 WZ
Can Equivalencies
Can Size Equivalent
1 #10 Can 2 1/4 #3 Cyl.
4 #2.5 Cans 5 #2 Cans 6 #303 Cans 7 #300 Cans Figure A-31
Spices/Seasoning Conversion
Measuring Equivalents
Teaspoons Tablespoons Fluid Ounces Cups Scoops Fluid Measure
3 1 1/2
6 2 1 1/8 30
12 4 2 1/4 16
15 5 2 1/2 1/3 12
6 2/3 3 1/2 to 4 2/5 10
8 4 1/2 8
10 5 2/3
12 6 3/4
14 7 7/8
16 8 1 1/2 pint
18 9 1 1/8
12 1 1/2 3/4 pint
16 2
24 3 1 1/2 pint
32 4 1 quart
64 8 2 quarts
128 16 1 gallon
Figure A-32
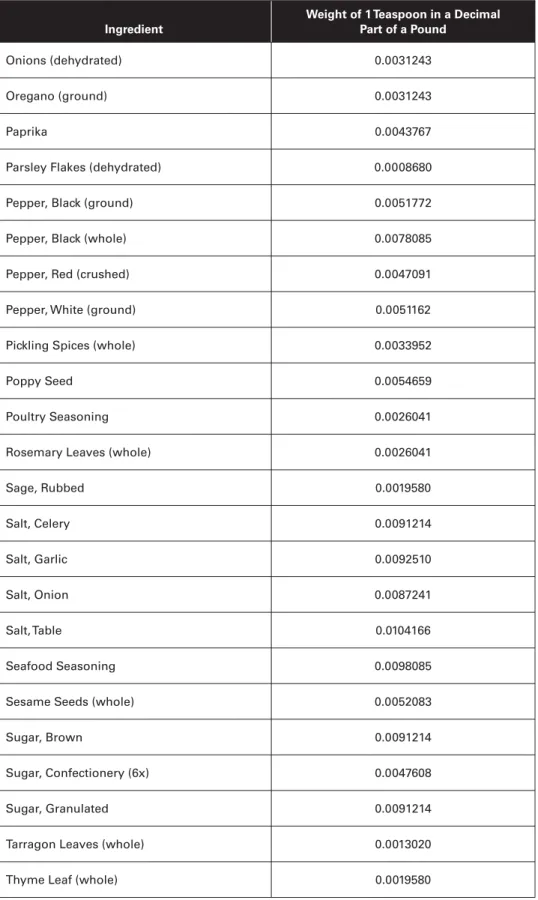
Spice/Seasoning Conversions for Recipe Writing Ingredient Weights
Ingredient
Weight of 1 Teaspoon in a Decimal Part of a Pound
Allspice (ground) 0.0039164
Baking powder 0.0078085
Baking soda 0.0078085
Basil leaves 0.0013020
Bay leaves (whole—approx. 1361 leaves/pound)
0.0013020
Caraway seeds 0.0053232
Cayenne pepper 0.0035215
Celery seeds (whole) 0.0052083
Chili powder 0.0054766
Cinnamon (ground) 0.0047608
Cloves (ground) 0.0033952
Cloves (whole) 0.0044363
Cream of tartar 0.0083060
Cumin (ground) 0.0035216
Curry powder 0.0044363
Dill seed 0.0054659
Garlic powder 0.0032491
Ginger (ground) 0.0035213
Mace (ground) 0.0039160
Marjoram (ground) 0.0026041
MSG 0.0078085
Mustard (dry) 0.0032491
Nutmeg (ground) 0.0113928
Ingredient
Weight of 1 Teaspoon in a Decimal Part of a Pound
Onions (dehydrated) 0.0031243
Oregano (ground) 0.0031243
Paprika 0.0043767
Parsley Flakes (dehydrated) 0.0008680
Pepper, Black (ground) 0.0051772
Pepper, Black (whole) 0.0078085
Pepper, Red (crushed) 0.0047091
Pepper, White (ground) 0.0051162
Pickling Spices (whole) 0.0033952
Poppy Seed 0.0054659
Poultry Seasoning 0.0026041
Rosemary Leaves (whole) 0.0026041
Sage, Rubbed 0.0019580
Salt, Celery 0.0091214
Salt, Garlic 0.0092510
Salt, Onion 0.0087241
Salt, Table 0.0104166
Seafood Seasoning 0.0098085
Sesame Seeds (whole) 0.0052083
Sugar, Brown 0.0091214
Sugar, Confectionery (6x) 0.0047608
Sugar, Granulated 0.0091214
Tarragon Leaves (whole) 0.0013020
Thyme Leaf (whole) 0.0019580
Figure A-33 (concluded)
Ingredient Weights ( concluded )
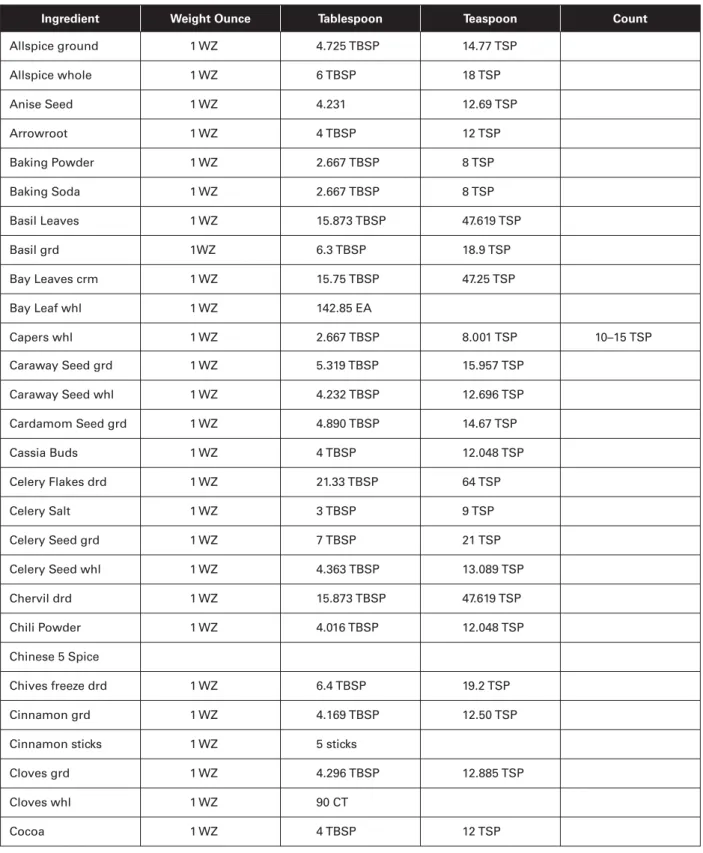
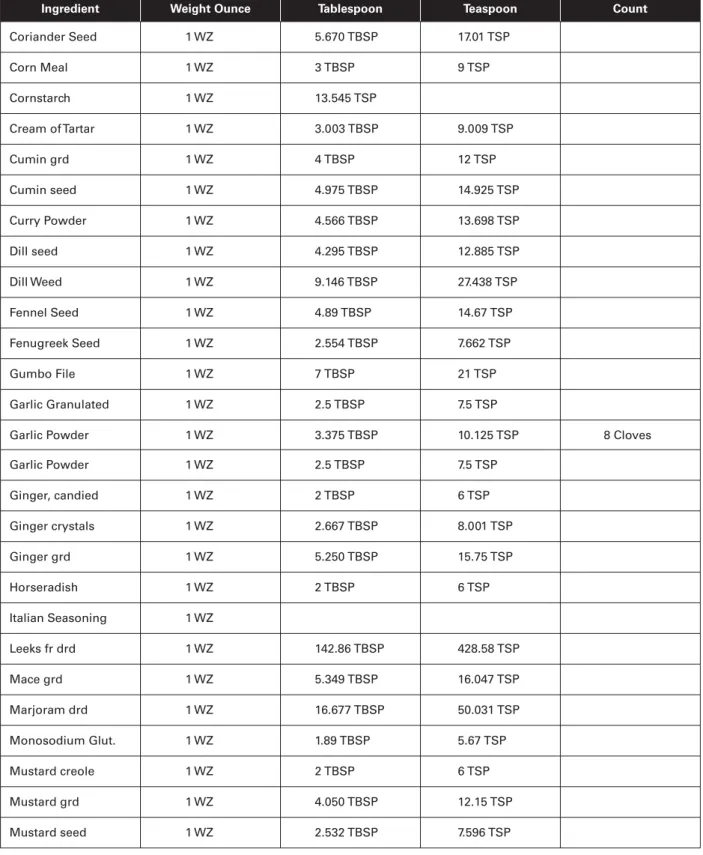
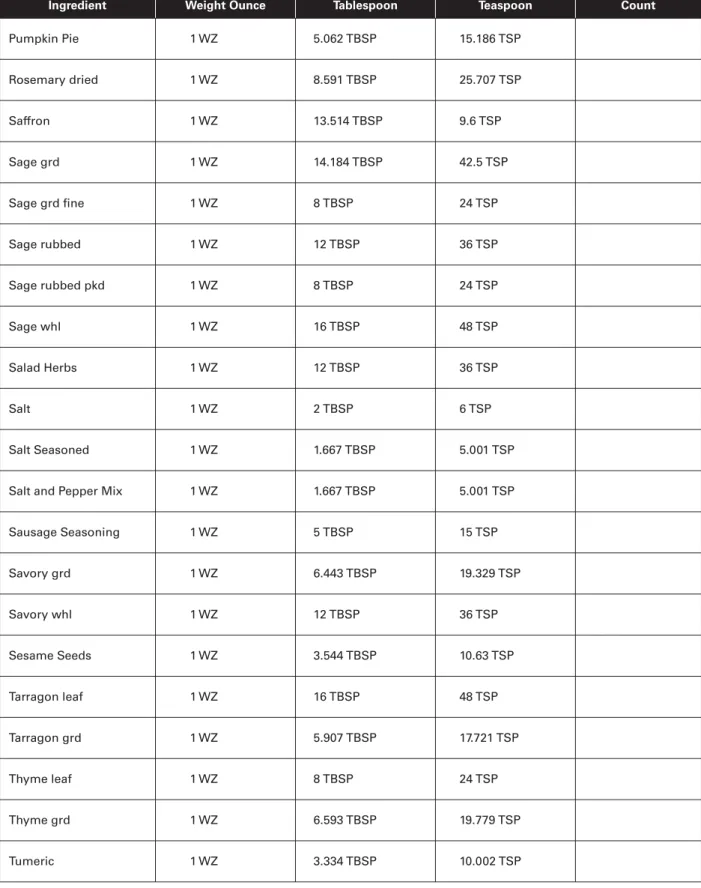
Spices and Their Conversions
Ingredient Weight Ounce Tablespoon Teaspoon Count
Allspice ground 1 WZ 4.725 TBSP 14.77 TSP
Allspice whole 1 WZ 6 TBSP 18 TSP
Anise Seed 1 WZ 4.231 12.69 TSP
Arrowroot 1 WZ 4 TBSP 12 TSP
Baking Powder 1 WZ 2.667 TBSP 8 TSP
Baking Soda 1 WZ 2.667 TBSP 8 TSP
Basil Leaves 1 WZ 15.873 TBSP 47.619 TSP
Basil grd 1WZ 6.3 TBSP 18.9 TSP
Bay Leaves crm 1 WZ 15.75 TBSP 47.25 TSP
Bay Leaf whl 1 WZ 142.85 EA
Capers whl 1 WZ 2.667 TBSP 8.001 TSP 10–15 TSP
Caraway Seed grd 1 WZ 5.319 TBSP 15.957 TSP
Caraway Seed whl 1 WZ 4.232 TBSP 12.696 TSP
Cardamom Seed grd 1 WZ 4.890 TBSP 14.67 TSP
Cassia Buds 1 WZ 4 TBSP 12.048 TSP
Celery Flakes drd 1 WZ 21.33 TBSP 64 TSP
Celery Salt 1 WZ 3 TBSP 9 TSP
Celery Seed grd 1 WZ 7 TBSP 21 TSP
Celery Seed whl 1 WZ 4.363 TBSP 13.089 TSP
Chervil drd 1 WZ 15.873 TBSP 47.619 TSP
Chili Powder 1 WZ 4.016 TBSP 12.048 TSP
Chinese 5 Spice
Chives freeze drd 1 WZ 6.4 TBSP 19.2 TSP
Cinnamon grd 1 WZ 4.169 TBSP 12.50 TSP
Cinnamon sticks 1 WZ 5 sticks
Cloves grd 1 WZ 4.296 TBSP 12.885 TSP
Cloves whl 1 WZ 90 CT
Cocoa 1 WZ 4 TBSP 12 TSP
Figure A-34 (continued)
Ingredient Weight Ounce Tablespoon Teaspoon Count
Coriander Seed 1 WZ 5.670 TBSP 17.01 TSP
Corn Meal 1 WZ 3 TBSP 9 TSP
Cornstarch 1 WZ 13.545 TSP
Cream of Tartar 1 WZ 3.003 TBSP 9.009 TSP
Cumin grd 1 WZ 4 TBSP 12 TSP
Cumin seed 1 WZ 4.975 TBSP 14.925 TSP
Curry Powder 1 WZ 4.566 TBSP 13.698 TSP
Dill seed 1 WZ 4.295 TBSP 12.885 TSP
Dill Weed 1 WZ 9.146 TBSP 27.438 TSP
Fennel Seed 1 WZ 4.89 TBSP 14.67 TSP
Fenugreek Seed 1 WZ 2.554 TBSP 7.662 TSP
Gumbo File 1 WZ 7 TBSP 21 TSP
Garlic Granulated 1 WZ 2.5 TBSP 7.5 TSP
Garlic Powder 1 WZ 3.375 TBSP 10.125 TSP 8 Cloves
Garlic Powder 1 WZ 2.5 TBSP 7.5 TSP
Ginger, candied 1 WZ 2 TBSP 6 TSP
Ginger crystals 1 WZ 2.667 TBSP 8.001 TSP
Ginger grd 1 WZ 5.250 TBSP 15.75 TSP
Horseradish 1 WZ 2 TBSP 6 TSP
Italian Seasoning 1 WZ
Leeks fr drd 1 WZ 142.86 TBSP 428.58 TSP
Mace grd 1 WZ 5.349 TBSP 16.047 TSP
Marjoram drd 1 WZ 16.677 TBSP 50.031 TSP
Monosodium Glut. 1 WZ 1.89 TBSP 5.67 TSP
Mustard creole 1 WZ 2 TBSP 6 TSP
Mustard grd 1 WZ 4.050 TBSP 12.15 TSP
Mustard seed 1 WZ 2.532 TBSP 7.596 TSP
Figure A-34 (continued on next page)
Spices and Their Conversions ( continued )
Spices and Their Conversions ( continued )
Ingredient Weight Ounce Tablespoon Teaspoon Count
Mustard prepared 1 WZ 2 TBSP 6 TSP
Nutmeg grd 1 WZ 4.050 TBSP 12.15 TSP
Onions Dehydrated 1 WZ 5.672 TBSP 17.016 TSP
Onion Salt 1 WZ 2 TBSP 6 TSP
Onion Powder 1 WZ 4.362 TBSP 13.086 TSP
Oregano grd 1 WZ 6.300 TBSP 18.9 TSP
Oregano whl 1 WZ 16 TBSP 48 TSP
Paprika 1 WZ 4.109 TBSP 12.327 TSP
Parsley Flakes drd 1 WZ 21.810 TBSP 65.43 TSP
Parsley Flakes fr drd 1 WZ 70.921 TBSP 212.763 TSP
Pepper black 1 WZ 4.430 TBSP 13.29 TSP
Pepper grd 1 WZ 3.20 TBSP 9.6 TSP
Pepper whl 1 WZ 5.349 TBSP 16.047 TSP
Pepper cayenne grd 1 WZ 4.83 TBSP 14.49 TSP
Pepper green 1 WZ 12 TBSP 36 TSP
Pepper green glks 1 WZ 60 Per Portion
Pepper lemon 1 WZ 6 TBSP 18 TSP
Pepper red cruched 1 WZ 4.667 TBSP 14 TSP
Pepper white 1 WZ 3.993 TBSP 11.979 TSP
Pepper white grd 1 WZ 3.20 TBSP 9.60 TSP
Peppercorns whl blk 1 WZ 6 TBSP 18 TSP 90
Peppercorns green 1 WZ
Poppy Seed 1 WZ 3.222 TBSP 9.666 TSP
Poultry Seasoning grd 1 WZ 7.662 TBSP 22.986 TSP
Poultry Seasoning whl 1 WZ 8 TBSP 24 TSP
Ingredient Weight Ounce Tablespoon Teaspoon Count
Pumpkin Pie 1 WZ 5.062 TBSP 15.186 TSP
Rosemary dried 1 WZ 8.591 TBSP 25.707 TSP
Saffron 1 WZ 13.514 TBSP 9.6 TSP
Sage grd 1 WZ 14.184 TBSP 42.5 TSP
Sage grd i ne 1 WZ 8 TBSP 24 TSP
Sage rubbed 1 WZ 12 TBSP 36 TSP
Sage rubbed pkd 1 WZ 8 TBSP 24 TSP
Sage whl 1 WZ 16 TBSP 48 TSP
Salad Herbs 1 WZ 12 TBSP 36 TSP
Salt 1 WZ 2 TBSP 6 TSP
Salt Seasoned 1 WZ 1.667 TBSP 5.001 TSP
Salt and Pepper Mix 1 WZ 1.667 TBSP 5.001 TSP
Sausage Seasoning 1 WZ 5 TBSP 15 TSP
Savory grd 1 WZ 6.443 TBSP 19.329 TSP
Savory whl 1 WZ 12 TBSP 36 TSP
Sesame Seeds 1 WZ 3.544 TBSP 10.63 TSP
Tarragon leaf 1 WZ 16 TBSP 48 TSP
Tarragon grd 1 WZ 5.907 TBSP 17.721 TSP
Thyme leaf 1 WZ 8 TBSP 24 TSP
Thyme grd 1 WZ 6.593 TBSP 19.779 TSP
Tumeric 1 WZ 3.334 TBSP 10.002 TSP
Figure A-34 (concluded)
Spices and Their Conversions ( concluded )
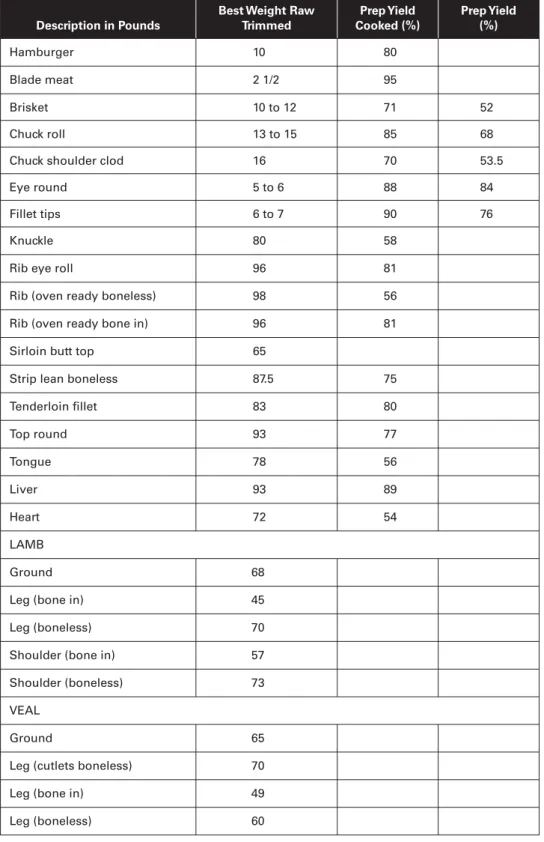
Meat/Seafood Prep Yields
Meat Prep Yields: Raw, Trimmed, and Cooked
Description in Pounds
Best Weight Raw Trimmed
Prep Yield Cooked (%)
Prep Yield (%) PORK
Ham boneless (skin removed) 7 98 71
Ham shank (half bone in) 10 to 14 60 57
Loin (bone in whole) 14 to 17 70 54
Loin (boneless whole) 8 95 74
Ham butt (half bone in) 5 to 8 63 42
Shoulder picnic (bone in) 12 77 39
Sausage 10 48
Spareribs 58 48
Liver 92 66
Heart 93 57
Tongue 65 50
CHICKEN
Chicken (whole) 78 51
Breast (skin on) 74 63
Breast (skinless) 65 46
Drumsticks 42
Tights 45
Heart 58
Liver 57
TURKEY
Turkey (whole) 84 61
Neck and Giblets 77 50
Breast (quarters) 75 48
Breast (whole) 87 55
Leg (quarters) 75 45
BEEF
Flank steak 2 to 2 1/2 94.5 75
Gooseneck bottom round 26 to 29 78 65
Description in Pounds
Best Weight Raw Trimmed
Prep Yield Cooked (%)
Prep Yield (%)
Hamburger 10 80
Blade meat 2 1/2 95
Brisket 10 to 12 71 52
Chuck roll 13 to 15 85 68
Chuck shoulder clod 16 70 53.5
Eye round 5 to 6 88 84
Fillet tips 6 to 7 90 76
Knuckle 80 58
Rib eye roll 96 81
Rib (oven ready boneless) 98 56
Rib (oven ready bone in) 96 81
Sirloin butt top 65
Strip lean boneless 87.5 75
Tenderloin i llet 83 80
Top round 93 77
Tongue 78 56
Liver 93 89
Heart 72 54
LAMB
Ground 68
Leg (bone in) 45
Leg (boneless) 70
Shoulder (bone in) 57
Shoulder (boneless) 73
VEAL
Ground 65
Leg (cutlets boneless) 70
Leg (bone in) 49
Leg (boneless) 60
Figure A-35 (concluded)
Meat Prep Yields: Raw, Trimmed, and Cooked ( concluded )
Seafood Prep Yields
Description Prep Yield (%) Description Prep Yield (%)
Bass 40 Lobster (New England-American) 25
Bluei sh 52 Lobster (spiny-tails only) 46
Cati sh 95.4 Mackerel 54
Corvina 94 Mahi 94
Calms (breaded fried) 85 Mahi (head on) 55 –60
Clams (hard) 14 Mahi (head off) 78.5
Clams (soft) 29 Monk 85
Clams (sucked) 48 N-T King 65–68
Cod 31 Ohi 92
Crab (blue) 10–18 Ono 95
Crabcakes (fried) 95 Opaka (whole) 92.5
Crab (dungeness) 22–26 Oysters 40
Crabmeat 97 Oysters (breaded raw) 88
Fish i llets (species variation) 64 Oysters (whole) 100
Flounder 40 Petrale 98
Gulf (i llet) 88 Perch 36
Gulf (whole) 46 Sole 72
Haddock 48 Pinobass 93.5
Halibut (i llet) 97 Pollock 45
Halibut (small 40–60 lbs) 50–60 Pompario 52
Halibut (large 80–120 lbs) 65 – 67 Redi llet 93.5
Halibut (whole) 59 Red (whole) 61
Ling Cod 96 Roughy 92.5
Lobster (cooked in shell) 25 Salmon 65–75
Salmon (i llet) 94–96 Spear 92.5
Salmon (large king whole) 61–64 Steel Head Salmon 52–60
Scallops (breaded fried) 90 Sword 94.2
Scallops (raw) 81 Trout 90
Scrod 94 White Sea Bass 96
Shark 96 Y-Tail (i llet) 95.2
Shark (skin on) 91 Y-Tail (whole) 62
Snapper 94
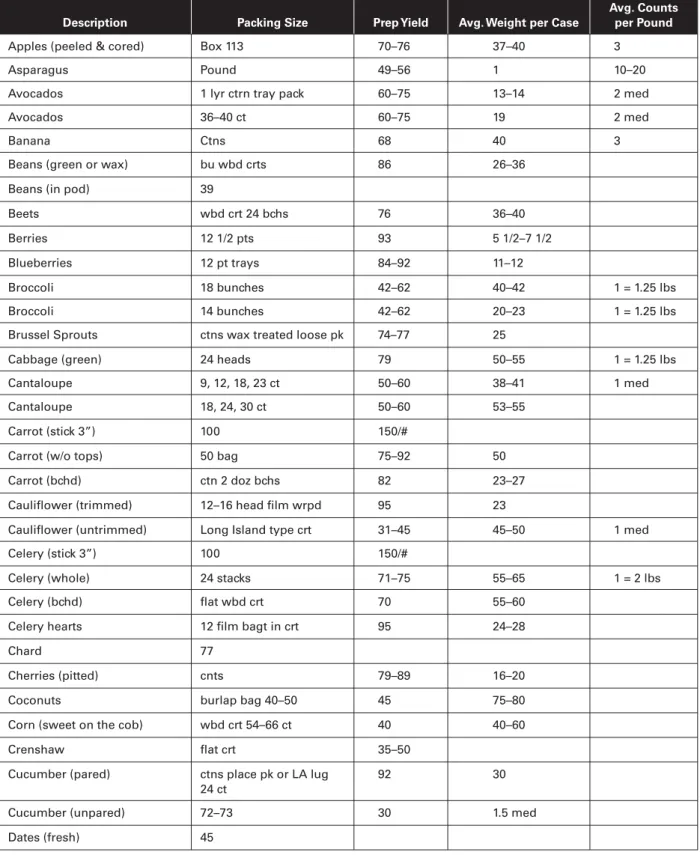
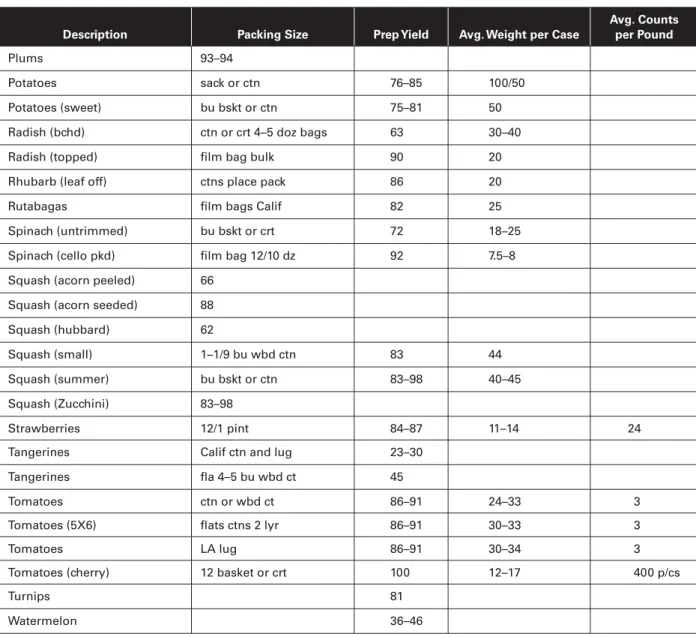
Produce Prep Yields
Description Packing Size Prep Yield Avg. Weight per Case
Avg. Counts per Pound
Apples (peeled & cored) Box 113 70–76 37–40 3
Asparagus Pound 49–56 1 10–20
Avocados 1 lyr ctrn tray pack 60–75 13–14 2 med
Avocados 36–40 ct 60–75 19 2 med
Banana Ctns 68 40 3
Beans (green or wax) bu wbd crts 86 26–36
Beans (in pod) 39
Beets wbd crt 24 bchs 76 36–40
Berries 12 1/2 pts 93 5 1/2–7 1/2
Blueberries 12 pt trays 84–92 11–12
Broccoli 18 bunches 42–62 40–42 1 = 1.25 lbs
Broccoli 14 bunches 42–62 20–23 1 = 1.25 lbs
Brussel Sprouts ctns wax treated loose pk 74–77 25
Cabbage (green) 24 heads 79 50–55 1 = 1.25 lbs
Cantaloupe 9, 12, 18, 23 ct 50–60 38–41 1 med
Cantaloupe 18, 24, 30 ct 50–60 53–55
Carrot (stick 3”) 100 150/#
Carrot (w/o tops) 50 bag 75–92 50
Carrot (bchd) ctn 2 doz bchs 82 23–27
Caulil ower (trimmed) 12–16 head i lm wrpd 95 23
Caulil ower (untrimmed) Long Island type crt 31–45 45–50 1 med
Celery (stick 3”) 100 150/#
Celery (whole) 24 stacks 71–75 55–65 1 = 2 lbs
Celery (bchd) l at wbd crt 70 55–60
Celery hearts 12 i lm bagt in crt 95 24–28
Chard 77
Cherries (pitted) cnts 79–89 16–20
Coconuts burlap bag 40–50 45 75–80
Corn (sweet on the cob) wbd crt 54–66 ct 40 40–60
Crenshaw l at crt 35–50
Cucumber (pared) ctns place pk or LA lug 24 ct
92 30
Cucumber (unpared) 72–73 30 1.5 med
Dates (fresh) 45
Figure A-37 (continued on next page)
Description Packing Size Prep Yield Avg. Weight per Case
Avg. Counts per Pound
Eggplant bu bskt or ctn 75 30–34
Endive ctns 8 wbd crt 24 pk 74–75 35–40 1 = 1.6 lbs
Garlic telescope ctns loose pk 81 30 15 pods
Grapefruit (sectioned) cs = 36 ct 47–48 34–36 1
Grapes (red seedless) lug or ctn 96 24–28 91
Grapes (white seedless) lug 16,22,24 wrpd bchs 96 22 85
Honeydew l at crt 12 ct 56–60 28–32 1 = 2.5 lbs
Kale 18–25 lb bchs p/ct 74–81 20.5
Leeks 12 bch p/ct 50 25–30 12–25 p/bch
Lemon (115 ct slices) 37–40 lb ctn 80 38 3–4
Lemon (115 ct wedges) 37–40 lb ctn 98 38 3–4
Lemon (juiced) 37–40 lb ctn 43
Lettuce (boston) eastern ctr 1 1/9 bu wbd 74 20–25
Lettuce (iceberg) cs = 24 heads 69–74 40–45 1
Lettuce (romaine) cs = 24 heads 74 23
Lime (wedges) cs = 200 ct 98 40–41
Lime (juice) box or ctn 43 40–41
Mushrooms (large whl) cs = 10 97 10 25
Nectarines slanger lug 22 lyr ctn 76 19–22
Okra ctn or LA lug loose pk 78–96 18
Onion (green) ctns 4 dy bchs 60 15–18 11/bch
Onion (mature) cs = 5 0 lbs 76–89 50 2 med
Orange (sectioned) 80, 88, 100, 113 56–57 45
Orange (juice) 50 45
Parsley ctn 5 doz 76 21–25 30/bu
Parsnip 1/2 bu or ctns 84–85 25
Peaches LA lug 2 layer 76 22–29
Pears LA lug 67–78 25
Peas (green in shell) bu bskt hmpr or wbd bu 27–38 28–30
Pepper (green) ctns from Calif 78–82 30
Peppers (chili) LA lug or ctn is pk 16–25
Peppers (sweet) ctn 80 28–34
Pineapple 1 lyr l t 4, 5, 6 48–52 18–20
Produce Prep Yields ( continued )
Description Packing Size Prep Yield Avg. Weight per Case
Avg. Counts per Pound
Plums 93–94
Potatoes sack or ctn 76–85 100/50
Potatoes (sweet) bu bskt or ctn 75–81 50
Radish (bchd) ctn or crt 4–5 doz bags 63 30–40
Radish (topped) i lm bag bulk 90 20
Rhubarb (leaf off) ctns place pack 86 20
Rutabagas i lm bags Calif 82 25
Spinach (untrimmed) bu bskt or crt 72 18–25
Spinach (cello pkd) i lm bag 12/10 dz 92 7.5–8
Squash (acorn peeled) 66 Squash (acorn seeded) 88
Squash (hubbard) 62
Squash (small) 1–1/9 bu wbd ctn 83 44
Squash (summer) bu bskt or ctn 83–98 40–45
Squash (Zucchini) 83–98
Strawberries 12/1 pint 84–87 11–14 24
Tangerines Calif ctn and lug 23–30
Tangerines l a 4–5 bu wbd ct 45
Tomatoes ctn or wbd ct 86–91 24–33 3
Tomatoes (5X6) l ats ctns 2 lyr 86–91 30–33 3
Tomatoes LA lug 86–91 30–34 3
Tomatoes (cherry) 12 basket or crt 100 12–17 400 p/cs
Turnips 81
Watermelon 36–46
Abbreviations
bchd 5 bunched oz 5 ounce
bskt 5 basket pk 5 pack
bu 5 bushel pkg 5 package
crt 5 crate pt 5 pint
ctn 5 carton sk 5 sack
contr 5 container std 5 standard
hmpr 5 hamper var 5 various
lb(s) 5 pound(s) wbd 5 wirebound
lyr 5 layer wrpd 5 wrapped
Figure A-37 (concluded)
Produce Prep Yields ( concluded )
COST CONTROL FUNCTIONS YES NO COMMENTS 1 CONTROL 1
MARKET BASKET SURVEY ANALYSIS.
1. Are market basket analyses on i le? For how many months?
2. Are copies of related invoices on i le? For how many months?
3. Is overall weighted average percentage increase in price computed? Over what period of time?
4. How many items have been surveyed each month?
5. How many of the total items are high-cost entree or specialty items? What percent of total?
6. Are the controller, food and beverage director, and chef on the distribution list?
2 CONTROL 2
WEEKLY AUDIT OF RECEIVING PROCEDURES.
1. Are audits of receiving dock procedures on i le? For how many months?
2. Are they performed:
a. Weekly?
b. Biweekly?
c. Monthly?
3. Is there evidence that discrepancies are reconciled?
4. Are the controller, food and beverage director, and chef on the distribution list?
3 CONTROL 3
MEAT TAG SYSTEM and WEEKLY AUDIT.
1. Is a meat tag system in place?
2. Are there duplicate or triplicate tags?
3. Are tags audited and reconciled?
a. Weekly?
b. Biweekly?
c. Monthly?
4. Is there evidence that discrepancies are reconciled?
5. Are the controller and chef on the distribution list?
Internal Audit Checklist: Minimum Cost Control
REVIEWED and APPROVED: DATE:
Figure A-38 (continued)
COST CONTROL FUNCTIONS YES NO COMMENTS 4 CONTROL 4
MENU ENTREE ITEMS INVENTORY CONTROL.
1. Are menu entrée items inventory control sheets being used?
2. Are results reconciled to sales tallies per a. POS?
b. Guest checks?
3. Is there evidence that discrepancies are reconciled?
4. Are the chef and food and beverage director on the distribution list?
5 CONTROL 5
BANQUET BEVERAGE CONTROL AUDITS
1. Are banquet beverage control sheets being completed?
a. All?
b. Using 80/20 methods?
2. Sample three for material accuracy of all calculations:
Function # of Errors:
Banquet # Date 1 or 2 5%
--- --- --- 3. Are they consolidated at month-end to compute banquet beverage cost percentages?
4. Is there evidence that on-site audits of large functions are being done? How often?
a. Three times weekly?
b. Weekly?
c. Biweekly?
d. Monthly?
5. Are the chef and food and beverage director on the distribution list?
6 CONTROL 6
BEVERAGE OUTLET AUDITS
1. Are beverage outlet audits being done?
2. For which outlets?
OUTLET Most Recent Date
a.
b.
c.
d.
e.
Figure A-38 (continued on next page)
Internal Audit Checklist: Minimum
Cost Control ( continued )
COST CONTROL FUNCTIONS YES NO COMMENTS 3. How often are they done?
a. Twice weekly?
b. Weekly?
c. Biweekly?
d. Monthly?
4. Is there evidence that discrepancies are being reconciled?
7 CONTROL 7a
FOOD POTENTIAL COSTS 1. Are butcher / yield tests on i le?
2. How many different tests?
3. Are they current? What are oldest and most recent dates?
4. Are written food recipes on i le?
Are they current ?/Date a.
b.
c.
d.
e.
5. Are food potential costs on i le?
For which outlets / meal periods?
Meal Period Date?
All?
a.
b.
c.
d.
e.
f.
6. Is there a master food item cost list? Has it been updated recently? When?
7. Are food recipes costed with current cost data from the master item list?
8. How recently? Sample three recipes for consistency.
Recipe’s Name Costed Correctly Updated a.
b.
c.
9. Do appropriate entree item recipes rel ect impact of butcher/yield test factors on their costs? Sample three:
Recipes Cost Cost per
name per recipe Yield Test
a.
b.
c.
Internal Audit Checklist: Minimum
Cost Control ( continued )
COST CONTROL FUNCTIONS YES NO COMMENTS 10. Have individual food menu item cost calculations been
consolidated to compute meal period and overall outlets food cost potential percentages?
11. Are overall potential food cost percentages within 1.5 points of actual?
Sample last three months:
Month Potential Actual
a:
b:
c:
d:
e:
CONTROL 7b.
BEVERAGE POTENTIAL COSTS
1. What liquor pour size is being used? 1 1/8 oz?
2. Are written beverage recipes on i le?
3. Do these recipes rel ect the liquor pour size actually used by all the outlets?
Yes No
a. _____ _____
b. _____ _____
c. _____ _____
4. Is there a master beverage items cost list?
5. Is it updated daily by purchasing department?
Inventory Item Cost
6. Have individual menu item beverage cost calculations been consolidated with the actual cost data for bottle wine sales to compute the overall outlet beverage cost potential percentages?
7. Is overall beverage cost potential percentages within 1.0 points of actual?
Sample last three months month potential actual a.
b.
c.
8. Are popularity analyses being done?
9. Are proi tability analyses being done?
10. Is proi t margin being calculated for each item before and after the cost of preparation labor
11. Is there a stafi ng guide in place?
Figure A-38 Internal Audit Checklist: Minimum Cost Control (concluded)
Internal Audit Checklist: Minimum
Cost Control ( concluded )
Self-Inspection Checklist
This is a sample self-inspection checklist. A potential customer, an income auditor, or any person with a vested interest may ask these questions. The cornerstone of any successful business is to anticipate problems and address them. Certainly you can design these questions differently to meet your company’s needs. Regular inspection with checklist in hand is the best way to ensure maintenance of your company quality standards. Remember, if there are dei ciencies in any of these areas, they may translate to negative responses on your Guest Survey. See Figure A-39 for an example.
Loading Dock
Loading Dock, General
Yes No Inspected Frequency
u u Is grease container and surrounding area free from spills and particles of food?
daily
Comments:
u u Is trash compactor free of food particles and litter outside dumpster? daily Comments:
u u Are dock walls clear of trash or garbage which is due to the dumpster being full? daily Comments:
u u Are lights in proper working order? daily
Comments:
u u Are wooden pallets stacked neatly? daily
Comments:
u u Is dock l oor swept, on both upper and lower levels? daily
Comments:
u u Are storage facilities for supplies and equipment clean, dry and free of trash, debris, wrappings, and cartons, which might provide nesting for rodents?
weekly
Comments:
Loading Dock, General (continued )
Yes No Inspected Frequency
u u Are supplies stored in a neat and orderly manner? as needed
Comments:
u u Are supplies stored off the l oor and away from walls to permit access for cleaning and to prevent harboring ofrodents and roaches?
daily
Comments:
u u Are containers of pesticides in a marked cabinet and apart from detergents and other chemicals?
daily
Comments:
Loading Dock, Safety
Yes No Inspected Frequency
u u Are emergency exits marked by illuminated signs? daily
Comments:
u u Is there a i rst-aid kit present or nearby, with an adequate supply of materials? weekly Comments:
u u Have employees been instructed to report all slips, cuts, burns, and falls to their supervisor immediately?
daily
Comments:
u u Is the edge of dock l oor clearly marked or painted in a bright, prominent color to prevent falls?
daily
Comments:
u u Are stairs leading down marked with non-slip tape to prevent falls? daily Comments:
Figure A-39 Self-Inspection Checklist (continued on next page )
Loading Dock, Safety (continued)
Yes No Inspected Frequency
u u Is the loading dock bell working and used for all receiving?
Comments:
u u Are loading-dock areas hazardous in other ways? Suggest safety improvements. as needed Comments:
General Comments:
Inspected By:
Date:
Food and Beverage Outlets
Employee Cafeteria, General
Yes No Inspected Frequency
u u Is there adequate stock of CO2 gas for soda machines? daily
Comments:
u u Are hot-line vent hood and walls clean and dust-free? weekly
Comments:
u u Are ceiling vents in dining area clean and dust-free? monthly
Comments:
Employee Cafeteria, General (continued )
Yes No Inspected Frequency
u u Are light i xtures, bulbs, tubes, etc., protected with screen guards? as needed Comments:
u u Are hot-line counter top and shelves clean and free of dust? daily
Comments:
u u Are hot-line l oor mats clean? daily
Comments:
u u Is microwave clean and in good working condition? daily
Comments:
u u Is soda machine in good working condition? daily/as
needed Comments:
u u Are there adequate supplies of sodas? daily
Comments:
u u Are cutting boards cleaned and sanitized between uses? as needed
Comments:
u u Are coolers and freezers equipped with accurate thermometers? weekly Comments:
u u Are refrigerators clean and free from mold and objectionable odors? daily Comments:
u u Are potentially hazardous foods maintained by refrigerators at temperatures of 45° F or lower?
daily
Comments:
Figure A-39 Self-Inspection Checklist (continued on next page )
Employee Cafeteria, General (continued )
Yes No Inspected Frequency
u u Are foods stored in a manner to permit First-in, First-out rotation? daily Comments:
u u Is salad bar properly used (plug in drain, ice and water in contact with bottom of pans) to maintain 38–40° F product temperature?
daily
Comments:
u u Is ice-machine vent hood free of dust and dirt? monthly
Comments:
u u Are tea and coffee machines sanitized on a regular basis? daily
Comments:
u u Are coffee-counter top and shelves clean and free of dust and debris? daily Comments:
u u Are food handlers wearing hats, caps or hairnets effective hair restraints? daily Comments:
u u Do any food servers have infected burns, cuts, or boils? daily
Comments:
u u Are food servers issuing proper food portions? daily
Comments:
u u Is tray-counter underside clean and free of grease? weekly
Comments:
Figure A-39 Self-Inspection Checklist (continued )
Employee Cafeteria, General (continued )
Yes No Inspected Frequency
u u Are silverware and serving utensils stored and presented in a manner which both prevents contamination and ensures their being picked up by the handles?
daily
Comments:
u u Are clean and sanitary cloths used for wiping dining-table tops and for no other purpose? Are cloths stored in sanitizing solution between uses?
daily
Comments:
u u Are facilities for supplies and equipment clean, dry and free of trash and debris? daily Comments:
u u Is trash container clean outside and inside with liner in place? Is it washed down regularly?
as needed
Comments:
u u Is dining-room hand sink supplied with soap, paper towels, hot and cold running water, and trash can?
daily
Comments:
u u Are drains clean and odor-free? bi-monthly
Comments:
u u Are all food products maintained at proper temperatures (such as soup, tuna salad, potato salad)?
daily
Comments:
u u Have all employees been instructed on minimum sanitation and food-protection requirements?
as needed
Comments:
Figure A-39 Self-Inspection Checklist (continued on next page )
Employees Cafeteria, Safety
Yes No Inspected Frequency
u u Are smoking and non-smoking signs posted in dining area? daily
Comments:
u u Are emergency-exit doors marked by illuminated signs? daily
Comments:
u u Is there a i re extinguisher present, properly mounted and in view? daily Comments:
u u Do employees know how to use i re extinguisher in case of emergency? as needed Comments:
u u Is there an evacuation map posted in case of emergency? daily
Comments:
u u Is all electrical food-preparation equipment in good repair and performing satisfactorily?
daily
Comments:
u u Do employees know how to use equipment that is required in their positions? as needed Comments:
u u Do employees unplug equipment before removing parts or before cleaning? daily Comments:
u u In case of choking or heart trouble, has the supervisor been instructed in CPR and i rst aid?
as needed
Comments:
Figure A-39 Self-Inspection Checklist (continued )
Employees Cafeteria, Safety (continued )
Yes No Inspected Frequency
u u Is the cafeteria otherwise potentially hazardous? Suggest improvements. daily Comments:
General Comments:
Inspected By:
Date:
Dish Washing Area
Yes No Inspected Frequency
u u Are dishes and utensils being pre-scraped and l ushed prior to washing? daily Comments:
u u Is rinse temperature of at least 170–180° F being maintained for tableware and utensils?
daily
Comments:
u u Are l oor and walls free of spills and particles of food? daily
Comments:
u u Are soaps and detergents stored away from clean china, glass and utensils? as needed Comments:
u u Is spray hose free of leaks to prevent back-l ow? daily
Comments:
Figure A-39 Self-Inspection Checklist (continued on next page )
Dish Washing Area (continued )
Yes No Inspected Frequency
u u Is garbage disposal in satisfactory working order? daily
Comments:
u u Are undersides of drain board clean and free of food particles? weekly Comments:
u u Is trash can odor-free, provided with a liner, and clean? You may wish to use a clear liner to see what has been wasted.
daily
Comments:
u u Are ceiling tiles and vents free of food and dust particles? quarterly Comments:
u u Are ceiling lights in proper working condition? as needed
Comments:
u u Is there sufi cient supply of soap, towels, garbage bins and hot and cold running water for hand sink?
as needed
Comments:
u u Are there bins provided for dirty and clean rags? daily
Comments:
u u Is silver-burnishing machine in proper working condition? daily
Comments:
Figure A-39 Self-Inspection Checklist (continued )
Dish Washing Area (continued )
Yes No Inspected Frequency
u u Is silver-sink electric water heater in proper working condition? daily Comments:
u u Is silver room clean and organized and equipment off l oor? daily
Comments:
u u Is storage-room mop sink clean, odor-free and organized? daily/as
needed Comments:
u u Is counter, top and bottom, clear of food and spills? daily
Comments:
u u Are jets and nozzles cleaned of food particles and de-limed? daily/
monthly Comments:
u u Are pots stored upside down and utensil handles stored facing one direction? daily Comments:
u u Are glass racks stored at least 6 inches off l oor? daily
Comments:
u u Is hand sink supplied with soap, paper towels, hot and cold running water, and trash can?
daily/as needed Comments:
u u Is reach-in cooler clean and neat? weekly/as
needed Comments:
Figure A-39 Self-Inspection Checklist (continued on next page)
Dish Washing Area (continued )
Yes No Inspected Frequency
u u Are espresso, coffee and tea machines operational and clean? daily
Comments:
General Comments:
Inspected By:
Date:
Outlets, General
Yes No Inspected Frequency
u u Is top of ice machine free of objects and door rim free of mold, and is there an ice scoop present?
daily/
as needed Comments:
u u Is l oor underneath ice machine clean? Are vent hood above and side and back walls next to machine also clean?
daily
Comments:
u u Are all trash cans clean inside and out with clear plastic liners? daily Comments:
Figure A-39 Self-Inspection Checklist (continued )
Walk-in Coolers
Yes No Inspected Frequency
u u Is temperature in cooler at or below 45° F (check outside thermometer and compare with thermometer inside)?
daily
Comments:
u u Is all food being stored off the l oor of walk-in cooler? daily
Comments:
u u Is cooler clean and free from mold and objectionable odors? daily
Comments:
u u Is proper cleaning and maintenance of walls and l oors being conducted? daily/as needed Comments:
u u Are foods stored in a manner to permit “First-in, First-out” rotation? daily Comments:
u u Are any spoiled foods present? Is the “spoilage sheet” being used for documentation?
daily
Comments:
u u Are raw foods stored separately from cooked foods? daily
Comments:
u u Are dairy products stored separately from strong-odor foods? daily
Comments:
u u Are cooked foods or other products removed from original containers, stored in clean, sanitized, covered containers and identii ed?
daily
Comments:
Figure A-39 Self-Inspection Checklist (continued on next page )
Walk-in Coolers (continued )
Yes No Inspected Frequency
u u Is there sufi cient space in the cooler to permit good air circulation around the stored food?
daily
Comments:
General Comments:
Inspected By:
Date:
Bar Area
Yes No Inspected Frequency
u u Are liquor dispensers free of leaks and dust? daily
Comments:
u u Are l oor lights and ceiling tile OK? daily
Comments:
u u Is storage of liquor bottles proper? Are automatic pours free of dust? daily Comments:
u u Are cooler and freezer free of broken glass and spills? daily
Comments:
Figure A-39 Self-Inspection Checklist (continued )
Bar Area (continued )
Yes No Inspected Frequency
u u Are all glasses stored on bar mats, rim down? Are insides of nozzles free of mold? daily Comments:
u u Is underneath the counter free of spills and debris? daily
Comments:
u u Are drains clean and sanitized? daily
Comments:
u u Are l oor and mats clean? daily
Comments:
u u Is bar area free of boxes and other litter? daily
Comments:
General Comments:
Inspected By:
Date:
Figure A-39 Self-Inspection Checklist (continued on next page )
All Restaurants, Safety
Yes No Inspected Frequency
u u Are smoking and non-smoking sections provided in dining area? daily Comments:
u u Is there a sign posted restricting smoking in the back –of the house? daily Comments:
u u Are there extinguishers present, properly mounted, and in view? daily Comments:
u u Is the manager provided with a high-power l ashlight in case of blackout? daily Comments:
u u Are routes to exits, and the exits themselves, clearly marked? daily Comments:
u u Is there a well-stocked i rst-aid kit nearby? daily
Comments:
u u Are employees instructed to report all slips, cuts, burns and falls immediately? daily Comments:
u u Are employees trained in safe use of cleaning compounds? daily
Comments:
u u Are hand trucks, carts, and dollies used for receiving food and supplies in good repair?
daily
Comments: