By learning some of the basic concepts of toxicology, you will be better prepared to make informed decisions about topics like these. In this scientific text, you will find an icon near several of the concepts you are studying.
U NDERSTANDING T OXIC R ISK
THE DOSE MAKES THE POISON
LD50 experiments measure lethal dose—the amount of chemical that will kill 50% of the test organisms. This makes sense when you think about toxins - the more toxic a chemical is, the less it takes to kill you.
FROM DATA TO STANDARDS
Establishing drinking water standards is a complex process that involves a combination of scientific data and human judgment. But how can animal bioassay data be used to determine the acceptable concentration of any particular chemical in human drinking water.
WHAT’S THE RISK?
However, an important question is “How clean is clean enough?” There are many factors involved in planning an environmental remediation operation. Describe why the process of setting drinking water standards can be regarded as a form of chemical risk management.
ECOLOGICAL RISKS
Because of the harm to wildlife and the potential danger to human health, the EPA banned the use of DDT in the United States in 1972 except in public health emergencies. Because DDT breaks down extremely slowly, it remains in the environment for many years and continues to make its way into the food of birds and other organisms (Figure 1.3). When plankton store DDT in their bodies, they concentrate it at higher levels than in the surrounding water.
It is still possible to measure high concentrations of these compounds in the soil of old orchards and farmlands. The unexpected contamination occurred because Long Island's light, sandy soils allowed aldicarb to leach downward into groundwater rather than remaining in the topsoil and gradually breaking down. During the 1960s and 1970s, toxaphene was widely used to control insect pests on cotton and other crops in the southern United States and other countries.
A law passed by Congress in 1976 authorizes the EPA to track 75,000 industrial chemicals currently in use in the United States.
USING BIOASSAYS FOR ENVIRONMENTAL RESEARCH
The choice of which organisms to use depends on the purpose of the bioassays. You may also be interested in investigating the toxicity of the herbicide to non-target species such as fish and wildlife living in lakes and ponds. In these aquatic dose/response experiments, the end result is the LC50, the concentration lethal to 50% of the exposed organisms.
In a dose-response experiment, the independent variable is the concentration of the test chemical. The organisms in the control group are all exposed to the same conditions as those in the treatment groups, except that they are grown in water without the added test chemical. The TC50 is the concentration that causes a 50% reduction in the growth or health of the test organisms.
Each beaker of Daphnia is one duplicate for that specific concentration of the test solution.
Serial Dilutions
This may seem impossibly small and impossible to measure, but in fact biological organisms are sensitive to many different chemicals in concentrations down to ppm. For example, the drinking water standard for lead is 15 ppb, which means that public water suppliers must take action if higher concentrations than this are measured in their drinking water supply. It can be whatever concentration you choose - just remember to write down which chemical you are using and which concentration (in mg/L) you have chosen to be the 100% concentration (see step 1).
Label the six beakers with your name, the date, and the percentage concentrations in Table 2.1, and add the name or chemical formula of your test chemical. Instead, be sure to use a dropper bulb or a dropper in the form of a syringe to avoid accidentally getting a mouthful of your chemical solution. After thoroughly rinsing the 10 mL pipette, transfer 10 mL of your 10% solution to the beaker labeled "1%," then add 90 mL of water and stir to mix.
Note: Distilled water can be used if the serial dilution solutions will be used with leaf seed bioassays.
Dose/Response Experiments Using Lettuce Seeds
At the end of the five-day growing period, count and record how many seeds have germinated in each dish. For example, in the image below, you would only measure the part between the two arrows, not the rest of the sprue on the left. The purpose of the control is to identify how well the seeds will grow without any additional chemicals.
If fewer than 80% of the seeds in your control dishes germinated, something may have gone wrong in your experiment. Using Figures 2.2a and 2.2b, you can estimate which concentrations produce germination and growth rates about half that of the control group. The TC50 for lettuce seed germination must be higher than all the concentrations I tested because more than half of the seeds germinated in all my test solutions.
After you estimate the TC50 for your experiment, you will be able to use this number to make a statement about the toxicity of the substance you tested.

Dose/Response Experiments Using Duckweed
At the end of the five-day growing period, count the number of leaves in each cup. The purpose of the check is to determine how well the duckweed will grow under uncontaminated conditions. Did replica cups have a similar number of duckweed leaves at the end of the five-day growing period?
In bioassays, there are two ways to report results: LC50, the lethal concentration that kills 50% of test organisms, and TC50, the toxic concentration that causes organisms to grow 50%, as well as a control group. So in this case use the TC50 to represent the concentration at which the duckweed in the treatment grows about half as much as that in the control group. If none of your concentrations produce rates close to half that of the control, it makes sense to report the TC50 as a range rather than a single number.
Once you have estimated the TC50 for your experiment, you will be able to use this number to make an opinion about the toxicity of the substance you tested.
Dose/Response Experiments Using Daphnia
But if 20% or more of the Daphnia in your control group have died, you should take a look at the test conditions. If less than 20% of the control group died (<3 of the 15 individuals you started with), then you can continue to analyze the data for your treatments. Bioassays are designed to estimate the concentration of a test material that affects 50% of the test organisms.
The concentration that kills half of the test animals over a given period of time is called the LC50 (this stands for the lethal concentration for 50% of the test population). From your graph in Figure 2.4, make an estimate of the LC50 for the chemical you tested. Once you have estimated the LC50 for your experiment, you will be able to use this number to make a statement about the toxicity of the substance you were testing.
Consider whether any of the Daphnia may have died for reasons other than poisoning by the chemical you tested.
Testing Environmental Samples Using Bioassays
See the Comparison with Controls section of Protocols 2–4 for guidelines on how the control organisms are expected to respond.). Then you can estimate LC50 or TC50 just as you would in dose/. For further information, refer to the analysis section in protocol 2–4.). You can use your LC50 or TC50 values to compare the toxicity of samples from different sources or sampling dates.
If very few organisms died in your environmental samples, you can conclude that the sources you tested have very low toxicity to the test species. If many of the test organisms died in your environmental samples, but not in the control group, then you can conclude that there is something in the samples that is toxic to the test species. Regardless of how your experiment turns out, you can use your results to decide what to try next.
Even if you get results that are completely different from what you expected, you can use this data to make recommendations for further research.
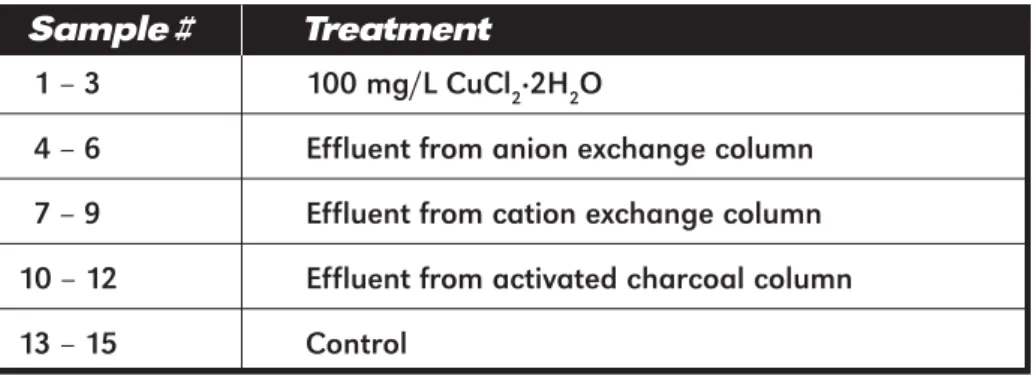
Preparing Water Treatment Columns
Under a microscope, activated carbon particles look like tiny mushrooms with many holes and pores that can trap and hold certain types of chemicals, including non-charged molecules. Gas masks work on a similar principle, using activated charcoal to remove toxic fumes from the air. Loosely pack the glass wool onto the tip of the column using a wooden stick or any blunt object.
Then disconnect the flexible tubing and drain the water until it reaches the 1 ml mark in the column. Allow the resin to settle until it fills to approximately the 3 ml mark in the column, then close the clamp to keep the resin in the column covered with water. If your column doesn't drain, simply detach the tip, turn the column upside down over a beaker and squirt out some charcoal with distilled water.
Fill the column with distilled water, allow the charcoal to settle, and adjust the flow rate to about 1 drop every 10 seconds.
Chemical Classification of Toxicants
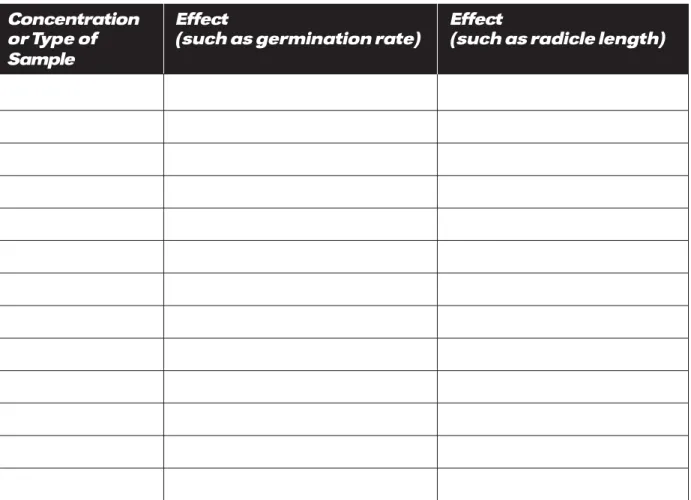
Which (if any) of the three treatment columns removed the substance that is toxic to your bioassay organisms. What is the root length of the seeds grown in the effluent from this column compared to the control group? None of the lettuce seeds germinated at your 100% concentration, but all of those at the 10% concentration germinated and grew as well as the control group.
In this case, you may want to try even lower dilutions of the same chemical to see if you can find a concentration that allows the bioassay organisms to survive and grow. You could do a serial dilution of the effluent to determine at what dilution it becomes non-toxic to your bioassay organisms. For example, say you ran a bioassay using runoff from your school parking lot, and all Daphnias died except those in the control group.
But what if your bioassay organisms survive or grow better in some of the treatments than in the control. For each of the three questions you chose, think about how you might design an experiment. This is the factor you will measure to determine the results of the experiment—it is called "dependent" because the results depend on changes in the independent variable from one treatment to the next.).
B EYOND P ROTOCOLS