As a library, NLM provides access to scientific literature. Inclusion in an NLM database does not imply endorsement of, or agreement with, the contents by NLM or the National Institutes of Health.
Learn more: PMC Disclaimer | PMC Copyright Notice
BMJ Open Diabetes Res Care. 2020; 8(1): e001235.
Published online 2020 Jul 14. doi: 10.1136/bmjdrc-2020-001235
PMCID: PMC7365428 PMID: 32665312
Association between C reactive protein and microvascular and macrovascular dysfunction in sub-Saharan Africans with and without diabetes: the RODAM study
Charles Frederick Hayfron-Benjamin, Anke H Maitland-van der Zee, Bert-Jan van den Born, Albert G B Amoah, Karlijn A C Meeks, Kerstin Klipstein-Grobusch, Matthias B Schulze, Joachim Spranger, Ina Danquah, Liam Smeeth, Erik J A J Beune, Frank Mockenhaupt, and Charles O Agyemang
Abstract
Introduction
Although inflammation assessed by elevated C reactive protein (CRP) concentration is known to be associated with risk of cardiovascular disease, its association with microvascu‐
lar and macrovascular dysfunction in diabetes and non-diabetes remains unclear. We exam‐
ined the association between CRP and diabetes and associated microvascular and macrovascular dysfunction in sub-Saharan Africans with and without diabetes.
Research design and methods
1,2,3 4 5
6 7,8 9,10 11
12,13 11,14 15 7 16
7
Cross-sectional analyses of baseline data from the multicenter RODAM study (Research on Obesity and Diabetes among African Migrants) including 5248 Ghanaians (583 with dia‐
betes, 4665 without diabetes) aged 25–70 years were done. Logistic regression analyses were used to examine the associations between CRP Z-scores and diabetes and microvascu‐
lar (nephropathy) and macrovascular (peripheral artery disease (PAD)) dysfunction, with adjustments for age, sex, site of residence, smoking, body mass index, systolic blood pres‐
sure, and low-density lipoprotein cholesterol.
Results
In the fully adjusted models, higher CRP concentration was significantly associated with diabetes (adjusted OR 1.13; 95% CI 1.05 to 1.21, p=0.002). In participants with diabetes, higher CRP concentration was associated with PAD (1.19; 1.03 to 1.41, p=0.046) but not nephropathy (1.13; 0.97 to 1.31, p=0.120). Among participants without diabetes, higher CRP concentration was associated with higher odds of PAD (1.10; 1.01 to 1.21, p=0.029) and nephropathy (1.12; 1.04 to 1.22, p=0.004).
Conclusions
In this study, higher CRP concentration was associated with higher odds of diabetes in sub- Saharan Africans. Also, higher CRP concentration was associated with higher odds of nephropathy and PAD in non-diabetes and higher odds of PAD in diabetes. CRP may be an important marker for assessment of risk of diabetes and risk for PAD and nephropathy in sub-Saharan Africans with and without diabetes.
Keywords: C-reactive protein, inflammation, microvascular and macrovascular complications, adult diabetes
Significance of this study
What is already known about this subject?
In European and Asian populations, inflammation measured by elevated C reactive protein (CRP) is known to be associated with diabetes.
Inflammation is a known factor in the development of atherosclerosis and subsequent atherosclerotic vascular events.
What are the new findings?
In sub-Saharan Africans, higher CRP concentration is associated with higher odds of diabetes, even after adjustments for the conventional cardiovascular risk factors.
Higher CRP concentration is significantly associated with higher odds of peripheral artery disease (PAD) and nephropathy in non-diabetes and higher odds of PAD in diabetes.
The conventional cardiometabolic risk factors did not explain the associations between CRP and PAD and nephropathy in diabetes and non-diabetes.
How might these results change the focus of research or clinical practice?
Our findings suggest that CRP could be explored as a potential marker to identify sub-Saharan Africans at risk of diabetes, PAD and nephropathy.
Introduction
Globally, microvascular and macrovascular diseases are important public health
problems. In many regions of the world including sub-Saharan Africa, the rates of mi‐
crovascular and macrovascular diseases are rising, contributing to the increasing rates of disability and death from cardiovascular disease (CVD). Specifically, macrovascular dis‐
eases including peripheral artery disease (PAD), coronary artery disease, and cerebrovascu‐
lar disease may complicate critical limb ischemia, myocardial infarction, and stroke, respec‐
tively. Also, microvascular diseases such as retinopathy, nephropathy, and neuropathy may result in blindness, end-stage kidney disease, and lower limb amputation, respectively.
C reactive protein (CRP), the most extensively studied biomarker of inflammation, is known to be significantly associated with CVD including diabetes in European and Asian populations; however, data on its role in CVD in sub-Saharan African populations are limit‐
ed. Considering the substantial ethnic differences in the association between inflamma‐
tion and diabetes, it may be valuable to investigate this association in sub-Saharan African populations, in the quest to integrate CRP to global risk scores for diabetes.
Existing data on the association between inflammation and vascular dysfunction have fo‐
cused on individuals with diabetes. In diabetes, endothelial injury from inflammation mediated by chronic hyperglycemia is known to play a key role in the development of vas‐
cular complications. However, the effect of glycemic control on macrovascular compli‐
1–4
5 6
7
8
9 10
11
12–14 4 15
cation risk or progression in diabetes remains uncertain. Also, existing data suggest important associations between inflammation and CVD in non-diabetes. Given the above, it is plausible that inflammation triggered by causes other than hyperglycemia may be im‐
portant in the pathogenesis of microvascular and macrovascular dysfunction; however, the biological basis for this association has not been clarified. We, therefore, assessed the as‐
sociations between CRP and diabetes in Ghanaians. In addition, we assessed associations between CRP and microvascular (nephropathy) and macrovascular dysfunction (PAD) in Ghanaians with and without diabetes.
Materials and methods
Study design
The rationale, conceptual framework, design and methodology of the RODAM study (Re‐
search on Obesity and Diabetes among African Migrants) have been described in detail elsewhere. In brief, the study was conducted from 2012 to 2015 and comprised Ghana‐
ians aged 25–70 years living in rural and urban Ghana as well as in three European cities, namely Amsterdam, Berlin and London. Data collection for the study was standardized across all sites. Informed written consent was also obtained from each participant prior to enrollment in the study. For the current analyses, only participants with complete data on CRP, microvascular disease (nephropathy) and macrovascular disease (PAD) were includ‐
ed. This comprised data from 583 participants with diabetes and 4665 participants without diabetes aged 25–70 years (figure 1).
13 16
17
17
18
Figure 1
Flow chart of study design and inclusion in analyses. CRP, C reactive protein.
Assessments
Questionnaires A structured questionnaire was used to record the demographic, socioeco‐
nomic, and health-related behaviors of the study participants. Smoking was assessed as a positive reply to the question ‘Do you smoke at all?’ Alcohol intake in grams per day was estimated using standard portion sizes combined with frequencies of intake based on a stan‐
dardized Food Propensity Questionnaire. Physical activity was derived for each partici‐
pant using the International Physical Activity Questionnaire, and participants were classi‐
fied into three categories of total physical activity, namely low, moderate and high level.
Physical examination According to standard operation procedures, weight was measured in light clothing and without shoes with SECA 877 scales to the nearest 0.1 kg. Height was measured without shoes with SECA 217 stadiometer to the nearest 0.1 cm. Body mass in‐
dex (BMI) was calculated as weight (kg) divided by height squared (m ). Blood pressure (BP) was measured three times using the Microlife WatchBP home device, with appropri‐
ately sized cuffs after at least 5 min rest while seated. The mean of the last two BP measure‐
ments was used for the analyses. Hypertension was defined as systolic BP ≥140 mm Hg and/or diastolic BP ≥90 mm Hg, and/or being on antihypertensive medication treatment.
All the anthropometrics were measured twice by the same assessor and the average of the two measurements was used for analyses.
18
19
20
2
Ankle-brachial pressure index (ABI) measurements were performed in supine position us‐
ing a validated oscillometric device (WatchBP Office ABI, Microlife, Widnau) with appro‐
priately sized cuffs after at least 10 min of supine rest. Systolic BP was measured twice in the right and left brachial artery and twice in the right and left posterior tibial arteries. ABI was calculated by taking the highest arm systolic BP as the denominator and the lowest an‐
kle BP as the numerator. The lowest of the left and right ABI measurements was used for analyses. ABI obtained by the oscillometric method using the Microlife WatchBP Office ABI has been shown to correlate well with ABI acquired by Doppler ultrasound with 95%
agreement between the two methods in diagnosing PAD.
Biochemical analyses According to standard operation procedures, fasting venous blood samples were processed and aliquoted into Sarstedt tubes after collection, registered and then temporarily stored at the research site at −20°C. Aliquoted blood samples and first ear‐
ly morning urine sample were transported to the local research centers, where they were checked, registered and stored at −80°C before being shipped to the central laboratory at Charité-University Medicine Berlin (Berlin, Germany) for determination of biochemical variables. Shipping of the samples from European sites was carried out using Styrofoam boxes filled with dry ice and from Ghana in dry shippers filled with liquid nitrogen. Exten‐
sive quality checks were done during the biochemical analysis, including blinded serial measurements. Fasting glucose, total cholesterol, low-density lipoprotein (LDL) choles‐
terol, high-density lipoprotein cholesterol, and triglycerides levels were determined using the ABX Pentra 400 Chemistry Analyzer (HORIBA ABX, Montpellier, France). Fasting plasma glucose concentration was measured using an enzymatic method (hexokinase). The concentration of total cholesterol was assessed using colorimetric test kits. Glycosylated hemoglobin (HbA ) was measured by high-performance liquid chromatography (Tosoh G8 HPLC Analyzer). The concentration of urinary albumin (in µmol/L) was measured by an immunochemical turbidimetric method (Roche Diagnostics) and urinary creatinine concen‐
tration (in μmol/L) was measured by a kinetic spectrophotometric method (Roche Diagnos‐
tics). Urinary albumin to creatinine ratio (ACR; expressed in mg/mmol) was calculated by taking the ratio between urinary albumin and urinary creatinine. Serum creatinine concen‐
tration was determined by a kinetic colorimetric spectrophotometric isotope dilution mass spectrometry calibration method (Roche Diagnostics). The estimated glomerular filtration rate (eGFR) was calculated using the 2009 CKD-EPI (Chronic Kidney Disease Epidemiol‐
ogy Collaboration) creatinine equation. High-sensitive CRP (hs-CRP) levels were measured in heparin plasma by a particle enhanced immunoturbidimetric assay. Human CRP aggluti‐
nates with latex particles were coated with monoclonal anti-CRP antibodies. The aggre‐
gates were determined turbidimetrically using Pentra 400 Chemistry Analyzer (HORIBA ABX). Z-scores were computed for each participant based on the participant’s CRP concen‐
tration (x), mean CRP concentration (μ) and SD (σ). We computed the Z-scores as: Z- score=(x−μ)/σ.
21
22
23
1c
Definition of diabetes and microvascular and microvascular dysfunction Diabetes was de‐
fined according to the WHO diagnostic criteria (self-reported diabetes, documented use of glucose-lowering medication(s), fasting plasma glucose ≥7.0 mmol/L) or HbA ≥6.5% or
≥48 mmol/mol. PAD was defined as ABI ≤0.90. ABI >1.3 was not considered normal as it could be suggestive of non-compressible vessels. Albuminuria and eGFR were clas‐
sified according to the 2012 Kidney Disease: Improving Global Outcomes (KDIGO) guide‐
lines. eGFR was classified as follows: G1, 90 mL/min/1.73 m (normal kidney function);
G2, 60–89 mL/min/1.73 m (mildly decreased); G3a, 45–59 mL/min/1.73 m (mildly to moderately decreased); G3b, 30–44 mL/min/1.73 m (moderately to severely decreased);
G4, 15–29 mL/min/1.73 m (severely decreased); and G5, <15 mL/min/1.73 m (kidney failure). Low eGFR was defined as eGFR <60 mL/min/1.73 m (category ≥G3). Albu‐
minuria classifications were derived from ACR and were as follows: A1, <3 mg/mmol (normal to mildly increased); A2, 3–30 mg/mmol (moderately increased); and A3, >30 mg/mmol (severely increased). Because of the small number of participants in the severely increased albuminuria category (A3), we combined the moderately increased (A2) and se‐
verely increased (A3) categories. Nephropathy was defined as albuminuria and/or eGFR <60 mL/min/1.73 m based on the KDIGO guidelines.
Statistical analysis
Data were analyzed using the IBM SPSS V.23 for Windows. Data with normal distributions were presented as mean±SD, whereas those not normally distributed presented as median (IQR). Categorical data were presented as frequencies (percentages). No significant interac‐
tion between site of residence and CRP was found; therefore, we did not stratify the analy‐
ses by site of residence. However, we used site as a covariate in our logistic regression models. Logistic regression analyses were used to examine the associations between CRP concentrations and diabetes, PAD and nephropathy with adjustments for covariates. ORs and their corresponding 95% CIs were estimated. The minimal sufficient adjustment sets for estimating the direct effect of CRP on PAD and nephropathy were determined by a directed acyclic graph (DAG) (online supplementary figure 1; DAG available at dagitty.net/mGET‐
Va3). DAG was chosen because the traditional methods of adjusting for potential con‐
founders may introduce conditional associations and bias rather than minimize it. Based on the DAG, the minimal sufficient adjustment sets for estimating the total effect of CRP on vascular dysfunction were age, smoking, obesity, hypertension, diabetes and dyslipidemia.
Three models were used to examine the data. Model 1 was unadjusted, model 2 was adjust‐
ed for age and sex, and in model 3 we additionally adjusted for site of residence, smoking, BMI, systolic BP, diabetes and LDL-cholesterol. In the diabetes and non-diabetes subgroup analyses, we adjusted for age, sex, site of residence, smoking, BMI, systolic BP, and LDL- cholesterol in model 3.
24 22 1c
22
25 2
2 2
2
2 2
2 26
25 26
2 25 27
28
Supplementary data
bmjdrc-2020-001235supp001.pdf
Results
Baseline characteristics
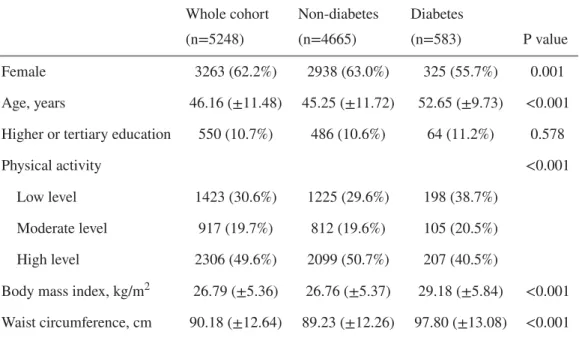
Table 1 shows the baseline characteristics of the study participants. Compared with partici‐
pants without diabetes, participants with diabetes were less frequently female, less physical‐
ly active, much older, consumed more alcohol and had a lower proportion of people who have never smoked. Also, the mean BMI, waist circumference, hip circumference, waist to hip ratio, systolic BP, diastolic BP, total cholesterol and LDL-cholesterol were higher in participants with diabetes than their peers without diabetes. The median CRP concentration and proportion of participants with CRP >3 mg/L were higher in participants with diabetes than those without diabetes. Participants with diabetes had higher rates of PAD and
nephropathy than their peers without diabetes.
Table 1
Baseline characteristics, cardiometabolic risk profiles and rates of microvascular/macrovascular disease according to diabetes status
Whole cohort (n=5248)
Non-diabetes (n=4665)
Diabetes
(n=583) P value
Female 3263 (62.2%) 2938 (63.0%) 325 (55.7%) 0.001
Age, years 46.16 (±11.48) 45.25 (±11.72) 52.65 (±9.73) <0.001 Higher or tertiary education 550 (10.7%) 486 (10.6%) 64 (11.2%) 0.578
Physical activity <0.001
Low level 1423 (30.6%) 1225 (29.6%) 198 (38.7%)
Moderate level 917 (19.7%) 812 (19.6%) 105 (20.5%)
High level 2306 (49.6%) 2099 (50.7%) 207 (40.5%)
Body mass index, kg/m 26.79 (±5.36) 26.76 (±5.37) 29.18 (±5.84) <0.001 Waist circumference, cm 90.18 (±12.64) 89.23 (±12.26) 97.80 (±13.08) <0.001
2
Values for categorical variables are given as number (percentage), and for continuous variables as mean (±SD) or median (IQR).
ABI, ankle-brachial pressure index; ACR, albumin to creatinine ratio; BP, blood pressure; CRP, C reac‐
tive protein; eGFR, estimated glomerular filtration rate; HbA , glycosylated hemoglobin; HDL, high- density lipoprotein; LDL, low-density lipoprotein.
Association between CRP and diabetes
Higher CRP Z-score concentration was associated with higher odds of diabetes in the unad‐
justed model (figure 2). The association persisted in a fully adjusted model (adjusted OR (AOR) 1.13; 95% CI 1.05 to 1.21, p=0.002). In a sensitivity analysis, we excluded partici‐
pants with CRP concentrations >10 mg/L; the SD of the mean CRP was 8.20 mg/L for the whole group and 2.07 mg/L for the subgroup with CRP concentrations ≤10 mg/L. In partic‐
ipants with CRP concentrations ≤10 mg/L (n=4962), higher CRP Z-score concentration was significantly associated with higher odds of diabetes in both the unadjusted (OR 1.31;
95% CI 1.22 to 1.42, p<0.001) and fully adjusted (AOR 1.24; 95% CI 1.14 to 1.36, p<0.001) models.
Hip circumference, cm 100.33 (±11.65) 99.92 (±11.57) 103.65 (±11.76) <0.001 Waist to hip ratio 0.90 (±0.07) 0.89 (±0.07) 0.94 (±0.07) <0.001 Alcohol consumption, g/day 0.14 (1.99) 0.14 (1.87) 0.58 (3.14) 0.067
Smoking status <0.001
Current smokers 151 (2.9%) 135 (2.9%) 16 (2.8%)
Previous smokers 375 (7.2%) 303 (6.6%) 72 (12.4%) Never smoked 4667 (89.9%) 4176 (90.5%) 491 (84.8%)
Systolic BP, mm Hg 129.38 (±19.55) 129.12 (±19.35) 138.11 (±19.47) <0.001 Diastolic BP, mm Hg 81.08 (±11.97) 80.86 (±11.94) 84.80 (±11.31) <0.001 Hypertension 2391 (45.6%) 1952 (41.8%) 439 (75.3%) <0.001 HbA , mmol/mol 37.93 (±12.90) 35.61 (±6.06) 59.30 (±22.97) <0.001 Glucose, mmol/L 5.40 (±1.96) 5.01 (±0.58) 8.19 (±4.25) <0.001 Total cholesterol, mmol/L 5.02 (±1.14) 4.94 (±1.10) 5.19 (±1.33) <0.001 Triglycerides, mmol/L 1.03 (±0.56) 0.98 (±0.53) 1.25 (±0.73) <0.001 LDL-cholesterol, mmol/L 3.22 (±0.99) 3.16 (±0.95) 3.34 (±1.18) <0.001
1c
1c
Figure 2
OR of diabetes per SD increase in the CRP concentration. Model 1 was unadjusted; model 2 adjusted for age and sex; model 3 adjusted additionally for site of residence, smoking, BMI, systolic blood pres‐
sure, and LDL-cholesterol. SD of mean CRP=8.20 mg/L for the whole group (n=5248); SD of mean CRP=2.07 mg/L for the subgroup of participants with CRP concentrations ≤10 mg/L (n=4962). BMI, body mass index; CRP, C reactive protein; LDL, low-density lipoprotein.
Association between CRP and microvascular and macrovascular dysfunction
In participants without diabetes, higher CRP Z-score concentration was associated with higher odds of PAD and nephropathy (table 2). The differences persisted in the fully adjust‐
ed model: PAD (AOR 1.10; 95% CI 1.01 to 1.21, p=0.029) and nephropathy (AOR 1.12;
95% CI 1.04 to 1.22, p=0.004). Among participants with diabetes, higher CRP Z-score con‐
centration was also associated with PAD and nephropathy. The associations remained sta‐
tistically significant in the fully adjusted models for PAD (AOR 1.19; 95% CI 1.03 to 1.41, p=0.046), but not for nephropathy (AOR 1.13; 95% CI 0.97 to 1.31, p=0.120).
Table 2
Association between CRP Z-scores and microvascular/macrovascular dysfunction
Whole group analyses: model 1 was unadjusted; model 2 adjusted for age and sex; model 3 adjusted additionally for site of residence, smoking, BMI, systolic blood pressure, diabetes and LDL-cholesterol.
Subgroup (diabetes and non-diabetes) analyses: model 1 was unadjusted; model 2 adjusted for age and sex; model 3 adjusted additionally for site of residence, smoking, BMI, systolic blood pressure, and LDL-cholesterol.
BMI, body mass index; CRP, C reactive protein; eGFR, estimated glomerular filtration rate; LDL, low- density lipoprotein; PAD, peripheral artery disease.
In the analysis of the association between higher CRP Z-score concentration and the indi‐
vidual components of nephropathy, higher CRP Z-score concentration was associated with higher odds of albuminuria and low eGFR in the non-diabetes group. The differences per‐
Whole cohort (n=5248)
Non-diabetes group
(n=4665) Diabetes group (n=583)
OR (95% CI), p value OR (95% CI), p value OR (95% CI), p value Model
1
Model 2
Model 3
Model 1
Model 2
Model 3
Model 1
Model 2
Model 3
PAD 1.16
(1.09 to 1.25),
<0.001 1.15 (1.08 to 1.24),
<0.000 1.12 (1.04 to 1.21), 0.004
1.14 (1.06 to 1.23),
<0.001 1.14 (1.06 to 1.23), 0.001
1.10 (1.01 to 1.21), 0.029
1.23 (1.05 to 1.43), 0.011
1.22 (1.04 to 1.43), 0.013
1.19 (1.03 to 1.41), 0.046 Nephropathy 1.15
(1.08 to 1.22),
<0.001 1.12 (1.05 to 1.19), 0.001
1.13 (1.05 to 1.21), 0.001
1.13 (1.05 to 1.21), 0.001
1.10 (1.02 to 1.18), 0.014
1.12 (1.04 to 1.22), 0.004
1.17 (1.01 to 1.35), 0.040
1.17 (1.01 to 1.36), 0.037
1.13 (0.97 to 1.31), 0.120
Albuminuria 1.16 (1.08 to 1.23),
<0.001 1.14 (1.07 to 1.22),
<0.001 1.16 (1.08 to 1.24),
<0.001 1.14 (1.06 to 1.22), 0.001
1.12 (1.04 to 1.20), 0.003
1.15 (1.05 to 1.24), 0.001
1.19 (1.02 to 1.38), 0.023
1.20 (1.03 to 1.39), 0.021
1.16 (0.99 to 1.36), 0.066 Low
eGFR
1.10 (1.00 to 1.21), 0.049
1.03 (0.93 to 1.15), 0.548
1.03 (0.91 to 1.17), 0.627
1.12 (1.02 to 1.23), 0.024
1.05 (0.94 to 1.17), 0.398
1.07 (0.94 to 1.21), 0.316
0.90 (0.58 to 1.39), 0.621
0.94 (0.63 to 1.43), 0.788
0.84 (0.47 to 1.49), 0.551
sisted in the fully adjusted model for albuminuria (AOR 1.15; 95% CI 1.05 to 1.24,
p=0.001), but not for low eGFR (AOR 1.07; 95% CI 0.94 to 1.21, p=0.316). Among partic‐
ipants with diabetes, higher CRP Z-score concentration was associated with higher odds of albuminuria, but not with low eGFR in the unadjusted model. In the fully adjusted model the association between higher CRP Z-score concentration and albuminuria was no longer statistically significant (AOR 1.16; 95% CI 0.99 to 1.36, p=0.066).
The sensitivity analysis showing the associations between CRP Z-score concentration and PAD and nephropathy in participants with CRP concentrations ≤10 mg/L is shown in table 3. In the non-diabetes group with CRP ≤10 mg/L, higher CRP Z-score concentrations were significantly associated with higher odds of PAD and nephropathy. The associations were no longer statistically significant in the fully adjusted model: PAD (AOR 1.06; 95% CI 0.93 to 1.21, p=0.372) and nephropathy (AOR 1.32; 95% CI 0.87 to 1.99, p=0.194). In par‐
ticipants with diabetes with CRP concentrations ≤10 mg/L, higher CRP Z-score concentra‐
tion was not significantly associated with PAD or nephropathy: PAD (AOR 1.05; 95% CI 0.75 to 1.47, p=0.785) and nephropathy (AOR 1.69; 95% CI 0.77 to 3.71, p=0.189).
Table 3
Association between CRP Z-scores and microvascular/macrovascular dysfunction in participants with CRP concentrations ≤10 mg/L
Whole group analyses: model 1 was unadjusted; model 2 adjusted for age and sex; model 3 adjusted additionally for site of residence, smoking, BMI, systolic blood pressure, diabetes and LDL-cholesterol.
Subgroup (diabetes and non-diabetes) analyses: model 1 was unadjusted; model 2 adjusted for age and sex; model 3 adjusted additionally for site of residence, smoking, BMI, systolic blood pressure, and LDL-cholesterol.
BMI, body mass index; CRP, C reactive protein; eGFR, estimated glomerular filtration rate; LDL, low- density lipoprotein; PAD, peripheral artery disease.
Discussion
Whole cohort (n=4962)
Non-diabetes group
(n=4430) Diabetes group (n=532)
OR (95% CI), p value OR (95% CI), p value OR (95% CI), p value Model
1
Model 2
Model 3
Model 1
Model 2
Model 3
Model 1
Model 2
Model 3
PAD 1.18
(1.07 to 1.32), 0.002
1.14 (1.03 to 1.28), 0.014
1.06 (0.94 to 1.19), 0.349
1.18 (1.05 to 1.33), 0.004
1.15 (1.02 to 1.29), 0.024
1.06 (0.93 to 1.21), 0.372
1.21 (0.92 to 1.60), 0.177
1.16 (0.87 to 1.55), 0.321
1.05 (0.75 to 1.47), 0.785 Nephropathy 1.95
(1.43 to 2.67),
<0.001 1.67 (1.20 to 2.31), 0.002
1.43 (1.00 to 2.06), 0.051
1.72 (1.20 to 2.47), 0.003
1.44 (0.98 to 2.10), 0.061
1.32 (0.87 to 1.99), 0.194
1.88 (0.96 to 3.69), 0.065
2.07 (1.02 to 4.18), 0.044
1.69 (0.77 to 3.71), 0.189
Albuminuria 2.04 (1.45 to 2.88),
<0.001 1.85 (1.31 to 2.63), 0.001
1.61 (1.09 to 2.38), 0.017
1.95 (1.32 to 2.89), 0.001
1.74 (1.16 to 2.59), 0.007
1.61 (1.03 to 2.51), 0.035
1.53 (0.73 to 3.24), 0.262
1.64 (0.75 to 3.59), 0.212
1.42 (0.59 to 3.40), 0.435 Low
eGFR
1.30 (0.71 to 2.37), 0.397
0.95 (0.49 to 1.85), 0.890
0.74 (0.36 to 1.50), 0.400
1.00 (0.47 to 2.10), 0.993
0.68 (0.30 to 1.55), 0.363
0.61 (0.25 to 1.45), 0.260
1.56 (0.51 to 4.78), 0.433
1.96 (0.57 to 6.69), 0.283
1.20 (0.30 to 4.75), 0.796
Key findings
Using a sample of Ghanaians, we showed that among sub-Saharan Africans higher CRP concentration is associated with higher odds of diabetes, even after adjustments for the con‐
ventional cardiovascular risk factors. Additionally, higher CRP concentration is significant‐
ly associated with higher odds of nephropathy and PAD in non-diabetes and higher odds of PAD in diabetes. The conventional cardiometabolic risk factors did not explain the associa‐
tions between CRP and PAD and/or nephropathy in diabetes and non-diabetes.
Discussion of key findings
This is the first study assessing the relationship between CRP and diabetes among a sub- Saharan African population. The results of our study in Ghanaians suggest an association between higher CRP and higher odds of diabetes in sub-Saharan Africans. A systematic review and meta-analysis by Wang et al had previously shown that elevated levels of in‐
flammatory markers were significantly associated with increased risk of diabetes. The data on which this conclusion was based excluded sub-Saharan Africa origin populations. Con‐
sidering the ethnic differences in the association between inflammation and diabetes, data on this association in sub-Saharan Africans are important in the quest to integrate CRP to global risk scores for diabetes. Our finding of a positive association between CRP and diabetes has confirmed earlier findings and expanded the evidence to sub-Saharan African populations. Considering the persistence of a statistically significant association between higher CRP concentration and higher odds of diabetes after excluding individuals with CRP concentrations >10 mg/L, our results could reflect the role of subclinical inflammation, in‐
stead of acute infection. Our cross-sectional analyses also suggest that a reciprocal associa‐
tion between inflammation and diabetes could exist as diabetes may lead to impaired immu‐
nity and increase the risk of chronic infections and/or infestations with subsequent rise in the levels of inflammatory markers.
Although inflammation measured by CRP is a known risk factor for CVD, its associations with microvascular and macrovascular dysfunction in diabetes and in non-diabetes are un‐
clear. In diabetes, most studies investigating this relationship have reported significant posi‐
tive association between inflammation and vascular complications. Our results show that in sub-Saharan Africans with diabetes, higher CRP concentration is positively associat‐
ed with PAD. The associations persisted after adjustments for the conventional cardiovascu‐
lar risk factors. These findings resemble results previously reported in other populations.
In this current study, we did not find a statistically significant association between CRP and nephropathy in participants with diabetes. Existing data in other ethnic groups suggest that higher CRP concentration is associated with nephropathy in diabetes. The direction
10
29
30
12 31 32
31 32
33
of the association between CRP and nephropathy in previous studies is the same in the cur‐
rent study; therefore, it is possible that limited power restricted us from finding a significant association between CRP and nephropathy in diabetes.
There are limited data on the association between CRP and microvascular/macrovascular dysfunction in individuals without diabetes. Our study shows that in sub-Saharan Africans without diabetes, higher CRP concentration is significantly associated with PAD and nephropathy. This finding highlights the role of inflammation in the pathogenesis of mi‐
crovascular/macrovascular dysfunction, independent of hyperglycemia. This has impor‐
tant implications in low-to-middle-income regions like sub-Saharan Africa, where in addi‐
tion to the growing burden of obesity and diabetes there is a high burden of proinflammato‐
ry conditions, including chronic or recurrent infections and infestations. Chronic intravascular infections and infestations may trigger the inflammatory pathways, predispos‐
ing the macrovasculature and microvasculature to accelerated atherosclerosis. Also, chronic extravascular infections can enhance extravascular production of inflammatory cy‐
tokines that may accelerate the process of atherosclerosis. The conventional cardiometa‐
bolic risk factors did not significantly attenuate the association between CRP and PAD or nephropathy in non-diabetes. This further highlights the fact that the inflammatory path‐
ways driving microvascular and macrovascular dysfunction may not be fully dependent on the conventional cardiovascular risk factors. Indeed, we have previously reported that the higher rates of microvascular and macrovascular dysfunction in sub-Saharan Africans liv‐
ing in Africa compared with their peers in Europe are not fully explained by glycemic con‐
trol or the conventional cardiovascular risk factors.
Overall, our results support the idea that some process related to persistent inflammation is associated with microvascular and macrovascular dysfunction, although the clinical utility of this remains unclear, especially in the setting of low-income to middle-income countries where the likelihood of low-grade inflammation from non-hyperglycemic causes including chronic infections and infestations is high. Based on the CANTOS trial (Canakinumab Anti-Inflammatory Thrombosis Outcomes Study), anti-inflammatory therapy targeting the interleukin-1β pathway significantly reduced macrovascular events. Although not previ‐
ously investigated, the finding from the CANTOS trial may suggest that interventions aimed at controlling low-grade inflammation may be valuable in curbing the rates of mi‐
crovascular and macrovascular dysfunction. This may include relatively less expensive in‐
terventions like control of chronic infections and infestations. Another clinical significance of our results is the potential of using CRP as a marker for assessing or monitoring the risk of developing vascular dysfunction in individuals with and without diabetes. This could aid early detection of vascular dysfunction, improve quality of life and reduce healthcare-relat‐
ed costs through preventive interventions.
Limitations
17 34
6 11 35 36 17 37 17
38 39
36
40
Our study has some limitations. First, we used hs-CRP as the marker of inflammation. hs- CRP does not necessarily reflect the degree of inflammation of individual tissues. Addition‐
ally, CRP is only one marker of inflammation and other markers such as fibrinogen and D- dimer were not measured in our study. Second, we did not have data on existing acute infec‐
tions or infestations; however, we excluded participants with CRP concentrations >10 mg/L in a sensitivity analysis. Third, the sample size among individuals with diabetes was rela‐
tively small, limiting the power to detect associations between CRP and vascular complica‐
tions in diabetes. Fourth, the microvascular dysfunction of retinopathy and neuropathy, as well as the macrovascular dysfunction of coronary artery disease and cerebrovascular dis‐
ease, were not assessed. Fifth, we did not perform the 2-hour postload plasma glucose in identifying participants with diabetes; this could have underdiagnosed participants with diabetes. Finally, the duration of diabetes was not included as a covariate in the multivari‐
able analysis for participants with diabetes because many study participants did not provide this information.
Conclusion
In our study, higher CRP concentration was associated with higher odds of diabetes. Higher CRP concentration was also associated with higher odds of PAD and nephropathy in non- diabetes and higher odds of PAD in diabetes. Our data from this first study on CRP in rela‐
tion to diabetes and microvascular and macrovascular dysfunction in a sub-Saharan African population suggest that CRP could be explored as a potential marker to identify sub-Saha‐
ran African patients with diabetes at risk for macrovascular complications. Additionally, our finding of an association with higher odds of diabetes and both microvascular and macrovascular dysfunction in non-diabetes individuals implies that CRP could play a role in the assessment of risk before diabetes diagnosis, for example, in pre-diabetes individuals.
In both individuals with and without diabetes, interventions aimed at controlling inflamma‐
tion may help reduce the risk of diabetes and microvascular and macrovascular dysfunction.
Acknowledgments
We are grateful to the research assistants, interviewers, and other staff of the five research locations who have taken part in gathering the data, and most of all the Ghanaian volun‐
teers participating in the RODAM (Research on Obesity and Diabetes Among African Mi‐
grants) study. We gratefully acknowledge the advisory board members for their valuable support in shaping the RODAM study methods, Jan van Straalen from the Amsterdam Uni‐
versity Medical Centre with standardization of the laboratory procedures, and the Amster‐
dam University Medical Centre Biobank for their support in biobank management and high-quality storage of collected samples.
24
Footnotes
Contributors: All authors have contributed substantially to this article and approved the submission.
CFH-B, AHMZ, B-JB, AGBA and COA conceived the idea. CFH-B and COA were responsible for data acquisition and statistical analysis. CFH-B, AHMZ, B-JB, AGBA, KACM, KK-G, MBS, JS, ID, EJAJB, FM, and COA were responsible for data analysis/interpretation. Each author contributed important intellectual content during article drafting or revision and accepts accountability for the overall work by ensuring that questions pertaining to the accuracy or integrity of any portion of the work are ap‐
propriately investigated and resolved. CFH-B takes responsibility for the fact that this study has been reported honestly, accurately and transparently, that no important aspects of the study have been omitted, and that any discrepancies from the study as planned have been explained.
Funding: This work was supported by the European Commission under the Framework Programme (grant number: 278901). KACM is supported by the Intramural Research Program of the National In‐
stitutes of Health at the Center for Research on Genomics and Global Health (CRGGH). The CRGGH is supported by the National Human Genome Research Institute, the National Institute of Diabetes and Digestive and Kidney Diseases, the Center for Information Technology, and the Office of the Di‐
rector at the National Institutes of Health (1ZIAHG200362).
Competing interests: None declared.
Patient consent for publication: Not required.
Ethics approval: Ethical approval of the study protocols was requested at all sites from the respec‐
tive ethics committees in Ghana (School of Medical Sciences/Komfo Anokye Teaching Hospital Com‐
mittee on Human Research, Publication and Ethical Review Board), the Netherlands (Institutional Re‐
view Board of the AMC, University of Amsterdam (reference number: W12_062 # 12.17.0086)), Ger‐
many (Ethics Committee of Charite-Universitätsmedizin Berlin), and the UK (London School of Hy‐
giene and Tropical Medicine Research Ethics Committee) before data collection began in each coun‐
try.
Provenance and peer review: Not commissioned; externally peer reviewed.
Data availability statement: Data are available upon reasonable request. The data sets created and/or analyzed during the current study are available from the corresponding author on reasonable request.
References
1. Marrett E, DiBonaventura MdaCosta, Zhang Q. Burden of peripheral arterial disease in Europe and the United States: a patient survey. Health Qual Life Outcomes 2013;11:175. 10.1186/1477-7525-11-175 [PMC free article]
[PubMed] [CrossRef] [Google Scholar]
2. Criqui MH, Aboyans V, Criqui Michael H. Epidemiology of peripheral artery disease. Circ Res 2015;116:1509–26. 10.1161/CIRCRESAHA.116.303849 [PubMed] [CrossRef] [Google Scholar]
3. Deshpande AD, Harris-Hayes M, Schootman M. Epidemiology of diabetes and diabetes-related complications.
Phys Ther 2008;88:1254–64. 10.2522/ptj.20080020 [PMC free article] [PubMed] [CrossRef] [Google Scholar]
4. Chawla A, Chawla R, Jaggi S. Microvasular and macrovascular complications in diabetes mellitus: distinct or continuum? Indian J Endocrinol Metab 2016;20:546–51. 10.4103/2230-8210.183480 [PMC free article]
[PubMed] [CrossRef] [Google Scholar]
5. Burgess PI, MacCormick IJC, Harding SP, et al.. Epidemiology of diabetic retinopathy and maculopathy in Africa: a systematic review. Diabet Med 2013;30:399–412. 10.1111/j.1464-5491.2012.03756.x [PMC free article]
[PubMed] [CrossRef] [Google Scholar]
6. Kengne AP, Amoah AGB, Mbanya J-C, Pascal KA, Amoah Albert GB. Cardiovascular complications of diabetes mellitus in sub-Saharan Africa. Circulation 2005;112:3592–601.
10.1161/CIRCULATIONAHA.105.544312 [PubMed] [CrossRef] [Google Scholar]
7. Huang D, Refaat M, Mohammedi K, et al.. Macrovascular complications in patients with diabetes and
prediabetes. Biomed Res Int 2017;2017:7839101. 10.1155/2017/7839101 [PMC free article] [PubMed] [CrossRef]
[Google Scholar]
8. Cade WT. Diabetes-related microvascular and macrovascular diseases in the physical therapy setting. Phys Ther 2008;88:1322–35. 10.2522/ptj.20080008 [PMC free article] [PubMed] [CrossRef] [Google Scholar]
9. Sepulveda JL, Mehta JL. C-reactive protein and cardiovascular disease: a critical appraisal. Curr Opin Cardiol 2005;20:407–16. 10.1097/01.hco.0000175518.57804.94 [PubMed] [CrossRef] [Google Scholar]
10. Wang X, Bao W, Liu J, et al.. Inflammatory markers and risk of type 2 diabetes: a systematic review and meta- analysis. Diabetes Care 2013;36:166–75. 10.2337/dc12-0702 [PMC free article] [PubMed] [CrossRef] [Google Scholar]
11. Negi SI, Pankow JS, Fernstrom K, et al.. Racial differences in association of elevated interleukin-18 levels with type 2 diabetes: the atherosclerosis risk in communities study. Diabetes Care 2012;35:1513–8. 10.2337/dc11- 1957 [PMC free article] [PubMed] [CrossRef] [Google Scholar]
12. Hermans MP, Ahn SA, Rousseau MF. Increased CRP: an extended biomarker of microvascular risk in men with type2diabetes. J Diabetes Complications 2019;107413. [PubMed] [Google Scholar]
13. Nguyen DV, Shaw LC, Grant MB. Inflammation in the pathogenesis of microvascular complications in diabetes. Front Endocrinol 2012;3:170. 10.3389/fendo.2012.00170 [PMC free article] [PubMed] [CrossRef]
[Google Scholar]
14. Lowe G, Woodward M, Hillis G, et al.. Circulating inflammatory markers and the risk of vascular
complications and mortality in people with type 2 diabetes and cardiovascular disease or risk factors: the advance study. Diabetes 2014;63:1115–23. 10.2337/db12-1625 [PubMed] [CrossRef] [Google Scholar]
15. Orasanu G, Plutzky J. The pathologic continuum of diabetic vascular disease. J Am Coll Cardiol 2009;53:S35–42. 10.1016/j.jacc.2008.09.055 [PMC free article] [PubMed] [CrossRef] [Google Scholar]
16. Roussel R, Steg PG, Mohammedi K, et al.. Prevention of cardiovascular disease through reduction of glycaemic exposure in type 2 diabetes: a perspective on glucose-lowering interventions. Diabetes Obes Metab 2018;20:238–44. 10.1111/dom.13033 [PubMed] [CrossRef] [Google Scholar]
17. Libby P, Ridker PM, Maseri A. Inflammation and atherosclerosis. Circulation 2002;105:1135–43.
10.1161/hc0902.104353 [PubMed] [CrossRef] [Google Scholar]
18. Agyemang C, Beune E, Meeks K, et al.. Rationale and cross-sectional study design of the research on obesity and type 2 diabetes among African migrants: the RODAM study. BMJ Open 2014;4:e004877. 10.1136/bmjopen- 2014-004877 [PMC free article] [PubMed] [CrossRef] [Google Scholar]
19. Galbete C, Nicolaou M, Meeks KA, et al.. Food consumption, nutrient intake, and dietary patterns in Ghanaian migrants in Europe and their compatriots in Ghana. Food Nutr Res 2017;61:1341809.
10.1080/16546628.2017.1341809 [PMC free article] [PubMed] [CrossRef] [Google Scholar]
20. Craig CL, Marshall AL, Sjöström M, et al.. International physical activity questionnaire: 12-country reliability and validity. Med Sci Sports Exerc 2003;35:1381–95. 10.1249/01.MSS.0000078924.61453.FB [PubMed]
[CrossRef] [Google Scholar]
21. Saladini F, Benetti E, Masiero S, et al.. Accuracy of microlife watchBP office ABI monitor assessed according to the 2002 European society of hypertension protocol and the British hypertension Society protocol. Blood Press Monit 2011;16:258–61. 10.1097/MBP.0b013e32834af72e [PubMed] [CrossRef] [Google Scholar]
22. Aboyans V, Criqui MH, Abraham P, et al.. Measurement and interpretation of the ankle-brachial index: a scientific statement from the American heart association. Circulation 2012;126:2890–909.
10.1161/CIR.0b013e318276fbcb [PubMed] [CrossRef] [Google Scholar]
23. Kollias A, Xilomenos A, Protogerou A, et al.. Automated determination of the ankle-brachial index using an oscillometric blood pressure monitor: validation vs. doppler measurement and cardiovascular risk factor profile.
Hypertens Res 2011;34:825–30. 10.1038/hr.2011.53 [PubMed] [CrossRef] [Google Scholar]
24. WHO Definition and diagnosis of diabetes mellitus and intermediate hyperglycaemia. Available:
http://www.who.int/diabetes/publications/diagnosis_diabetes2006/en/
25. Lamb EJ, Levey AS, Stevens PE. The kidney disease improving global outcomes (KDIGO) guideline update for chronic kidney disease: evolution not revolution. Clin Chem 2013;59:462–5. 10.1373/clinchem.2012.184259 [PubMed] [CrossRef] [Google Scholar]
26. Haneda M, Utsunomiya K, Koya D, et al.. A new classification of diabetic nephropathy 2014: a report from joint Committee on diabetic nephropathy. J Diabetes Investig 2015;6:242–6. 10.1111/jdi.12319 [PMC free article]
[PubMed] [CrossRef] [Google Scholar]
27. Molitch ME, Adler AI, Flyvbjerg A, et al.. Diabetic kidney disease: a clinical update from kidney disease:
improving global outcomes. Kidney Int 2015;87:20–30. 10.1038/ki.2014.128 [PMC free article] [PubMed]
[CrossRef] [Google Scholar]
28. Shrier I, Platt RW. Reducing bias through directed acyclic graphs. BMC Med Res Methodol 2008;8:70.
10.1186/1471-2288-8-70 [PMC free article] [PubMed] [CrossRef] [Google Scholar]
29. Miller MA, Cappuccio FP. Ethnicity and inflammatory pathways - implications for vascular disease, vascular risk and therapeutic intervention. Curr Med Chem 2007;14:1409–25. 10.2174/092986707780831131 [PubMed]
[CrossRef] [Google Scholar]
30. Gulhar R, Jialal I. Physiology, acute phase reactants. StatPearls Publishing, 2019. [Google Scholar]
31. Emerging Risk Factors Collaboration, Kaptoge S, Di Angelantonio E, et al.. C-reactive protein concentration and risk of coronary heart disease, stroke, and mortality: an individual participant meta-analysis. Lancet
2010;375:132–40. 10.1016/S0140-6736(09)61717-7 [PMC free article] [PubMed] [CrossRef] [Google Scholar]
32. Abdellaoui A, Al-Khaffaf H. C-reactive protein (CRP) as a marker in peripheral vascular disease. Eur J Vasc Endovasc Surg 2007;34:18–22. 10.1016/j.ejvs.2006.10.040 [PubMed] [CrossRef] [Google Scholar]
33. Liu Q, Jiang C-Y, Chen B-X, et al.. The association between high-sensitivity C-reactive protein concentration and diabetic nephropathy: a meta-analysis. Eur Rev Med Pharmacol Sci 2015;19:4558–68. [PubMed] [Google Scholar]
34. Brevetti G, Giugliano G, Brevetti L, Gregorio B, Giuseppe G, et al.. Inflammation in peripheral artery disease.
Circulation 2010;122:1862–75. 10.1161/CIRCULATIONAHA.109.918417 [PubMed] [CrossRef] [Google Scholar]
35. Agyemang C, Meeks K, Beune E, et al.. Obesity and type 2 diabetes in sub-Saharan Africans - is the burden in today's Africa similar to African migrants in Europe? the RODAM study. BMC Med 2016;14:166.
10.1186/s12916-016-0709-0 [PMC free article] [PubMed] [CrossRef] [Google Scholar]
36. Vos T, Abajobir AA, Abate KH, et al.. Global, regional, and national incidence, prevalence, and years lived with disability for 328 diseases and injuries for 195 countries, 1990-2016: a systematic analysis for the global burden of disease study 2016. Lancet 2017;390:1211–59. 10.1016/S0140-6736(17)32154-2 [PMC free article]
[PubMed] [CrossRef] [Google Scholar]
37. Budzyński J, Wiśniewska J, Ciecierski M, et al.. Association between bacterial infection and peripheral vascular disease: a review. Int J Angiol 2016;25:3–13. 10.1055/s-0035-1547385 [PMC free article] [PubMed]
[CrossRef] [Google Scholar]
38. Hayfron-Benjamin C, van den Born B-J, Maitland-van der Zee AH, et al.. Microvascular and macrovascular complications in type 2 diabetes Ghanaian residents in Ghana and Europe: the RODAM study. J Diabetes Complications 2019;33:572–8. 10.1016/j.jdiacomp.2019.04.016 [PubMed] [CrossRef] [Google Scholar]
39. Hayfron-Benjamin CF, van den Born B-J, Maitland-van der Zee AH, et al.. Higher prevalence of peripheral arterial disease in Ghana compared to Ghanaian migrants in Europe: the RODAM study. Int J Cardiol
2020;305:127–34. 10.1016/j.ijcard.2019.12.028 [PubMed] [CrossRef] [Google Scholar]
40. Ridker PM, Everett BM, Thuren T, et al.. Antiinflammatory therapy with canakinumab for atherosclerotic disease. N Engl J Med 2017;377:1119–31. 10.1056/NEJMoa1707914 [PubMed] [CrossRef] [Google Scholar]
Back to Top