ATTITUDES AND PRACTICES AMONG COLLEGE STUDENTS RELATIVE TO PERSONAL LISTENING DEVICE USAGE AND HEARING CONSERVATION
by
Molly Grace Williams
A thesis submitted to the faculty of The University of Mississippi in partial fulfillment of the requirements of the Sally McDonnell Barksdale Honors College.
Oxford May 2016
Approved by
___________________________________
Advisor: Dr. Gregory Snyder ___________________________________
Reader: Dr. Rebecca Lowe
___________________________________
Reader: Dr. Lennette Ivy
© 2016
Molly Grace Williams ALL RIGHTS RESERVED
ACKNOWLEDGEMENTS
I would first like to express my deepest gratitude to my advisor, Dr. Snyder, for all of the time and attention he has dedicated to me throughout this process. I could not have
completed this assignment without his knowledge, guidance, patience, and encouragement. I would also like to thank Dr. Rebecca Lowe and Dr. Lennette Ivy for their feedback and constructive criticism. Also, I must acknowledge Dr. Williams who taught me about the equipment at the university, supervised some of my data collection, and allowed me to use the facilities to conduct research. I want to thank my two research assistants, Sydney and Emma, for their help with collection of data. Finally, I would like to thank my family and friends who were wise counsels and sympathetic ears. Without
their love and support, I could not have completed this assignment.
ABSTRACT
MOLLY GRACE WILLIAMS: Attitudes and Practices Among College Students Relative to Personal Listening Device Usage and Hearing Conservation
(Under the direction of Dr. Gregory Snyder)
As technology has advanced, the popularity of personal listening devices (PLD) has become widespread among the millennial generation. It is normal in today’s culture to see members of the millennial generation using their PLDs in most any setting. Due to this growth in popularity and usage of PLDs, there is an increased and relatively undocumented opportunity for noise induced hearing loss (NIHL) among the people in the millennial generation. In order to research the effects of this shift in culture relative to PLD usage, college-aged members of the millennial generation were asked to participate in a study via word of mouth advertising. The participants completed a survey that recorded their personal demographics, PLD usage habits, knowledge about NIHL, and attitudes toward NIHL resulting from PLD usage. After the survey, researchers
quantifiably measured the participants’ PLD acoustic intensity using an Audioscan Verifit machine. The survey and PLD intensity data are reported in the text. Analysis of these data revealed that study participants are relatively successful in estimating their own listening intensity. Also, these data recorded a positive relationship between age and intensity; as age increased, the intensity of music increased as well. Results indicate that average measured intensity and reported personal usage habits suggest that users are not at risk for NIHL relative to the Occupational Safety and Health Administration (OSHA) standards. However, an analysis of peak intensities suggests that approximately 40% of participants may be at risk for NIHL.
TABLE OF CONTENTS
LIST OF FIGURES vi
LIST OF TABLES viii
LIST OF ABBREVIATIONS ix
CHAPTER I: INTRODUCTION 1
CHAPTER II: METHODOLOGY 12
CHAPTER III: RESULTS 15
CHAPTER IV: DISCUSSION 36
REFERENCES: 42
APPENDICES 48
LIST OF FIGURES
Figure 1 Age of participants 16
Figure 2 Gender of participants 16
Figure 3 Ethnicity of participants 17
Figure 4 PLD usage- Days per week 17
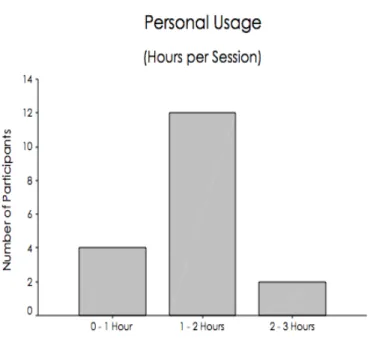
Figure 5 PLD usage- Hours per session 18
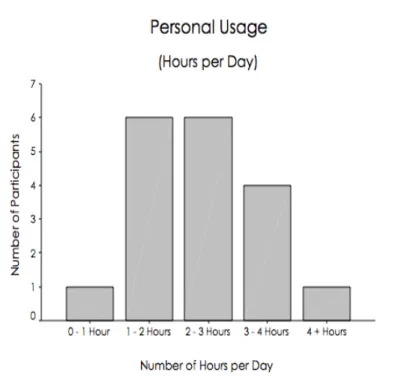
Figure 6 PLD usage- Hours per day 18
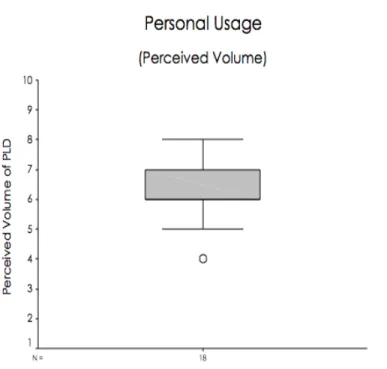
Figure 7 PLD usage- Perceived volume 19
Figure 8 PLD usage- noisy environments 19
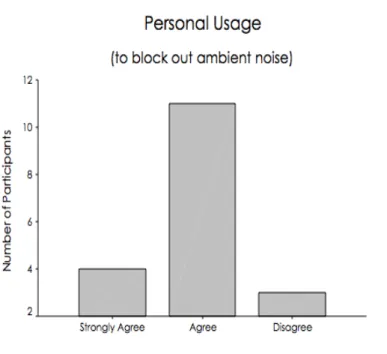
Figure 9 PLD usage- Blocking out ambient noise 20
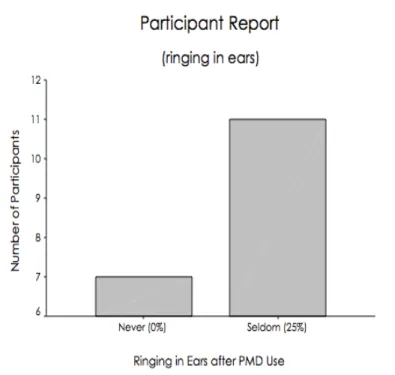
Figure 10 Ringing in ears 20
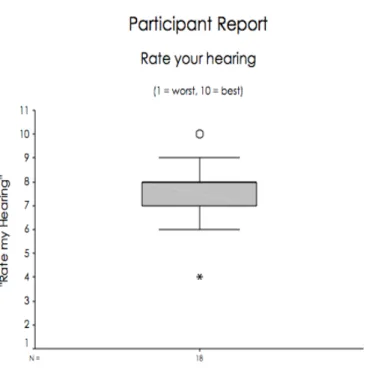
Figure 11 Rate your hearing 21
Figure 12 Using a music device at loud levels can damage hearing 21 Figure 13 Hearing loss caused by noise can be prevented 22
Figure 14 Ringing in the ears as a warning sign 22
Figure 15 Turning up the volume as a sign of hearing loss 23 Figure 16 Familiarity with volume-limiting features on PLD 23 Figure 17 Participant Report- Concern over hearing loss 24 Figure 18 Participant Report- Concern over hearing loss due to PLD
usage
24
Figure 19 Use of volume limiting on PLD 25
Figure 20 Knowledge would lead to change in device usage 25 Figure 21 Turn down the volume rather than limit listening time 26
Figure 22 Listen to music for less time to reduce risk of hearing loss 26 Figure 23 Lower the volume to reduce risk of hearing loss 27
Figure 24 Volume importance relative to time 27
Figure 25 Personal Usage- Hours per day relative to peak intensity 29 Figure 26 Participant’s peak intensity relative to OSHA standards 29
Figure 27 Intensity by frequency ranges 30
Figure 28 Hours per day vs. peak intensity analysis 32
Figure 29 Hours per day vs. peak intensity graph 32
Figure 30 Daily usage vs. intensity analysis 33
Figure 31 Daily usage vs. intensity graph 33
Figure 32 Perceived volume vs. measured intensity analysis 34 Figure 33 Perceived volume vs. measured intensity graph 34
Figure 34 Age vs. intensity analysis 35
Figure 35 Age vs. intensity graph 35
LIST OF TABLES
Table 1 Occupational Safety and Health Administration (OSHA)
permissible noise exposure 37
Table 2 Duration vs. sound intensity for participants 38
Table 3 Peak intensity vs. average intensity 39
LIST OF ABBREVIATIONS
NIHL Noise induced hearing loss
PLD Personal listening device
OSHA Occupation safety and health administration
Chapter I Introduction Influence of technology
As short as one decade ago, it was rare to see people conducting their daily living activities while wearing personal listening devices (PLD); and this was due to a variety of reasons, including the PLD’s cost, weight, and onerous size. Although some early
adopters used PLDs, they were not easily wearable. Due to technological advances, PLDs have now become much cheaper, smaller, lighter, portable, and with increased capacity;
moreover, PLDs have become integrated into convergence devices, such as smartphones.
As a result, our culture has evolved over the past 10 years such that one can walk around most any college campus today and notice a significant number of students using PLDs.
The majority of people live with these devices constantly connected to them, and it is universally adopted as a cultural norm. Many researchers anticipate that this change in popular culture may have negative long-term effects on the hearing of the millennial generation and younger.
PLDs made wearable
The concerns about long-term hearing damage are a relatively recent
phenomenon. Perhaps the first modern PLD device was manufactured in 1979, when
Sony developed and released its 5.9 x 3.5 x 1.4 inch, 14-ounce “Walkman” cassette player (Haire, 2009). In October 2001, Apple created an extraordinarily successful trend setting device of the 21st century—the 6.4-ounce IPod that held over 1,000 songs (Levy, 2006. p. 1). This new innovation changed the way that people could listen to their music and it sparked a new technological age that changed our culture (Levy, 2006). Ahmed et al. (2007) document increasing concern that the cultural use of new PLDs is significantly more popular and excessive, and therefore more dangerous, than older technologies.
Levey, Levey, & Fligor (2011) claim that the increased cultural popularity of PLDs is due to their improved function and design (p. 265). For example, the large storage space on PLDs, longer battery life, and small size make PLDs very convenient to listen to for extended amounts of time (McNeill, Keith, Feder, Konkle, & Michaud, 2010; Levey et al., 2011, p. 265; Keith, Michaud, & Chiu, 2008). PLDs can now store thousands of songs in a compressed format and have the battery power to last all day (Levey et al., 2011, p. 265; Daniel, 2007). Levey et al. (2011) claim that these qualities of the PLD create the opportunity for young people to place themselves at risk for noise induced hearing loss (NIHL; p. 265).
Growth popularity of PLDs among millennial generation
Innovations making the PLD cheaper, smaller, and lighter have made them extremely popular, especially among the millennial generation, who were the first group to experience the digital implementation of this technological phenomenon from their childhood. McNeill et al. (2010) suggests that the popularity of PLDs has increased and is one of the most popular types of leisure activities (p. 646). Ahmed et al. (2007) conducts
a survey that finds 82% of participants who were undergraduate college students and members of the millennial generation, owned a PLD; later research suggests that this popularity is increasing, as 86% of undergraduate college students (as of 2015) own a convergence device (i.e., smartphone) that include PLD capabilities (Chen, Seilhamer, Bennett, & Bauer, 2015). Latonero (2000) discovered that even in the year 2000, 69% of this generation was downloading mp3 compressed music. A survey conducted by
Student Monitor, a marketing research group, showed that undergraduate college students believed listening to an IPod was the best free time activity, surpassing alcohol related activities (Associated Press, 2006). This popularity of PLDs suggests that NIHL is possibly a larger concern now than before this technological growth.
PLDs as a generational symbol
Due to the accessibility and popularity of technology, PLDs have been embedded in the millennial generation’s culture and social life. Levy (2006) explains that this 6- ounce gadget has many cultural signifiers; many even refer to the millennial generation as the ‘IPod generation’, which may no longer be used due to the technological
convergence of the cell phone and PLD (p. 4). Levey et al. (2011) explain that social and cultural facets of PLDs could possibly play a larger role in the use of these devices than the factors such as battery power, music storage, and convenient size (p. 265). It was discovered by Levey, Fligor, Ginocchi, & Kagimbi (2012) that even though listeners may be aware of the risks involved with PLDs, there are social factors that cause these
listeners to disregard the possibility of NIHL (p. 78). The IPod has now become a
generational symbol of social status (Levey et al., 2012, p. 78; Levey et al., 2011, p. 266).
Levey et al. (2011) claims that a PLD, specifically an iPod, appeals to young adults due to its sleek style and unique but recognizable design (p. 266). This study explains that wearing headphones signals to others the possession of the coveted chic and sophisticated cultural commodity (Levey, et al., 2011, p. 266).
Not only do feelings of social security exist among PLD users, but also a sense of internal security. Hoover & Krishnamurti (2010) found that 76.8% of young adults feel more relaxed and safe when using their PLD. Bull (2013) expands on this idea suggesting that listeners have the ability to create their own personal soundscape through the use of their PLD. This individualized bubble listeners create allows them to control mood, environment, and interactions allowing for a “mediated and privatized auditory world through which experience is seamlessly filtered” (Bull, 2013, p. 503). Levey et al. (2011) also supports this idea explaining that PLD users are able to avoid noises and aspects of city life such as subway noises, cars, or even being asked for money by beggars (p. 265).
A PLD is one of a few belongings that can create solitude while living an urban, fast- paced life (Levey et al., 2011, p. 265). Levy (2006) finds that a PLD can dominate thoughts to generate an alternative reality that can be taken anywhere and may bring more delight and pleasantry than real life (p. 202).
The risks of cultural change
As a consequence of this cultural shift, the millennial generation—people born from the 80’s to 2000’s—has become the most ‘at risk’ population due to their continued exposure to high noise levels (Stein, 2013). The risk of NIHL targets those people who adopted PLDs at the beginning of their emergence. The early adopters of PLDs are the
millennial generation who experienced this technological and cultural change as it took place. Hoover et al. (2010) states that there are significant concerns in relation to PLDs among college students, who constitute the millennial generation. The two largest concerns in relations to PLDs are 1) the possibility of overexposure for college students who listen to PLDs at high intensity over an extended amount of time and 2) the
possibility of hearing damage to listeners due to noisy environments (Hoover et al., 2010). Biassoni et al. (2014) conducted a test on 14 and 15 year olds and retested them at ages 17 and 18. This longitudinal study assessed two variables: hearing and exposure to music; the results showed a hearing threshold shift after 3 years along with an increase of music exposure (Biassoni et al., 2014). This data suggests that as time progresses and the millennial generation ages, their hearing is only worsening. Also, Chung, Des Roches, Meunier, & Eavey (2005) conducted a survey via MTV.com targeting young adults that included questions about views toward hearing health. The average age of respondents was 19.2 years old. The results indicated that only 8% of participants found hearing loss to be a big concern in comparison to other health issues, although almost 61% of the participants reported experiencing tinnitus (Chung et al., 2005). This study suggests that NIHL caused by PLDs has a low level of awareness among young adults and is a large concern for their generation. This generation will be the first to have access to wearable technology for almost their entire lifespan; therefore we do not know the full affects PLDs will have on users. However, there is research that projects the prevalence and consequences of NIHL.
NIHL prevalence
Unsafe noise exposure has only increased in the millennial generation, and they continue to put themselves at risk for potential hearing damage with their prolific PLD usage (Vogel, Brug, van der Ploeg, & Raat; 2007). The National Institute of Occupational Safety and Health report that approximately 30 million Americans are exposed daily to unsafe noise levels that could lead to noise induced hearing loss (NIHL, Daniel 2007).
Other research documents that over 10 million people suffer from NIHL (Dangerous Decibels, 2011). One study of this generation estimated that 12.5% have a NIHL and are often exposed to hazardous levels of sound (Niskar, Kieszak, Esteban, Rubin, Holmes, &
Brody, 2001). Chung et al. (2005) also cite that NIHL is a significant public health issue that is not being addressed in the lives of the millennial generation.
The consequences of NIHL in daily life
Not only does NIHL have permanent effects, but it also affects quality of life in many ways—the most pertinent being communication (Vogel et al., 2007). Thhe American Speech-Language-Hearing Association (AHSA) reports that even a small amount of hearing loss can affect communication, speech, language comprehension, and learning.
Levey et al. (2012) explains that just a mild hearing loss will make it challenging for the listener to hear grammatical features of language including stops (p, d, t, k) and weak consonants (f, s, sh, h). Also, Niskar et al. (2001) states that any level of hearing loss may result in difficulty detecting certain sounds used in speech or high frequency noises such as whistles or alarms.
With a decreased ability to efficiently communicate and understand spoken language, individuals may have difficulty in social situations that can cause internal and social struggles. Daniel (2007) states that studies have shown that “children and adults with impaired hearing have a poorer quality of life related to reduced social interactions, isolation, a sense of exclusion, depression, and possibly impaired cognitive function”.
Crandell, Mills, & Gauthier (2004) believe NIHL weakens an individual’s physical health as well as their psychosocial health. Crandell et al. (2004) also explains that individuals suffering from NIHL can experience depression, loneliness, anger, fear, and frustration due to the lack of communication.
PLD usage and NIHL
Although research suggests that the effects of NIHL are detrimental to quality of life, data claims that the millennial generation are exposing themselves to dangerous levels of noise through the use of PLD and is doing so consciously (Daniel, 2007). For example, a study conducted by Crandell et al. (2004) found that 72% of college students do not choose to protect their hearing despite knowing ways to prevent NIHL (p. 182). The study suggests this is due to the cultural influences and images of attractiveness that outweigh the seriousness of potential NIHL among the millennial generation (Crandell et al., 2004, p. 182). Daniel (2007) also found young people are voluntarily exposing themselves to loud noise specifically through headphones. Moreover, data likewise reveals that many adolescents are consciously and deliberately exposing themselves to danger levels of noise through the use of PLD, which has created concern about potential hazards for NIHL that young adults create for themselves while using PLDs (McNeill et
al., 2010). In a survey of college students conducted by McNeill et al. (2010) it was shown that 21 of 28 participants had been warned about the affects and dangers that PLDs may pose to hearing, yet only 11 of 28 subjects claimed to be ‘moderately’ or
‘very’ concerned about the harm of PLDs. Also, Ahmed et al. (2007) found that almost 69% of university students reported no concern about hearing loss in relation to PLD usage. While these data citing unsafe listening levels is well documented, an explanation for why these data reflect this reality remains unknown.
Hearing awareness and conservation
If NIHL is an increasing concern in today’s young adult population, how do scientists work to prevent this problem from affecting future generations? Many researchers believe the answer to this problem is education about hearing conservation.
Ahmed et al. (2007) concludes that it is essential to increase awareness about NIHL, which may protect this generation from a widespread problem in the future.
Unfortunately, only 16% of young adults report any exposure to education about hearing health (Chung et al, 2005). Hoover et al. (2010) found that 61.4% of a sample of college students were annoyed by advice that warned against the use of PLDs. Chung et al.
(2005) believes that information about hearing conservation should be presented to young adults through mediums such as the Internet. Wittman (2006) conducted and documented data suggesting that information about NIHL can be communicated through magazines and TV (p. 7). Hoover et al. (2010) suggests that establishing clear and proper listening guidelines for college students will assist them in making healthy listening choices such as using volume limiting applications, buying headphones that help block background
noise, or limiting the amount of time spent using a PLD. While this ivory tower academic research sounds efficacious relative to the audiological hygiene of the millennial generation, such efforts have yet to demonstrate successful hearing conservation habits in the current popular culture.
The Future of Hearing Health Among Millennials
Despite the need of education about NIHL among college age adults and the need for information about NIHL related to PLDs, there is a paucity of research conducted on this topic. Ahmed et al. (2007) explains that there has been little research conducted about how young adults are using their PLDs due to the newness of PLDs and audio technology. The study conducted by Levey et al. (2011) discusses the sound levels of PLDs among college students in New York City. Their goal was to determine whether college students listened to their music at a level that was more or less than the
recommended amount. They found 58% of PLD users were exposed to sounds above the limit, and almost 52% listeners exceeded the weekly limit for sound exposure, which suggests that listeners are at risk of NIHL (Levey et al., 2011, p. 268). In another study, Epstein, Marozeau, & Cleveland (2010) researched PLD users in different environments in Boston to determine if average listeners exceed noise exposure regulations while using their PLDs. They found that listeners generally did not exceed the exposure guidelines for maximum noise exposure and were therefore not at risk for noise induced hearing loss (Epstein et al., 2010). These two studies show the inconsistency of results in relation to NIHL and PLDs, and represent the need for more research.
A study by Crandell et al. (2004) recognized the prevalence of NIHL and investigated the knowledge base and attitudes of college students concerning NIHL and the use of hearing protection. They found that all groups possessed considerable
knowledge about NIHL and its permanent effects; 95% understood that excessive noises could cause hearing damage (Crandell et al., 2004, p. 182). Surprisingly, this study also reported that 72% of college aged young adults do not take precautions to protect their hearing (Crandell et al., 2004, p. 182). This study did not compare the attitudes and knowledge of students with their real-life listening habits, which is a large factor in relation to NIHL. Also, Ahmed et al. (2007) studied hearing health through 150 surveys administered to undergraduate students. They found an area of concern from self-reported data that claimed the majority of students felt their hearing was worse now than five years earlier, but only 12% report using hearing protection (Ahmed et al., 2007, p. 45).
This study does not quantify the hearing loss over the past 5 years and it does not include results that suggest hearing health is worse due to the use of PLDs. Also, this further suggests that there is disconnect between college students’ knowledge and attitudes about NIHL, prevention strategies, and real life habits, which supports the need for education about NIHL among young adults.
Unrecognized Dangers
Due to lack of research, the dangers associated with NIHL are not fully recognized or understood by the millennial generation—the people most affected by this technological cultural shift. The general public knows so little that most do not believe it should be considered a substantial issue. Despite the research proving the increasing issues
regarding NIHL, Chung et al. (2005) discovered the majority of people believed NIHL did not pose as a major concern in comparison to issues such as depression and drug abuse (p. 864). They also discovered that only a small percentage of organizations who have the ability to distribute information about hearing conservation found NIHL to be a big concern among adolescents, which indicates the low priority of hearing loss in relation to other health issues. Since the prevalence of NIHL is growing, the research associated with it should be increasing and actions should be taken to prevent it from becoming more widespread.
Purpose of this Study
The purpose of this study is to gain a more complete understanding of NIHL in relation to PLDs in the millennial generation. PLD usage is now ubiquitous among the millennial generation, and it is imbedded within the social culture. As a result of the PLD’s widespread popularity, coupled with the cultural resistance to hearing
conservation, the likelihood of permanent NIHL among millennials is increasing.
Therefore, the purpose of this study is to measure the knowledge and attitudes of hearing conservation, and compare these data with the actual real life intensities of PLD usage.
Chapter II Methodology Participants
Research participants were all enrolled in a 4-year university. Eighteen participants (10 females and 8 males) participated in this study, and responded to word- of-mouth advertising (Hodgetts, Szarko, & Rieger, 2009, p. 826). All of the participants lived an active lifestyle and used their PLDs two hours or more during the week
(Hodgetts et al., 2009, p. 826). The participants all passed a standard hearing screening at 20 dB (Hodgetts et al., 2009).
Materials
Before beginning data collection, a hearing screening was conducted using a Grason-Stadler Instruments audiometer model 61. The calibration is monitored daily by trained personnel, and was last professionally calibrated 7 months prior to data collection.
Telephonics headphones were used in the sound booth during the hearing screening. A 20-question survey, compiled from previous research, was administered to all participants (Appendix A) (Ahmed et al., 2007; Danhauer et al., 2009; Danhauer et al., 2012; Fligor, Levey, & Levey, 2014; and Gilliver, Beach, & Williams, 2013). In measuring PLD intensity, participants used their own headphones; all participants wore in-ear style headphones. An average of a 60-second music sample was collected in each ear of every research participant (Epstein et al., 2010). To estimate PLD listening level, an Audioscan
Verifit (2787) machine was used, and the system was calibrated before each data collection session (Epstein et al., 2010).
Procedures
All of the data collected from this study were complete in The Speech and Hearing Center at the University of Mississippi. Permission for all experimental procedures and documents was received from the University of Mississippi Institution Review Board (Appendix B). Informed Consent was obtained from each participant before any data was obtained. After written consent was obtained, a hearing screening at 20dB HL was conducted (Biassoni et al., 2014; Epstein et al., 2010; Hodgetts et al., 2009). Once the participant passed the hearing screening, he or she completed a survey compiled from previous studies (Ahmed et al., 2007; Danhauer et al., 2009; Danhauer et al., 2012; Fligor et al., 2014; and Gilliver et al., 2013) before the data collection session.
The survey was administered to participants to collect information that may relate NIHL with PLDs. The survey questions were designed to investigate a number of topics including demographic characteristics, device-use habits, personal knowledge, and personal attitude (Danhauer et al., 2009; Gilliver et al., 2013).
After the preliminary procedures and the survey were completed, the participant was taken into a research laboratory in the audiology suite at the University of
Mississippi Speech and Hearing Center. The participant was told to insert their ear phones and choose any song from their PLD (Ahmed et al., 2007; Feder, Marro, Keith, &
Michaud, 2013). Research participants were told to pick a volume they may use while exercising and trying to block out distractions and noise (Feder et al., 2013). Once the song and volume were chosen, the participant removed the ear buds to allow insertion of
the Verifit probe tube into their ear canal. The probe tube is a small plastic tube with a tiny microphone on the end, which measures peak and average intensities at the tympanic membrane. The participants were informed of a slight tickle sensation that may occur from the insertion of the tube. The tube was inserted approximately one inch into the ear canal for best results. The pressure of the ear canal changes depending on the location within the ear canal, so it is important to test the pressure close to the ear drum by using the Verifit probe tube one in inside of the ear (Ballachanda, 1997). The objective was to have the tube placed approximately 5mm from the tympanic membrane and to place it in the same location during each measurement taken (Ballachanda, 1997). Once the probe tube was secured in the ear, the headphone was placed on top of the tube in the ear. The participant played his or her chosen song for approximately 60 seconds while the Verifit recorded the measurements and data (Epstein et al., 2010). Only one ear was tested at a time, so the same procedures were conducted on the other ear. Once both ears had been tested, the results were doucmented. For each ear, the Audioscan Verifit produced a graph and a table, which were printed and used to interpret the results.
Once the in-ear data was obtained, the participant was educated about the results and listening levels. A brochure from the American Speech Language and Hearing Association (ASHA) was used to tell the participant about their results of the real-ear measurement (Krug et al., 2015). The ASHA NIHL education campaign materials explained the intensities of sound in relation to real life scenarios and also gave information about the dangers of NIHL and how to prevent it.
CHAPTER III RESULTS Participants
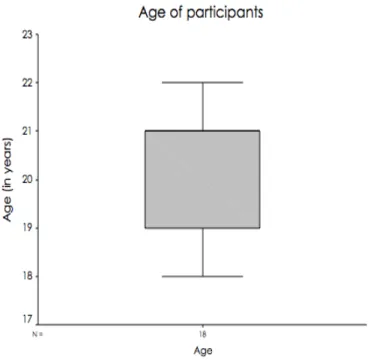
The ages of participants used in this study ranged from 18 to 22 (mean
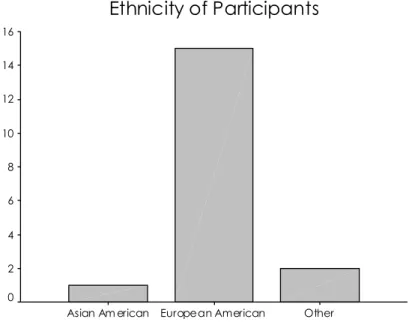
20.28; Figure 1 & Figure 2). There were 10 males and 11 females used in this research (Figure 3). Participant ethnicity included 16 European American, 1 Asian American, and 2 self-reported as "other" (Figure 4). All participants were enrolled in a 4-year
university.
Survey Data: Descriptive Analysis
A 20 questions survey was used in this study, which is detailed in Appendix A.
We collected 18 surveys, and each survey was recorded in an Excel document by using a numbering code. This survey tested participants’ listening habits and usage, knowledge of NIHL, and attitudes of NIHL due to PLD usage. The results from the survey are detailed in Figures 1- 24 below.
Descriptive Statistics
18 18 22 20.28 1.274
18 Age
Valid N (listwise)
N Minimum Maximum Mean Std. Deviation
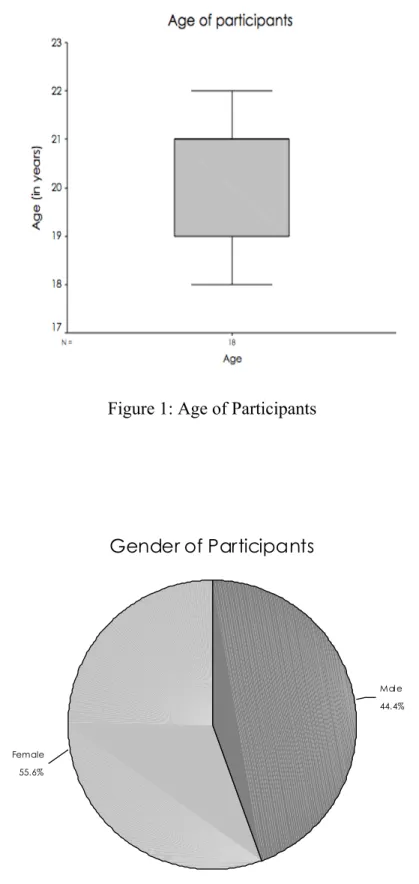
Figure 1: Age of Participants
Figure 2: Gender of Participants Gender of Participants
55.6%
44.4%
Female
Mal e
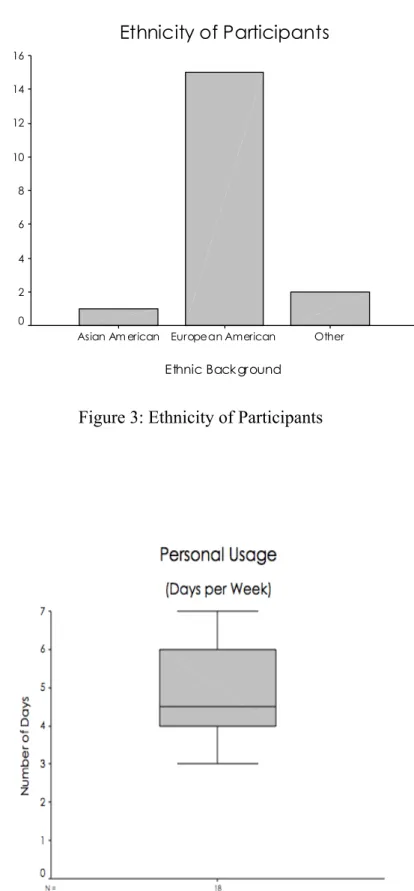
Figure 3: Ethnicity of Participants
Figure 4: PLD Usage - Days per Week Ethnicity of Participants
Ethnic Background
Other European American
Asian Am erican
Number of Participants
16 14 12
10 8 6
4 2 0
Figure 5: PLD Usage - Hours per Session
Figure 6: PLD Usage- Hours per Day
Figure 7: PLD Usage- Perceived Volume
Figure 8: PLD Usage- Noisy Environments
Figure 9: PLD Usage- Blocking out ambient noise
Figure 10: Ringing in ears
Figure 11: Rate your hearing
Figure 12: Using a music device at loud levels can damage hearing Using a music device at loud
listening levels can damage hearing.
11.1%
88.9%
Possibly
Yes
Figure 13: Hearing loss caused by noise can be prevented
Figure 14: Ringing in the ears as a warning sign Hearing loss caused by noise
can be prevented.
22.2%
77.8%
Possibly
Yes
Ringing in the ears could be a warning sign for over exposure to hazardous sound levels.
5.6%
11.1%
83.3%
I don't know
Possibly
Yes
Figure15: Turning up volume as a sign of hearing loss
Figure 16: Familiarity with volume-limiting features on PLD
Turning up the volume over time could be a sign of hearing loss.
5.6%
5.6%
88.9%
I don't know
Possibly
Yes
Figure 17: Participant Report- Concern over hearing loss
Figure 18: Participant Report- Concern over hearing loss due to PLD usage
Figure 19: Use of volume limiting on PLD
Figure 20: Knowledge would lead to change in device usage
Do you use volume-limiting on your PLDs?
88.9%
11.1%
No
Yes
Figure 21: Turn down the volume rather than limiting listening time
Figure 22: Listen to music for less time to reduce risk of hearing loss
Figure 23: Lower the volume to reduce risk of hearing loss
Figure 24: Volume importance relative to time
Measured Intensities
Using the Audioscan Verifit machine, data was collected about PLD listening levels. Data analysis revealed significant differences of average intensities and peak intensities as a function of frequency ranges. Figure 25 shows the peak intensities as compared to the number of hours per day the PLD is used. Also, Figure 26 shows that about 40% of participants may be at risk for NIHL, relative to the Occupational Safety and Health Administration (OSHA) standards of average noise exposure, when analyzing participants’ peak music listening intensities (2008). Measured intensities as a function of frequency range are summarized and shown in Figure 27.
Figure 25: Personal Usage- Hours per day relative to peak intensity
Figure 26: Participant’s peak intensity relative to OSHA standards
Figure 27: Intensity by frequency ranges
Linear Regression Analysis
SPSS statistical software (SPSS 2002, Version 11.5) was used to analyze trends in these data. Regression analysis reveals a correlation that trend toward significance between personal usage (hours per day) and the measured intensity (2khz-4kz, dB) of the music. Further analysis revealed an insignificant relationship between personal usage (hours per day) and peak intensity (Figure 28 & 29). Research suggests an inverse relationship between hours per day and sonic intensity (Figures 30 & 31). Also, the analysis revealed a positive correlational trend between the perceived volume levels and their measured intensity (dB; Figures 32 & 33). These data also revealed another relationship documenting a positive correlation between age and measured intensity. As age increased, listeners used their PLDs at a higher intensity (Figures 34 & 35).
Dependent variable.. PEAKS Method.. LINEAR Listwise Deletion of Missing Data
Multiple R .40748 R Square .16604 Adjusted R Square .11392 Standard Error 9.30180 Analysis of Variance:
DF Sum of Squares Mean Square
Regression 1 275.6250 275.62500 Residuals 16 1384.3750 86.52344 F = 3.18555 Signif F = .0933
--- Variables in the Equation --- Variable B SE B Beta T Sig T
II_PU_3 -3.937500 2.206115 -.407479 -1.785 .0933 (Constant) 104.375000 6.739793 15.486 .0000
Figure 28: Hours per day vs. peak intensity analysis
Figure 29: Hours per day vs. peak intensity graph
4Dependent variable.. HZ2_4_AV Method.. LINEAR Listwise Deletion of Missing Data
Multiple R .46567 R Square .21685 Adjusted R Square .16790 Standard Error 7.66843 Analysis of Variance:
DF Sum of Squares Mean Square
Regression 1 260.52517 260.52517 Residuals 16 940.87760 58.80485 F = 4.43033 Signif F = .0515
--- Variables in the Equation --- Variable B SE B Beta T Sig T
II_PU_3 -3.828125 1.818728 -.465672 -2.105 .0515 (Constant) 87.197917 5.556307 15.694 .0000
Figure 30: Daily usage vs. intensity analysis
Figure 31: Daily usage vs. intensity graph Daily Usage vs Intensity (dB)
Daily Usage (hours per day)
6 5
4 3
2 1
0
Intensity (2khz-4kz) dB
90
80
70
60
Observed Linear
Dependent variable.. LOW_AVE Method.. LINEAR Listwise Deletion of Missing Data
Multiple R .47210 R Square .22288 Adjusted R Square .17431 Standard Error 7.81629 Analysis of Variance:
DF Sum of Squares Mean Square
Regression 1 280.35028 280.35028 Residuals 16 977.50928 61.09433 F = 4.58881 Signif F = .0479
--- Variables in the Equation --- Variable B SE B Beta T Sig T
II_PU_4 3.718265 1.735762 .472100 2.142 .0479 (Constant) 52.401826 11.241584 4.661 .0003
Figure 32: Perceived volume vs. measured intensity analysis
Figure 33: Perceived volume vs. measured intensity graph Perceived Volume vs Measured Intensity
Perceived Volume
10 9 8 7 6 5 4 3 2 1
Low Frequency Intensity (dB)
100
90
80
70
60
50
Observed Linear
Dependent variable.. HZ2_4_AV Method.. LINEAR Listwise Deletion of Missing Data
Multiple R .41530 R Square .17247 Adjusted R Square .12075 Standard Error 7.88271 Analysis of Variance:
DF Sum of Squares Mean Square
Regression 1 207.20794 207.20794 Residuals 16 994.19484 62.13718 F = 3.33469 Signif F = .0866
--- Variables in the Equation --- Variable B SE B Beta T Sig T
AGE 2.739437 1.500147 .415297 1.826 .0866 (Constant) 20.589202 30.476335 .676 .5090
Figure 34: Age vs. intensity analysis
Figure 35: Age vs. intensity graph Age vs Intensity
Age
23 22
21 20
19 18
17
Intensity (2khz - 4khz) dB
90
80
70
60
Observed Linear
CHAPTER IV:
DISCUSSION
Initial application of these PLD usage data, averaged over time and relative to safe listening levels (as documented by OSHA) suggests that this current generation does not appear to be at risk for NIHL. Table 1 further explains the OSHA standards of time versus intensity. Table 2 details the data related to the duration of PLD usage and
intensity measured in this study. Study results also suggest an inverse correlation between the time used and intensity of sound, whereas usage increases, average intensity (dB) will decrease; as a result, these data support past research (Epstein et al, 2010).
Although the OSHA standards are commonly used to determine safe listening levels, they were developed relative to an industrial context and averaged steady state intensity over time; it remains unknown how well the dynamic intensity of music falls within the OSHA standard. This may be of concern—as data revealed that the dynamic nature of music, including transient peaks, demonstrated far greater intensity relative to the average intensity (Table 3). Perhaps the most applicable data relative to peak music intensity would be the impact of noise exposure, which OSHA states should not exceed 140dB (OSHA, 2008). However, there is a paucity of data studying the effects of impact noise exposure over longer durations of time, and its effects on NIHL. As a result, the industry continues to use the OSHA standards, assuming its safe application relative to the recent phenomenon of cultural PLD usage. Though these standards may give an indication about noise exposure and NIHL, further research on the effects of impact noise
exposure (and the analogous peak music intensity) over time relative to NIHL is warranted.
Table 1:
Occupational Safety and Health Administration (OSHA) permissible noise exposure
Duration (Hours per day) Sound Level (dB)
8 90
6 92
4 95
3 97
2 100
1.5 102
1 105
.5 110
.25 or less 115
Table 2:
Duration vs. Sound Intensity for participants
Participant Duration (per day) Intensity dB (avg. 2k-4k Hz)
1 3-4 hours 69
2 3-4 hours 76.2
3 2-3 hours 70
4 2-3 hours 77
5 1-2 hours 86.5
6 1-2 hours 66.2
7 4 or more hours 75.7
8 2-3 hours 68.7
9 2-3 hours 87.3
10 1-2 hours 86.5
11 0-1 hour 88.2
12 3-4 hours 72.8
13 2-3 hours 77
14 2-3 hours 73.3
15 1-2 hours 68.7
16 3-4 hours 61
17 1-2 hours 77.5
18 1-2 hours 89
Table 3:
Peak Intensity vs. Average Intensity
Participants Average Intensity Peak Intensity
1 67.2 84
2 76.2 91
3 75.3 96
4 74.4 90
5 76.7 100
6 70.3 88
7 78 94
8 71.9 86
9 84.1 99
10 88.8 105
11 86 102
12 76 99
13 68.6 82
14 76.9 97
15 69.8 82
16 60.3 70
17 80.6 98
18 84.6 111
Seen in Figure 29 & 30, participants seemed to be able to estimate their perceived volume versus their actual intensity of PLD usage. The majority of participants are open to
education, and they seem to care about future hearing loss due to PLD usage, particularly with averaged intensity over time (Figure 17, 18, & 20). Therefore, data suggests that participants may be able to successfully monitor their own safe usage. However, if peak intensity is found to correlate with NIHL, these data also reveal an insignificant
relationship between daily personal usage and peak intensity, suggesting that a significant number of PLD users are at risk (Figures 28 & 29); clearly, future research is warranted.
These data also revealed in Figures 31 & 32 a slight trend toward significance in age versus intensity relationship; as age increases, the intensity to which people listen to their PLDs increases as well. As a result, these data may warrant future research as well.
Limitations and Future Research
Though this research is pertinent to the millennial generation, there are several factors that could make it more beneficial for future generations. In this study, there is a relatively small sample size. For future researchers, it would be important to incorporate a larger sample size to determine trends in the data. As well as a large sample size, there should be a wider range in age and ethnic backgrounds. Also, repeated measure tracking the client for a longer amount of time would allow the researchers to discover new data.
In this study, participants came to the clinic and tried to set their PLDs to their real life listening level. In future studies, being able to use the exact setting that they use on a daily basis in a real environment would allow the researchers to get a more realistic listening sample.
Conclusion
In conclusion, users appeared to be able to successfully estimate their own listening intensity. Also, it was revealed that there was a positive relationship between age and intensity. As age increased, the intensity of music increased as well. Overall, average intensity and personal usage suggest that users are not at risk for NIHL when compared to the OSHA standards. However, peak intensities suggest that approximately 40% of participants are potentially at risk for NIHL.
LIST OF REFERENCES
Ahmed, S., Fallah, S., Garrido, B., Gross, A., King, M., Morrish, T., … Pichora-Fuller, K.
(2007). Use of portable audio devices by university students. Canadian Acoustics; Vol 35, No 1 (2007).
American Speech-Language-Hearing Association. Effects of hearing loss on development.
Retrieved January/February, 2015, from
http://asha.org/public/hearing/disorders/effects.htm
Associated Press. (2006, June 8). Survey: iPods more popular than beer. The Washington Post.
Retrieved February 29, 2016, from http://www.washingtonpost.com/wp- dyn/content/article/2006/06/08/AR2006060800455.html
Ballachanda, B. B. (1997). Theoretical and applied external ear acoustics. Theoretical and Applied External Ear Acoustics, 8, 411-420. Retrieved February 4, 2016.
Biassoni, E. C., Serra, M. R., Hinalaf, M., Abraham, M., Pavlik, M., Villalobo, J. P., . . . Righetti, A. (2014). Hearing and loud music exposure in a group of adolescents at the ages of 14-15 and retested at 17-18. Noise & Health, 16(72), 331-341.
Bull, M. (2013). IPod use: an urban aesthetics of sonic ubiquity. Continuum: Journal of Media
& Cultural Studies, 27(4), 495–504.
Chen, B., Seilhamer, R., Bennett, L., Bauer, S. (2015, June 22). Students' Mobile Learning Practices in Higher Education: A Multi-Year Study. Retrieved March 30, 2016, from http://er.educause.edu/articles/2015/6/students-mobile-learning-practices-in-higher- Chung J, Des Roches CM, Meunier J, & Eavey RD. (2005). Evaluation of noise-induced
hearing loss in young people using a web-based survey technique. Pediatrics, 115, 861–
867 7p.
Crandell, C., Mills, T. L., & Gauthier, R. (2004). Knowledge, behaviors, and attitudes about hearing loss and hearing protection among racial/ethnically diverse young adults. Journal of the National Medical Association, 96(2), 176–186.
Dangerous Decibels - A public health partnership for prevention of noise-induced hearing loss and tinnitus. (n.d.). Retrieved January 30, 2016, from http://dangerousdecibels.org/
Danhauer, J. L., Johnson, C. E., Byrd, A., DeGood, L., Meuel, C., Pecile, A., & Koch, L. L.
(2009). Survey of college students on iPod use and hearing health. Journal of the American Academy of Audiology, 20(1), 5–27. http://doi.org/10.3766/jaaa.20.1.2
Danhauer, J. L., Johnson, C. E., Dunne, A. F., Young, M. D., Rotan, S. N., Snelson, T. A., . . . McLain, M. J. (2012). Survey of high school students' perceptions about their iPod use, knowledge of hearing health, and need for education. Language, Speech, and Hearing Services in Schools, 43, 14-35.
Daniel E. (2007). Noise and hearing loss: a review. Journal of School Health, 77(5), 225–231 7p. http://doi.org/10.1111/j.1746-1561.2007.00197.x
Epstein, M., Marozeau, J., & Cleveland, S. (2010, December). Listening habits of iPod users.
Journal of Speech, Language, and Hearing Research, 53, 1472-1477. Retrieved October 2, 2014.
Feder, K., Marro, L., Keith, S. E., & Michaud, D. S. (2013). Audiometric thresholds and portable digital audio player user listening habits. International Journal of Audiology, 52(9), 606-616. Retrieved February 17, 2015.
Fligor, B. J., Levey, S., & Levey, T. (2014). Cultural and demographic factors influencing noise exposure estimates from use of portable listening devices in an urban environment.
Journal of Speech, Language & Hearing Research, 57(4), 1535–1547 13p.
http://doi.org/10.1044/2014_JSLHR-H-12-0420
Gilliver, M., Beach, E. F., & Williams, W. (2013). Noise with attitude: Influences on young people’s decisions to protect their hearing. International Journal of Audiology, 52, S26–
S32.
Haire, M. (2009, July 1). A brief history of the Walkman. TIME Magazine. Retrieved March 28, 2016, from http://content.time.com/time/nation/article/0,8599,1907884,00.html Hodgetts, W., Szarko, R., & Rieger, J. (2009). What is the influence of background noise and
exercise on the listening levels of iPod users? International Journal of Audiology, 48(12), 825-832. Retrieved January 24, 2016.
Hoover A, & Krishnamurti S. (2010). Survey of college students’ MP3 listening: habits, safety issues, attitudes, and education. American Journal of Audiology, 19(1), 73–83 11p.
http://doi.org/1059-0889(2010/08-0036)
Keith, S. E., Michaud, D. S., & Chiu, V. (2008). Evaluating the maximum playback sound levels from portable digital audio players. Journal of the Acoustical Society of America, 123(6), 4227–4237.
Krug, E., Cieza, M. A., Chadha, S., Sminkey, L., Morata, T., Swanepoel, D., . . . Williams, W.
(2015, August). Make listening safe.
Latonero, M. (2000, June). Survey of MP3 usage: Report on a university consumption community. The Norman Lear Center: Exploring Implication of the Convergence of Entertainment, Commerce, and Society, 1-16. Retrieved January 13, 2016, from http://learcenter.org/pdf/mp3.pdf
Levey, S., Levey, T., & Fligor, B. J. (2011). Noise exposure estimates of urban mp3 player users. Journal of Speech, Language & Hearing Research, 54(1), 263–277 15p.
http://doi.org/1092-4388(2010/09-0283)
Levey, S., Fligor, B. J., Ginocchi, C., & Kagimbi, L. (2012). The effects of noise-induced hearing loss on children and young adults. Contemporary Issues in Communication Science & Disorders, 39, 76–83 8p.
Levy, S. (2006). The Perfect Thing: How the iPod shuffles commerce, culture, and coolness.
New York, NY: Simon & Schuster.
WHO's Make Listening Safe Campaign. (2015). Retrieved April 21, 2016, from http://www.asha.org/Buds/Make-Listening-Safe/
McNeill, K., Keith, S. E., Feder, K., Konkle, A. T. M., & Michaud, D. S. (2010). MP3 player listening habits of 17 to 23 year old university students. Journal of the Acoustical Society of America, 128(2), 646–653.
Niskar, A. S., Kieszak, S. M., Esteban, E., Rubin, C., Holmes, A. E., & Brody, D. J. (2001).
Estimated prevalence of noise-induced hearing threshold shifts among children 6 to 19 years of age: The third national health and nutrition examination survey, 1988-1994, United States. Pediatrics, 108(1), 40.
Stein, J. (2013, May 20). Millennials: The me me me generation. TIME Magazine. Retrieved March 28, 2016, from http://time.com/247/millennials-the-me-me-me-generation/
Vogel, I., Brug, J., van der Ploeg, C. P. B., & Raat, H. (2007). Young people’s exposure to loud music: A summary of the literature. American Journal of Preventive Medicine, 33(2), 124–133. http://doi.org/10.1016/j.amepre.2007.03.016
Wittman, R. (2006). Survey of hispanic adults, adults in general, hispanic teens, and teens in general about the use of personal electronic devices with headphones. Zogby
International, 1-37.
APENDICES
APENDIX A-1 SURVEY I. Demographics
1. What is your age in
years? ______________________________________________
2. What is your
gender? Male Female
3. What is your ethnic background?
African American
Asian American
European American
Latin American
Native
American Other 4. What college do you currently
attend? _____________________________________
II. Personal Usage
1. About how many days a week do you usually use a personal music device?
1 2 3 4 5 6 7 never
2. Typically, how long do you use your personal music device during a single session or use?
0-1 hour 1-2 hours 2-3 hours 3-4 hours more than 4 hours
3. On days you use your music device, how many (total) hours do you usually use it (over the entire the day)?
0-1 hour 1-2 hours 2-3 hours 3-4 hours more than 4 hours 4. On a scale of 1-10 how loud would you say that you play the volume:
1 2 3 4 5 6 7 8 9 10
5. How often are you in noisy settings?
Never (0% of the
time)
Seldom (25% of the
time)
About half of the time (50% of the
time)
Usually (75% of the
time)
Always (100% of the
time)
6. You use a listening device to block out noisy environments.
Strongly Agree Agree Disagree Strongly disagree
Never (0% of the
time)
Seldom (25% of the
time)
About half of the time (50% of the
time)
Usually (75% of the
time)
Always (100% of the
time)
8. Rate your hearing on a 1-10 scale below, where 1 equals the worst possible hearing and 10 equals the best possible hearing.
1 2 3 4 5 6 7 8 9 10
III. Personal Knowledge
1. Using a personal music device for long periods of time at loud levels can damage your hearing.
Yes No Possibly I don’t know
2. Using a music device at loud listening levels can damage hearing.
Yes No Possibly I don’t know
3. Hearing loss caused by noise can be prevented.
Yes No Possibly I don’t know
4. Ringing in the ears could be a warning sign for over exposure to potentially hazardous sound.
Yes No Possibly I don’t know
5. Having to turning up the volume on your music device over time could be a sign of hearing loss.
Yes No Possibly I don’t know
6. Are you familiar with volume-limiting (or safe listening) features on your personal music devices?
Yes No
IV. Personal Attitude
1. On a scale from 1-5, how concerned are you about losing your hearing as you age?
1 Not At All Concerned
2 Slightly Concerned
3 Somewhat Concerned
4 Moderately
Concerned
5 Extremely Concerned
2. On a scale from 1-5, how concerned are you that any of the electronic devices you typically use with earphones will cause hearing loss?
1 Not At All Concerned
2 Slightly Concerned
3 Somewhat Concerned
4 Moderately
Concerned
5 Extremely Concerned 3. Do you use volume-limiting (or safe listening) features on your personal music
devices?
Yes No
4. If it were scientifically proven that using music devices at high volume levels for long durations could cause hearing loss, you would change my own device use.
Strongly Agree Agree Disagree Strongly disagree
5. You should turn down the volume on your music device rather than limit the listening time to reduce risk of hearing loss from device use.
Strongly Agree Agree Disagree Strongly disagree
6. Simply listening to music devices less would reduce the risk of hearing loss from use.
Strongly Agree Agree Disagree Strongly disagree
7. Simply turning down the volume on my music device would reduce the risk of hearing loss from device use.
Strongly Agree Agree Disagree Strongly disagree
8. You believe that volume is of _____________ relative to time (or duration) of personal music device use for reducing the risk of hearing loss.
Greater
Importance Equal Importance Lesser Importance
APPENDIX A-2 IRB APPROVAL LETTER