APPLIED STATISTICS
F O R P U B L I C A N D N O N P R O F I T
A D M I N I S T R AT I O N
APPLIED STATISTICS
F O R P U B L I C A N D N O N P R O F I T A D M I N I S T R AT I O N
KENNETH J. MEIER
T E X A S A & M U N I V E R S I T Y
JEFFREY L. BRUDNEY
C L E V E L A N D S TAT E U N I V E R S I T Y
JOHN BOHTE
U N I V E R S I T Y O F W I S C O N S I N - M I LWA U K E E
Australia • Brazil • Canada • Mexico • Singapore • Spain • United Kingdom • United States
to remove content from this title at any time if subsequent rights restrictions require it. For valuable information on pricing, previous editions, changes to current editions, and alternate formats, please visit www.cengage.com/highered to search by ISBN#, author, title, or keyword for materials in your areas of interest.
any means graphic, electronic, or mechanical, including but not limited to photocopying, recording, scanning, digitizing, taping, Web distribution, information networks, or information storage and retrieval systems, except as permitted under Section 107 or 108 of the 1976 United States Copyright Act, without the prior written permission of the publisher.
Library of Congress Control Number: 2010936366 ISBN 13: 978-1-111-34280-7
ISBN 10: 1-111-34280-6
Wadsworth
20 Channel Center Street Boston, MA 02210 USA
Cengage Learning is a leading provider of customized learning solutions with offi ce locations around the globe, including Singapore, the United Kingdom, Australia, Mexico, Brazil and Japan. Locate your local offi ce at international.cengage.com/region
Cengage Learning products are represented in Canada by Nelson Education, Ltd.
For your course and learning solutions, visit www.cengage.com.
Purchase any of our products at your local college store or at our preferred online store www.cengagebrain.com.
and John Bohte
Publisher: Suzanne Jeans Executive Editor: Carolyn Merrill Acquisitions Editor: Edwin Hill Development Editor: Jeff Greene Associate Development Editor:
Kate MacLean
Assistant Editor: Laura Ross Editorial Assistant: Nina Wasserman Marketing Manager: Lydia LeStar Marketing Coordinator: Joshua Wade Hendrick
Marketing Communications Manager:
Heather Baxley
Content Project Management:
PreMediaGlobal Art Director: Linda Helcher Print Buyer: Fola Orekoya Production House/Compositor:
PreMediaGlobal
Senior Rights Acquisitions Specialist (Text):
Katie Huha
Cover Designer: Pier Design Company Cover Image: Nikada/istockphoto
For product information and technology assistance, contact us at Cengage Learning Customer & Sales Support, 1-800-354-9706
For permission to use material from this text or product, submit all requests online at www.cengage.com/permissions.
Further permissions questions can be emailed to [email protected].
Printed in the United States of America 1 2 3 4 5 6 7 14 13 12 11 10
Kenneth J. Meier is the Charles H. Gregory Chair in Liberal Arts and Dis- tinguished Professor of Political Science at Texas A&M University. He is also a professor of public management in the Cardiff School of Business, Cardiff Uni- versity (Wales). He is a former editor of the American Journal of Political Science (1994–1997), a former associate editor of the Journal of Politics (1991–1994), and the Journal of Public Administration Research and Th eory (2000–2009). He served as the president of the Southwest Political Science Association; the Ameri- can Political Science Association sections on State Politics and Policy, Public Policy, and Public Administration; the Public Management Research Associa- tion; and the Midwest Political Science Association. In 2006 he received the John Gaus Award for career contributions to public administration scholarship, and in 2010 he received the Dwight Waldo Award from the American Society for Public Administration for career contributions to the literature. He currently lives with the love of his life, Diane Jones Meier, in Bryan, Texas, and spends his free time comparing the merits of California zinfandels with Australian shirazes.
Jeffrey L. Brudney is the Albert A. Levin Chair of Urban Studies and Public Service at Cleveland State University’s Maxine Goodman Levin College of Urban Aff airs. According to a study published in the Journal of Public Administration Ed- ucation, he ranks tenth in research productivity among scholars worldwide, based on article publication in all refereed journals affi liated with the American Society for Public Administration. Dr. Brudney has received several international honors and awards, including the Herbert Kaufman Award from the Public Administra- tion Section of the American Political Science Association (APSA). In 2006, he received the fi rst-ever Association for Research on Nonprofi t Organizations and Voluntary Action (ARNOVA) Award for Excellence in Teaching; he has also re- ceived the Mentor Award from the APSA Women’s Caucus. Dr. Brudney is the author of Fostering Volunteer Programs in the Public Sector: Planning, Initiating, and Managing Voluntary Activities, for which he received the John Grenzebach Award for Outstanding Research in Philanthropy for Education.
John Bohte is associate professor of political science at the University of Wis- consin–Milwaukee (Ph.D., Texas A&M University). Dr. Bohte enjoys teaching courses on public budgeting, statistics, and state politics.
List of Symbols xix
Preface xxi
Part 1 Foundations of Quantitative Analysis 1 Chapter 1 Statistics and Public and Nonprofi t Administration 3
Chapter 2 Measurement 15
Chapter 3 Research Design 34
Part 2 Descriptive Statistics 59
Chapter 4 Frequency Distributions 61
Chapter 5 Measures of Central Tendency 79
Chapter 6 Measures of Dispersion 97
Part 3 Probability 111
Chapter 7 Introduction to Probability 113
Chapter 8 The Normal Probability Distribution 131 Chapter 9 The Binomial Probability Distribution 151 Chapter 10 Some Special Probability Distributions 162
Part 4 Inferential Statistics 171
Chapter 11 Introduction to Inference 173
Chapter 12 Hypothesis Testing 189
Chapter 13 Estimating Population Proportions 210 Chapter 14 Testing the Diff erence between Two Groups 219 Part 5 Analysis of Nominal and Ordinal Data 241 Chapter 15 Construction and Analysis of Contingency Tables 243 Chapter 16 Aids for the Interpretation of Contingency Tables 264 Chapter 17 Statistical Control Table Analysis 293
Part 6 Regression Analysis 321
Chapter 18 Introduction to Regression Analysis 323 Chapter 19 The Assumptions of Linear Regression 354
Chapter 20 Time Series Analysis 368
Chapter 21 Multiple Regression 392
Chapter 22 Interrupted Time Series: Program and Policy Analysis 424 Chapter 23 Regression Output and Data Management 444 Part 7 Special Topics in Quantitative Management 467 Chapter 24 Performance Measurement Techniques 469
Chapter 25 Decision Theory 495
Annotated Bibliography 518
Statistical Tables 524
Glossary 535 Answers to Odd-Numbered Computational Problems 546
Index 569
List of Symbols xix Preface xxi
Part 1 Foundations of Quantitative Analysis 1
Chapter 1 Statistics and Public and Nonprofi t Administration 3 The Advantages of a Statistical Approach 3 Statistics and Options for Managers 5
The Role of Calculation 6
Academic Standards for Master’s Degree Programs in Public Aff airs and Curricular Guidelines for Nonprofi t
Academic Programs 7
A Road Map for This Book 10
Chapter 2 Measurement 15
Theory of Measurement 16
Measurement Validity 18
Measurement Reliability 19
Increasing Reliability 20
Measuring Reliability 21
Types of Measures 22
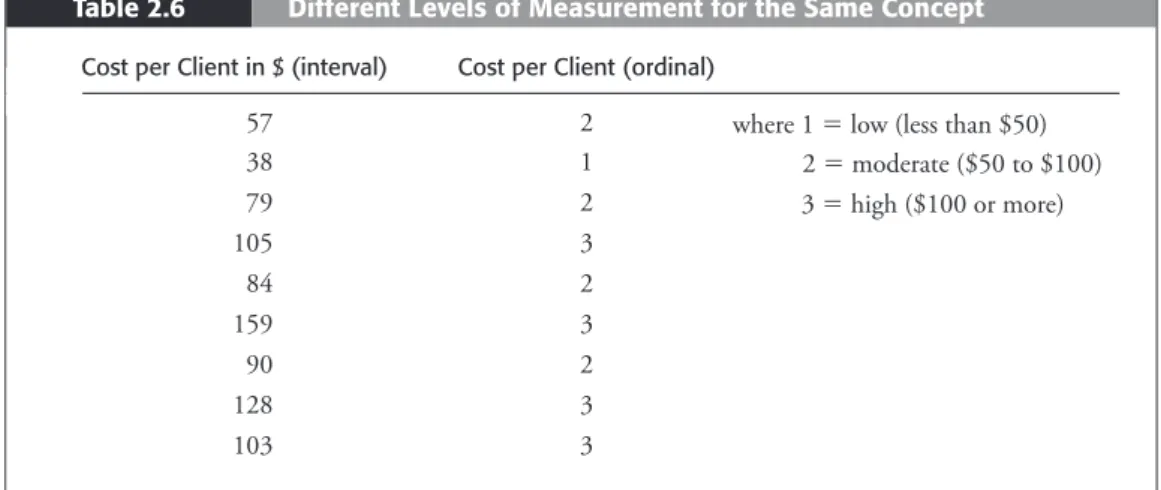
Levels of Measurement 23
The Implications of Selecting a Particular Level
of Measurement 27
Chapter Summary 29
Problems 30
Chapter 3 Research Design 34
Constructing Causal Explanations 36
Causal Relationships 42
Research Design 45
Experimental Designs of Research 47
Internal Validity 47
External Validity 50
Quasi-Experimental Designs of Research 52
Internal Validity 52
External Validity 55
Research Designs and Validity 56
Chapter Summary 57
Problems 57
Part 2 Descriptive Statistics 59
Chapter 4 Frequency Distributions 61
Constructing a Frequency Distribution 62
The Percentage Distribution 64
Cumulative Frequency Distributions 65
Graphical Presentations 67
Chapter Summary 74
Problems 74 Chapter 5 Measures of Central Tendency 79
The Mean 79
The Median 81
The Mode 83
The Mean versus the Median 85
Levels of Measurement and Measures of Central Tendency 86
Hierarchy of Measurement 89
Some Cautions 89
Chapter Summary 91
Problems 92
Chapter 6 Measures of Dispersion 97
The Standard Deviation 98
Shape of a Frequency Distribution and Measures of Central Tendency 101 Using Measures of Dispersion and Central Tendency Together 105
Chapter Summary 105
Problems 106
Part 3 Probability 111
Chapter 7 Introduction to Probability 113
Basic Concepts in Probability 113
An Application to Game Theory 117
Introduction to Probability Logic 120
General Rules of Probability 121
The General Rule of Addition 122
The General Rule of Multiplication 125
Chapter Summary 127
Problems 128 Chapter 8 The Normal Probability Distribution 131 Characteristics of the Normal Distribution 131
z Scores and the Normal Distribution Table 134
Applications to Public and Nonprofi t Management 138
A Measurement Technique Based on Standard Normal Scores 143
Chapter Summary 147
Problems 148 Chapter 9 The Binomial Probability Distribution 151
Binomial Probabilities 151
The Normal Curve and the Binomial Distribution 157
When to Use the Normal Curve 158
Chapter Summary 158
Problems 159 Chapter 10 Some Special Probability Distributions 162 The Hypergeometric Probability Distribution 162
The Poisson Distribution 164
The Exponential Probability Distribution 167
Chapter Summary 167
Problems 168
Part 4 Inferential Statistics 171
Chapter 11 Introduction to Inference 173
Some Defi nitions 173
Estimating a Population Mean 174
Estimating a Population Standard Deviation 175
The Standard Error 177
How Sample Size Aff ects the Standard Error 177
The t Distribution 179
An Example 180
Chapter Summary 182
Problems 182
Chapter 12 Hypothesis Testing 189
Steps in Hypothesis Testing 191
The Importance of Stating the Null and Alternative Hypotheses Correctly 191 Testing Hypotheses with Population Parameters 193
Hypothesis Testing with Samples 194
How Sure Should a Person Be? 196
One- and Two-Tailed Tests 198
Errors 200
Determining Sample Size 201
Chapter Summary 203
Problems 204 Answers to Sample Null and Research Hypotheses 209 Chapter 13 Estimating Population Proportions 210 Estimating a Population Proportion 210 Proportions 212
A Digression 213
Determining Sample Size 213
Decision Making 215
Chapter Summary 216
Problems 216 Chapter 14 Testing the Difference between Two Groups 219
Stating the Research and Null Hypotheses for Diff erence of
Means Tests 219
Diff erence of Means Procedure 221
Understanding the Three Major Diff erence of Means Tests 223 t Test Assuming Independent Samples with Unequal Variances 224 t Test Assuming Independent Samples with Equal Variances 226
t Test Assuming Dependent Samples 228
Proportions 229
Chapter Summary 231
Problems 232
Part 5 Analysis of Nominal and Ordinal Data 241
Chapter 15 Construction and Analysis of Contingency Tables 243
Percentage Distributions 244
Steps in Percentaging 245
Displaying and Interpreting Percentage Distributions 246 Collapsing Percentage Distributions 247
Contingency Table Analysis 249
Constructing Contingency Tables 250 Relationships between Variables 252 Example: Automobile Maintenance in Berrysville 255
Larger Contingency Tables 256
Displaying Contingency Tables 258
Chapter Summary 260
Problems 260 Chapter 16 Aids for the Interpretation of Contingency Tables 264 The Chi-Square Test: Statistical Signifi cance for Contingency Tables 264 Example: Incompetence in the Federal Government? 265 Limitations of the Chi-Square Test 269 Assessing the Strength of a Relationship 270
The Percentage Diff erence 270
Perfect and Null Relationships 272
Measures of Association 275
An Ordinal Measure of Association: Gamma 275 Other Ordinal Measures of Association: Kendall’s tau-b and
tau-c and Somers’s dyx and dxy 278 A Nominal Measure of Association: Lambda 280 A Nominal Measure of Association Based on Chi-Square:
Use of Nominal Measures of Association with Ordinal Data 283
Chapter Summary 284
Problems 285 Chapter 17 Statistical Control Table Analysis 293
Controlling for a Third Variable 295
Example 1: Alcoholism in the Postal Service—The Eff ect of
Hierarchical Position 295
Example 2A: Performance on the Civil Service Examination—
A Case of Favoritism in Blakely? 299 Example 2B: Race, Education, and Complaints—
A Developmental Sequence 304
Example 3: Guaranteed Annual Income—A Case of Interaction 305 Example 4: Support for Performance-Based Pay—Evidence of
Joint Causation 308
Results and Implications of Control Table Analysis 312 Limitations of the Control Table Technique 312
Multivariate Relationships 312
The Source of Control Variables 314
Chapter Summary 314
Problems 315
Part 6 Regression Analysis 321
Chapter 18 Introduction to Regression Analysis 323
Relationships between Variables 324
Ode to Eyeballing 328
Linear Regression 332
Some Applications 335
An Example 336
Measures of Goodness of Fit 337
The Standard Error of the Estimate 338 The Coeffi cient of Determination 341
The Standard Error of the Slope 343
Chapter Summary 345
Problems 346
Answer to Regression Problem 353
Chapter 19 The Assumptions of Linear Regression 354
Assumption 1 355
Assumption 2 356
Assumption 3 357
Assumption 4 358
Assumption 5 362
Chapter Summary 365
Problems 365
Chapter 20 Time Series Analysis 368
Introduction to Time Series 368
Forecasting without Fluctuation 371
Forecasting an Exponential Trend 375
Forecasting with a Short-Term Fluctuation 380
Bivariate Forecasting 382
Chapter Summary 386
Problems 387
Chapter 21 Multiple Regression 392
An Example 393
Calculating Partial Slopes 397
The Logic of Controls 398
A Spurious Relationship 398
A Specifi cation 398
Dummy Variable Regression 399
Regression with Three Independent Variables 400
An Example 400
Calculating Regression Coeffi cients 402
Testing a Hypothesis 402
Two Additional Regression Assumptions 403 Assumption 1: Model Is Specifi ed Correctly 403 Assumption 2: Low Multicollinearity 406
Polynomial Curve Fitting 408
Quadratic Relationships 408
Cubic Regression 411
Chapter Summary 413
Problems 414 Chapter 22 Interrupted Time Series: Program and Policy Analysis 424
Short-Term Impacts 425
Long-Term Impacts 428
Both Short- and Long-Term Eff ects 431
Pulse Eff ects 434
Some Considerations 435
Selecting the Type of Eff ect 435
Choosing the Time Interval 435
Autocorrelation 437
Using Data to Represent Program Changes 438
Controlling for Other Variables 440
Chapter Summary 440
Problems 441 Chapter 23 Regression Output and Data Management 444
Bivariate Regression Output 444
Example 1 444
Example 2 447
Multiple Regression Output 449
Standardized Coeffi cients 450
The F Statistic 451
Time Series and Dummy Variable Regression Output 452
Coeffi cients 453
What to Report when Discussing Regression Output 456
Data Management Issues 456
Managing Data Sets 456
Missing Values 457
The Importance of Examining Descriptive Statistics Prior to
Using More Advanced Statistical Techniques 458 The Range and Other Descriptive Statistics 458 The Importance of Plotting Data before Analysis 459
Chapter Summary 460
Problems 460
Part 7 Special Topics in Quantitative Management 467
Chapter 24 Performance Measurement Techniques 469 Defi ning Inputs, Outputs, and Outcomes 469
Inputs 470
Outputs versus Outcomes 470
Inputs, Outputs, and Effi ciency 472 Outcome Measures from External Sources 473 The Importance of Using Multiple Output and Outcome Measures 473 Techniques for Presenting Performance Data 474
Graphical Presentations 475
Trend Analysis 479
Benchmarking 485
Causality Issues in Explaining Performance 489
Chapter Summary 489
Problems 490
Chapter 25 Decision Theory 495
The Rational Decision-Making Model 495
A Brief Critique 498
Decision Making under Certainty 498
Decision Making under Risk 499
The Value of Perfect Information 503
Decision Making under Risk: Decision Trees 504 Decision Making under Uncertainty 507 Strategy 1: The Bayesian Approach 509 Strategy 2: The Insuffi cient Reason Approach 509 Strategy 3: The Maximin Principle 510
Strategy 4: Minimax Regret 510
Strategy 5: Maximax 511
How to Decide? 511
Game Theory 511
Zero-Sum Games 512
Positive-Sum Games 513
The Prisoner’s Dilemma 514
A Final Comment 515
Chapter Summary 515
Problems 516
Annotated Bibliography 518
Statistical Tables 524
Glossary 535 Answers to Odd-Numbered Computational Problems 546 Index 569
m population mean
s population standard deviation S summation of all listed numbers
P probability
x union of two events y intersection of two events
| conditional probability [for example, P(A|B) means the probability of A given B]
! factorial
Crn combination of n things taken r at a time pr probability p raised to the r-th power EV expected value
X sample mean
s sample standard deviation n size of the sample
N size of the population
l lambda for the Poisson distribution a population regression intercept b population regression slope
a sample regression intercept b sample regression slope Y^ predicted value of Y
e error
s.e. standard error of the mean Sy|x standard error of the estimate
r2 coeffi cient of determination (bivariate)
R2 multiple coeffi cient of determination (multivariate) Adj. R2 adjusted R2 (coeffi cient of determination adjusted for variables with little or no explanatory power) s.e.b standard error of the slope
z standard normal score t t-distribution score
T
he fi rst edition of this book was not the product of years of planning. It was written out of necessity. Assigned to teach a master’s degree course en- titled “Measurement and Analysis for Public Administrators,” the original two authors could fi nd no suitable text. So, we wrote one. Since the initial publi- cation of this book in 1981, a few other textbooks have appeared intended for the“methods” course(s) in master’s of public administration (MPA) degree programs.
With this eighth edition, we believe that Applied Statistics for Public and Nonprofi t Administration still possesses unique advantages for study and practice in this fi eld.
Th e fi rst advantage—long a hallmark of the book—is accessibility. Because MPA students as well as those with an interest in the nonprofi t sector come from disparate backgrounds, their prior exposure to statistics and quantitative methods is generally weak and varies widely. For many MPA students, the last time they took a mathematics course was in high school. For those with an interest in the nonprofi t fi eld, the background tends to be much the same. Given this audience, a rigorous presentation of statistical methods would have proved too threatening, diffi cult, and off -putting. Instead, we wanted a volume that would assume little familiarity with the subject but one that would teach quantitative novices a great deal in very little time. We also wanted to adopt a tone that would invite readers rather than intimidate them.
A second advantage of the book is that it addresses substantive problems il- lustrative of those faced by practicing administrators in the public and nonprofi t sectors. Methods and statistics textbooks in political science and sociology and other disciplines rely predominantly on academic rather than practitioner-oriented exam- ples. Although a number of excellent methods textbooks for business administration are available, they typically focus, understandably, on a diff erent set of issues and problems (for example, manufacturing production, market analysis, etc.) than those that normally concern and activate public and nonprofi t administrators. We wanted a methods-statistics book with examples that would be relevant for this audience.
A third advantage of the book is that it can help institutions of higher learn- ing meet the accreditation standards for master’s degree programs of the Na- tional Association of Schools of Public Aff airs and Administration, or NASPAA.*
In addition, with respect to nonprofit studies, the book can help schools in meeting the Curricular Guidelines for Graduate Study in Nonprofi t Leadership, the Nonprofi t Sector and Philanthropy.** Published by the Nonprofi t Academic
*http://www.naspaa.org/accreditation/standard2009/docs/NS2009FinalVote10.16.2009.pdf
**http://www.naccouncil.org/pdf/GradCG07.pdf
Centers Council, or NACC, which at this writing does not have authority or responsibility to accredit academic programs in nonprofi t studies, the guide- lines are instructive nevertheless in suggesting a solid curriculum in this domain.
Of particular relevance here, Section 16.0 provides guidelines relating to “As- sessment, Evaluation and Decision-Making Methods” in the nonprofi t sector.
Chapter 1 discusses how Applied Statistics for Public and Nonprofi t Administra- tion addresses the standards for curricula in public administration and nonprofi t studies in greater detail.
In preparing this eighth edition, we have again followed these guidelines that animated the original edition and all subsequent editions. In fact, the eighth edi- tion is more faithful to them than the original edition, for in the past quarter century or so we have had the opportunity to use this book—and receive valu- able feedback from a great many students and practitioners—at several major re- search universities, as well as at numerous off -campus locations. Th e new edition benefi ts from this experience and “fi eld testing.”
Over the years since initial publication, a constituency of valued students and colleagues has arisen around Applied Statistics for Public and Nonprofi t Adminis- tration. We are grateful for their guidance and help. Th ey have kindly provided us with comments and suggestions, both positive and negative, but always with an eye toward improving the book for students of public aff airs and nonprofi t ad- ministration. We welcome you to join this group by contacting us either directly or through the publisher, Cengage Learning-Wadsworth (www.cengage.com).
New to This Edition
At the suggestion of the aforementioned group and the reviewers of the previ- ous edition, we have incorporated many changes into the eighth edition. We thank these individuals for their suggestions. Several developments are especially noteworthy.
First, in this eighth edition we have continued to make substantial head- way on a process that schools and departments of public administration and aff airs are also undertaking: incorporating greater recognition and discussion of problems and examples relevant and important to the nonprofi t sector and organizations. More than any other academic unit (such as social work or busi- ness administration), public administration schools and departments offer their students concentrations in nonprofi t management, leadership, or orga- nizations and consequently attract students with these interests. A few uni- versities also have free-standing master’s degree programs in this burgeoning domain of research and practice. We feel that this book should refl ect, as much as possible, emerging trends in public administration and aff airs. Accordingly, we have tried to make the discussion, examples, and problems in this eighth edition more responsive and interesting to students with a background in nonprofi t organizations or aspirations to work in the nonprofi t sector. Our growing appreciation of the elements and processes important to the nonprofi t
sector makes the book more relevant for these students, as well as for MPA stu- dents who will increasingly encounter nonprofi t organizations in their studies and profession.
Th is eighth edition of Applied Statistics for Public and Nonprofi t Administra- tion continues to illustrate the increasing role of the nonprofi t sector in interact- ing and working with the public sector.
Second, as recommended by the reviewers of this edition and by faculty members and students, in this edition we have included more problems at the end of the chapters, including problems pertaining to nonprofi t organizations.
As in previous editions, answers to odd-numbered computational problems ap- pear at the end of the book. In addition, instructors can access answers to all problems, and much other useful material for teaching courses in applied sta- tistics for public and nonprofi t administration, in our Instructor’s Manual. We encourage instructors to contact the publisher, Cengage Learning-Wadsworth, to obtain a copy of the Instructor’s Manual.
Th ird, among the problems at the end of the chapters you will fi nd many more computer-based problems (clearly marked with an icon), again including problems based on practice and experience in the nonprofi t sector. We have also made the relevant datasets available for instructor and student use. We have not tied the book to any particular software because across schools, levels and types of government, and nonprofi t organizations, great variety exists with respect to both computer support and statistical software. We provide datasets for practice and problem solving on your technology.
Fourth, in this eighth edition we have also done more of the things that fac- ulty and students tell us they like about the book. We have incorporated more examples to guide calculation and especially interpretation of statistics for public and nonprofi t managers. We have added more examples to the text and have tried to present them more completely with intermediate steps and answers. Th is edition also includes more fi gures and other graphical displays. Th e summary sections for several chapters have been improved.
Our guiding philosophy continues to be to make the book accessible, practi- cal, and useful, even at the expense of statistical rigor. In their program of study, MPA students and those with an interest in the nonprofi t sector will have plenty of time to pick up that second course in statistics if they are interested. But fi rst they must get through their initial exposure. We wrote this book to assist them in this endeavor. Th e goal of the text is to help students make good sense and good use of data with appropriate statistics, recognize the strengths as well as the limitations of the results obtained, and communicate these fi ndings and insights clearly and persuasively to others.
Toward these ends, the eighth edition maintains the tone, level of presenta- tion, and approach featured in the seven previous editions. We have also updated, corrected, amended, clarifi ed, and elaborated the material as necessary to make it more readable, current, and interesting.
We are grateful to students, colleagues, and reviewers for suggesting many of these changes. We look forward to hearing your ideas.
Teaching Enhancements
A comprehensive Instructor’s Manual (approximately 150 pages) for Applied Statistics for Public and Nonprofi t Administration is available to instructors free from the publisher, Cengage Learning-Wadsworth. Th e Instructor’s Manual presents answers to all problems in the book, as well as much additional valu- able material for teaching. For each chapter the Instructor’s Manual discusses the objectives, major points, and diffi cult points in instruction. It also contains examination questions with fully elaborated solutions.
Cengage Learning-Wadsworth also maintains a Companion Website for the book. Th e Website includes datasets for student exercises and problem solving as well as other useful teaching enhancements. For example, to improve the fl ow of the text, the Linear Programming chapter (Chapter 26) from the seventh edition has been moved to a new home on the Companion Website for the book. Th e material on the Website explains how to access and analyze the data sets provided on a desktop or laptop computer and presents sample problems. Please check the Cengage Learning-Wadsworth Website for the book at http://www.cengage.com/
politicalscience/meier/ for these and other teaching enhancements.
Acknowledgments
A task of this magnitude could not have been accomplished without the assis- tance of others. We are grateful to the many students and colleagues who have kindly given us feedback that informs this eighth edition.
Over the editions of this book, a great many students at Texas A&M Uni- versity, the University of Georgia, Cleveland State University, the University of Oklahoma, Oakland University, and the University of Wisconsin–Milwaukee have provided us with a diverse teaching laboratory. Th ey, too, have off ered com- ments and suggestions that proved helpful in improving this book. We appreciate their tolerance not only for errors that appeared in earlier editions but also for a sense of humor that occasionally goes awry on the printed page. (Otherwise rea- sonable people may disagree over the frequency of the latter occurrence.)
Th anks are due to the reviewers of this eighth edition for their very help- ful comments and suggestions: Kristian Alexander, University of Utah; Nancy Brooks, Cornell University; Matthew Dull, Virginia Tech; Jeff Fine, Clemson University; Deniz Leuenberger, Bridgewater State College; Chris Toppe, George- town University; and Lin Ye, Roosevelt University.
We are also grateful to a lengthy list of colleagues who have reviewed and improved previous editions of the book: William C. Adams, George Washing- ton University; Akpan Akpan, Texas Southern University; Robert Aldinger, Valdosta State University; Nolan J. Argyle, Valdosta State University; George Antunes, University of Houston; Dave Armstrong, University of Wisconsin–
Milwaukee; Charles Barrilleaux, Florida State University; Brady Baybeck, Uni- versity of Missouri–St. Louis; Cindy Bennett-Boland, University of Arkansas;
R. M. Bittick, California State University, Dominguez Hills; Gerald R. Bushee, George Mason University; Gary Copeland, University of Oklahoma; Paul J.
Culhane, Northern Illinois University; Mark Daniels, University of Memphis;
Warren Eller, Texas A&M University; Jody Fitzpatrick, University of Colorado, Colorado Springs; Barry D. Friedman, North Georgia College and State Univer- sity; John Forrester, University of Missouri–Columbia; James F. Guyot, Baruch College–City University of New York; Uk Heo, University of Wisconsin–Mil- waukee; Tom Holbrook, University of Wisconsin–Milwaukee; Steve Percy, Uni- versity of Wisconsin–Milwaukee; John Piskulich, Oakland University; Steven Rhiel, Old Dominion University; Bruce D. Rogers, Tennessee State University;
Arthur Sementelli, Stephen F. Austin State University; Soo Geun Song, West Vir- ginia University; Brian Stipak, Portland State University; Jon R. Taylor, Univer- sity of St. Th omas (Houston, Texas); Meredith Weinstein, North Carolina State University; and Robert Wrinkle, University of Texas, Pan American.
We thank our editor, Lauren Athmer, for her commitment to this book. We are also grateful to the staff of Cengage Learning-Wadsworth. Th e authors thank Corey Jannicelli, Syracuse University, and Alyse Lapish, Cleveland State University, for their excellent assistance in the revision process.
Although we appreciate the help rendered by all of these people, they share none of the blame for any errors of commission or omission. Th at responsibility rests solely with us.
Kenneth J. Meier Texas A&M University Jeff rey L. Brudney Cleveland State University John Bohte University of Wisconsin–Milwaukee
Foundations of Quantitative
Analysis
1
1
The Advantages of a Statistical Approach
S
tatistics have many advantages for the study and practice of public and nonprofi t administration and other disciplines. We can summarize these ad- vantages simply by noting that statistics off er insight into issues and prob- lems in a fi eld that would otherwise go unnoticed and unheeded. Although each book on the subject appraises statistics somewhat diff erently, we can briefl y relate the major advantages of this approach.First, statistics have great power to describe systematically a body of informa- tion or data. No other approach matches the precision and quantifi cation that statistics bring to this task. Statistics can elucidate very precisely the main ten- dencies, as well as the spread of the data about them, in a subset or sample of a population or the population as a whole. Consider the local food pantry, for example. Th e manager would like to know, What is the average number of hours donated by volunteers to the organization in a typical week? On average, how much do the hours donated vary week by week? Or consider the regional offi ce of the department of motor vehicles. Th e director needs to know, How many cli- ents on average seek service in a typical day? By how much does this number vary day to day? Th is information is essential for decision makers. Answering such questions is the descriptive function of statistics.
Second, statistics are very useful for subjecting our intuitive ideas about how a process or phenomenon operates to empirical test. Empirical means observable or based on data. Th is confrontation of informed conjecture and speculation with actual data and observation is called hypothesis testing. A hypothesis is an informed guess or conjecture about an issue or problem of interest—for example, that the increasing involvement of the nonprofi t sector in the delivery of publicly fi nanced services will lead to greater government calls for accountability, or that developing skills in statistics in a master’s of public administration (MPA) program or a con- centration in nonprofi t management will enhance a student’s prospects in the job market upon graduation. Statistics are helpful not only for determining the extent to which the data available support or refute our hypotheses but also for generating the kind of hypotheses that can be tested. Hypotheses should be clear, observable, and falsifi able. Th is perspective expresses the hypothesis-testing function of statistics.
and Nonprofi t
Administration
Th ird, statistics are the foremost method for drawing an accurate inference from a subset or sample of data to its parent, the full population. Rarely does the public or nonprofi t administrator have the luxury of working with the com- plete population; instead, the data available are almost always a sample of obser- vations. For example, the analyst may have a sample of all agency employees, or clients, or audits, or records—whatever the units of analysis might be—and may want to generalize to the entire population. Public and nonprofi t administrators need to know what the sample suggests about the population. For example, the nonprofi t administrator may want to estimate the likely number of fi nancial do- nors in the county based on a random sample of residents. Statistics provide an excellent methodology for drawing this linkage. Th ey allow the analyst to evalu- ate the risk of error when making an inference from sample to population. Th ey also allow us to derive a confi dence band or interval about an estimate that ex- presses the inherent uncertainty in generalizing from a sample of data to the full population. Because we do not have the data from the entire population, we can still make an error in inferring from the sample. Yet statistics are valuable, for they enable the analyst to estimate the probability or extent of this error. Th is function is the essence of statistical inference.
To these classic uses of statistics we can add two others. First, in public and nonprofi t administration, managers face situations and challenges of daunting complexity, such as homelessness, poverty, illiteracy, crime, drug and alcohol dependency, and child and spousal abuse. We entrust to public and nonprofi t managers some of the most diffi cult problems in society. A major advantage of statistics is that they can help the manager keep track of an almost innumer- able collection of measured characteristics or attributes, called variables, at the same time. Statistics allow the manager to manipulate the variables and evaluate the strength of their infl uence on desired outcomes, such as agency performance and citizen satisfaction in the public sector, or success in obtaining grant funding and retaining volunteers in the nonprofi t sector. Th e ability to examine a large number of variables simultaneously—and to sort out and make sense of the com- plicated relationships among them—is a great advantage of statistical methods for dealing with highly complex situations.
Second, an appreciation of statistics can help the public and the nonprofi t manager become a much more discerning consumer of quantitative information.
Like it or not, managers in all sectors are bombarded with “facts” or assertions based on statistical analysis. Th ere is no escape from them. Th ey appear regularly in myriad sources, including reports, evaluations, memoranda, briefi ngs, hear- ings, press releases, newspaper accounts, electronic communications, books, aca- demic journals, and many other outlets. Public and nonprofi t managers need the skills to evaluate the confl icting claims and representations often made and to avoid being misled. Statistics off er major benefi ts in this area. Perhaps this reason is the best one of all for the study and application of statistics in public and non- profi t administration.
As refl ected in the MPA curriculum, statistics are certainly not all there is to know about public or nonprofi t organizations and management. One must
acquire or hone additional skills as well as develop a general understanding of broader political, legal, economic, and social forces. But statistics, too, have a rightful place in the program of study for the MPA, as well as in academic con- centrations and degree programs in nonprofi t organizations and management.
Statistics and Options for Managers
For these reasons, statistics and quantitative analysis have become a major ele- ment of public and nonprofi t management. Agencies that only a few years ago made decisions based on seat-of-the-pants guesses and convenient assumptions now routinely use computer printouts, contingency tables, regression analyses, decision trees, and other statistical techniques to help understand complex situa- tions and make decisions. Human resources managers receive personnel projections to schedule recruitment eff orts. Transportation planners rely on complex computer simulations to design urban transportation systems. Budget offi cers and accoun- tants scour economic projections and analyses. Program evaluators are charged with making quantitative assessments of a program’s eff ectiveness. Nonprofi t managers weigh the benefi ts against the costs of hiring a fund-raising fi rm. Th ey compare volunteer recruitment and turnover rates by age and education level. Th ey distrib- ute surveys to donors and potential donors to learn about them and inspire further giving. Quantitative analyses have become so prevalent that no midlevel manager in the public or nonprofi t sector can—or should—hope to avoid them.
Th e increasing sophistication of quantitative techniques aff ords public and nonprofi t managers few options. At one extreme, a manager untutored in these methods can act as if they did not exist and refuse to read reports containing statistics. Unfortunately, this option is exercised all too often and at considerable cost: Th e public or nonprofi t manager loses valuable information presented in quantitative form. Th is option is not acceptable.
At the other extreme, public and nonprofi t managers may choose to accept, uncritically, the fi ndings of the data analyst rather than to reveal to others an ig- norance of statistics. Th is option leads to an error as serious as the fi rst. Although quantitative analysts will almost certainly possess a stronger background in statis- tics than does the manager (that’s their job), the analysts lack the experience and management skills—and the responsibility—to make the decisions. Th ose deci- sions rest with public and nonprofi t managers, based on the best statistical (and other) advice available. Th is book is intended for students who consider public or nonprofi t management and analysis their present or future occupation.
The third option open to the manager—and the one favored by the authors—is to receive training in quantitative techniques. Th e training advocated and off ered in this book, however, is not a standard course in statistics, which often remains a required (and dreaded) element of most MPA programs and increas- ingly of nonprofi t degree programs. Instead, we seek to develop appreciation for and intuitive understanding of basic elements of statistics and quantitative analysis for managers in the public and nonprofi t sectors.
Reading this book and working the problems at the end of the chapters will not transform public and nonprofi t managers from quantitative novices into master statisticians. Such a transformation is neither desired nor necessary. By and large, public and nonprofi t managers do not set up research designs and select and calculate appropriate statistical measures. Far more often, they receive information of this kind and are expected to make reasoned and responsible deci- sions based on it. For this task, a course in mathematical statistics is not required.
However, it is essential that managers become intelligent and critical consumers of quantitative information. Toward that end, this book stresses the application, interpretation, and evaluation of basic statistics.
Th is book is intended primarily for students who have no or only a very limited knowledge of, or background in, mathematics, statistics, or other quan- titative methods. Material is presented in an applied, nonrigorous, easily read- able format centered on practical problems of public and nonprofi t management.
Th e text is designed to engage readers in the discussion of these problems and to encourage students to seek and understand numerical or statistical answers to them. Often we present a step-by-step approach to the various techniques to build confi dence and mastery. Statistical theory is discussed only rarely, and the computational formulas that pepper most statistics books are reserved for those instances in which they enlighten rather than mystify.
We have elaborated on some of the advantages of our approach, and we hope that they will become evident as you read and use the book and work the examples and problems presented (highly recommended!). However, we would be remiss were we to overlook the book’s shortcomings. Th e most obvious is that this is not a comprehensive text in formal statistics. As noted before, the book is not rigorous, and we have ignored and probably violated many elements of standard statistical theory. Whereas this approach may arouse the disapproval of some professional colleagues, we believe that it has its place—as an introduction to statistics for managers in the public and nonprofi t sectors. Too often, students are alienated by more formal courses that emphasize precision over application, and a fi rst course in statistics becomes an eminently disliked and forgettable last one. We have endeavored to develop a text that will engage and hold the interest of public and nonprofi t sector managers and at the same time present fundamen- tal applied statistics—and, perhaps, whet the appetite for further training in this area. For those who seek a more mathematical and theoretical approach to mana- gerial statistics, several good books are available (see the Annotated Bibliography at the end of the text).
The Role of Calculation
Whenever possible in this book, we have provided step-by-step instructions for performing statistical procedures and evaluating the results. We strongly recom- mend that you do these calculations and follow along. Statistics is not a spectator sport: You learn by doing.
But, you may be wondering, with laptop and desktop computer programs featuring an entire repertoire of statistics seemingly available at the push of a button or the click of a computer mouse, why worry about calculating statistics?
Why go to the trouble?
Our answer is that, precisely because statistics have become so immediately accessible, it is all the more important to see how they are derived and computed.
We know of no better way to understand the various statistics, their advantages and limitations, their assumptions and anomalies, than to experiment with a few observations or data points, make the appropriate calculations, and observe what values of the statistic are generated in return. Whatever the strengths or peculiari- ties of the statistic, they will soon become apparent to you.
Given the profusion of user-friendly statistical package programs loaded onto laptop and desktop computers, however, many students and managers in the public and nonprofi t sectors are becoming exposed to them through a dif- ferent mechanism: Instead of learning about the statistics beforehand, they may plunge into using them because they are readily accessible on their microcomput- ers, but they may not readily understand them. We do not want to discourage healthy curiosity or interest in statistics; nurturing it is diffi cult enough. But, in eff ect, these students and managers practice a tempting statistical version of the popular television quiz show Jeopardy; for those who aren’t aware, in this quiz show contestants are given the answer but must state the question (instead of the reverse—fun, huh?). For instance, you can easily obtain “the regression” (answer) on the computer, but what is it, how should you interpret it, and why, are ques- tions that require prior study for appropriate application and use. In this book we address the important questions before explaining the answers.
With statistical package programs increasingly loaded onto computers, students untrained in quantitative techniques can easily generate the statistical
“answers” on their computer monitor at the click of a computer mouse—but then can only guess at the question, use, or purpose behind those answers. In our judgment, these students have not learned statistics for public and nonprofi t managers; they have acquired a potentially useful computer skill. Th ere is a big diff erence. In this book, we emphasize building knowledge of the former.
Academic Standards for Master’s Degree Programs in Public Affairs and Curricular Guidelines for Nonprofi t Academic Programs
If we have still not persuaded you of the advantages—or at least the need—for learning and using applied statistics in public administration, nonprofi t admin- istration, and allied fi elds, we can off er you one more reason: the accreditation standards in the field. The National Association of Schools of Public Affairs and Administration (NASPAA) has formulated standards for accreditation of
master’s degree programs in public affairs, policy, and administration. Many p ublic administration programs also off er concentrations or certifi cates in non- profi t a dministration and include pertinent courses in the curriculum. In fact, across all disciplines public administration schools and departments most often provide courses and concentrations in nonprofi t management education.
NASPAA adopted revised Standards for Accreditation for Master’s Degree Programs in 2009.* Under NASPAA Standard 5, “Matching Operations with the Mission: Student Learning,” section 5.1,“Universal Required Competencies,”
states that an MPA program, “As the basis for its curriculum … will adopt a set of required competencies related to its mission and public service values” in fi ve domains. Th e domains encompass the ability to:
Lead and manage in public governance;
•
Participate in and contribute to the policy process;
•
Analyze, synthesize, think critically, solve problems, and make decisions;
•
Articulate and apply a public service perspective;
•
Communicate and interact productively with a diverse and changing
•
workforce and citizenry.
Th e chapters and material presented in this book are intended especially to raise the ability of students in public administration to “analyze, synthesize, think critically, solve problems, and make decisions.” Increasing and honing this ability, in turn, will contribute to the other four required NAPAA competencies of leading and managing in governance, participating and contributing in the policy process, articulating and applying a public service perspective, and communicating and in- teracting with the workforce and citizenry. Th is book will help to create and refi ne the ability of students in public and nonprofi t administration to synthesize infor- mation, understand and perform crucial data analysis and interpret the results, and support problem solving and decision making that underlie sound and eff ective practice in the other domains specifi ed by NASPAA in its accreditation standards.
Although it does not yet have authority or responsibility to accredit aca- demic programs in nonprofi t studies, the Nonprofi t Academic Centers Council (NACC) published revised Curricular Guidelines for Graduate Study in Non- profi t Leadership, the Nonprofi t Sector and Philanthropy in 2007.** Section 16.0 treats “Assessment, Evaluation and Decision-Making Methods” and includes three guidelines for nonprofi t academic programs to meet in this area:
Methods and modes to evaluate performance and eff ectiveness at both
•
organizational and programmatic levels;
Decision-making models and methods and how to apply them in non-
•
profi t organizational settings; and
Th e use and application of both quantitative and qualitative data for pur-
•
poses of strengthening nonprofi t organizations, the nonprofi t sector, and society at large.
* http://www.naspaa.org/accreditation/standard2009/docs/ NS2009FinalVote10.16.2009.pdf.
** http://www.naccouncil.org/pdf/GradCG07.pdf
Just as is the case with the NASPAA Standards for Accreditation in public aff airs and administration with regard to the standard to “analyze, synthesize, think critically, solve problems, and make decisions,” this book provides thor- ough, accessible coverage for students in nonprofi t administration of NACC Curricular Guidelines in the area of “Assessment, Evaluation and Decision- Making Methods.”
Th is book can form the basis for courses (and/or coverage) that satisfy the NASPAA Accreditation Standards and the NACC Curricular Guidelines relat- ing to quantitative techniques of analysis and requisite skills in program evalu- ation, information synthesis, decision making, and problem solving. Th e book elaborates statistical methods as a tool for assisting public and nonprofi t manag- ers in making decisions. By focusing on the assumptions underlying the various techniques, the careful interpretation of results, and the limitations as well as the strengths of the information conveyed, the text stresses the ethical and eff ective utilization of statistics and quantitative analysis.
With respect to the competencies identifi ed by NASPAA and NACC, Part I of the book addresses “Foundations of Quantitative Analysis.” Th e chapters in this section set out the rationale for a statistical approach in public and nonprofi t administration and provide essential background in measurement and research design. Th e chapters are strong in the methodology of research and treat a wide range of issues, including problem diagnosis, the logic of inquiry, causal infer- ence, and threats to the validity of a quantitative study.
Part II, “Descriptive Statistics,” introduces basic statistical analysis. Th e chap- ters here are also useful for acquainting students with the presentation and inter- pretation of statistical charts, graphs, and tables to inform themselves as well as other decision makers.
Part III, “Probability,” explores the many uses of this tool in public and non- profi t management. Th e chapters in this section assist students in defi ning and diagnosing decision situations and selecting and evaluating a course of action.
Th e chapters in Part IV, “Inferential Statistics,” not only develop sophisti- cated analytic skills but also help in the defi nition of problems, formulation of alternatives, choice of decision, and evaluation of results. Th ey help the manager to understand the promise—and the limitations—of a sample of data for reach- ing conclusions about the entire population.
Part V, “Analysis of Nominal and Ordinal Data,” introduces another set of quantitative skills useful for the public and nonprofi t administrator. Th is type of analysis is employed frequently in written memoranda and technical reports and in the evaluation of survey data. Th ese data distinguish public administration and nonprofi t administration (and other social science fi elds) from the natural, physical, and biological sciences, in which measurement is typically much more precise.
Part VI presents “Regression Analysis.” Regression is one of the most fl exible and often utilized statistical techniques in the social sciences. Th e chapters in this section greatly enhance the decision-making, analytic, and evaluative capabilities of public and nonprofi t managers. Th e fi rst fi ve chapters in this section discuss the methods of regression analysis and the varied applications of regression-based
techniques in public and nonprofi t management. Th e last chapter in this section explains how to read and interpret regression output generated by statistical soft- ware packages, which is often complicated and diffi cult to understand. Th e chapter, thus, provides a needed skill that is too often overlooked.
Th e fi nal part of the book discusses “Special Topics in Quantitative Man- agement”: performance measurement and decision theory. A full treatment of linear programming can be found on the companion Website for the book. Th ese materials expose students to techniques for measuring organizational perfor- mance, diff erent models of logical analysis, bases for decisions, and evaluation of alternatives. In sum, this book provides essential coverage pertaining to the NASPAA Standards for Accreditation in public aff airs in administration and the NACC Curricular Guidelines for Nonprofi t Administration.
A Road Map for This Book
Th is book is designed so that each of its parts is self-contained yet builds on the other parts.
Part I lays the foundations for the use of statistics and quantitative analysis in public and nonprofi t administration. Chapter 1 explains why statistics have become important to this enterprise and Chapter 2 elaborates measuring criti- cal concepts in these fi elds. Th e chapter shows that measurement of key concepts such as organizational eff ectiveness, job satisfaction, volunteer competence for a task, and public trust in an agency can be diffi cult but is necessary. Chapter 2 also provides twin evaluative criteria for assessing measurement: reliability and validity.
Chapter 3 explains how to model or depict a problem or issue of importance (for example, service delivery by a public or nonprofi t agency) and to follow up with a systematic study based on data. Th e chapter examines diff erent research plans, called research designs, that direct how and when data are to be collected, analyzed, and interpreted to answer questions about topics of interest, such as how to improve service delivery, recruit volunteers more eff ectively, integrate the work of paid and nonpaid (volunteer) human resources, or redesign public orga- nizations. Th e topics considered in the chapter provide an essential foundation for understanding the uses, advantages, and limitations of the statistics presented in the other chapters of the book.
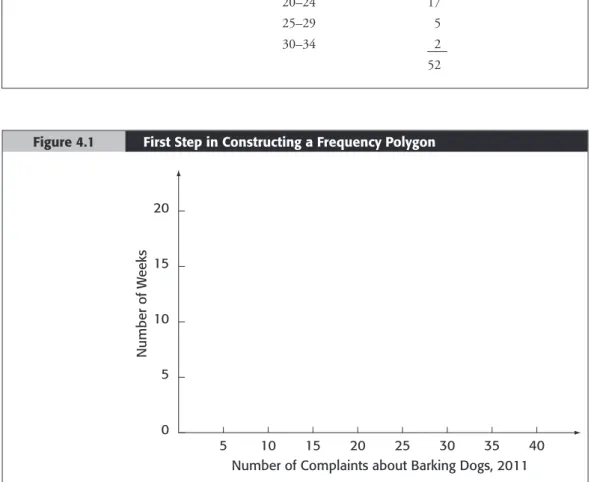
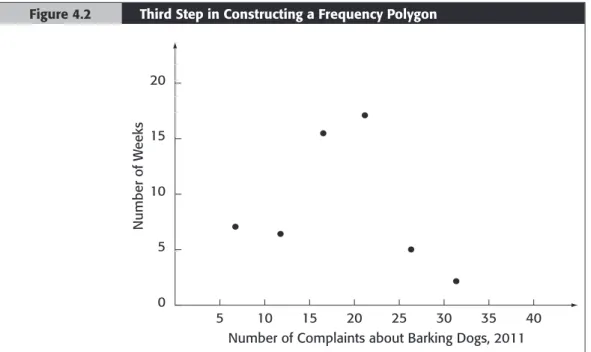
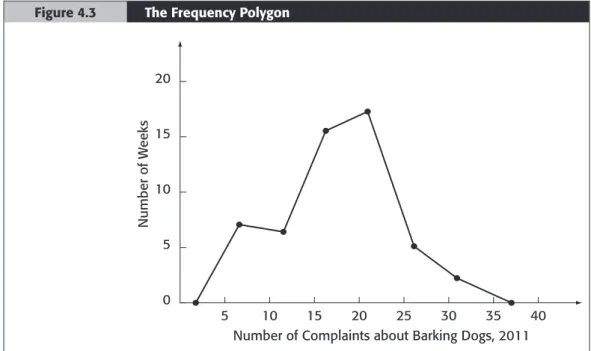
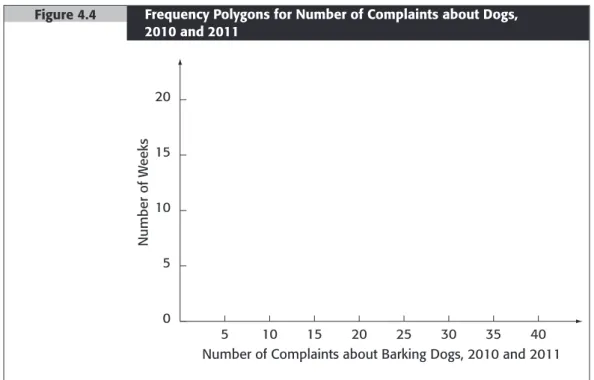
Part II covers basic descriptive statistics. Th is part of the book is devoted to the analysis of one variable at a time, or univariate statistics. Chapter 4, “Fre- quency Distributions,” begins this discussion with a treatment of how to cat- egorize and display a large volume of data, or a (frequency) distribution, in a graphical format, such as a table, chart, or graph, and how to work with percent- ages. Th e chapter following, “Measures of Central Tendency,” is concerned with fi nding and interpreting the average in a distribution of data: You may be famil- iar with the main measures of central tendency, the mean, median, and mode.
Th e chapter shows how to calculate these statistics both for data that have been
arranged in a table or chart and for data that have not, which we aff ectionately term “raw data.” Once you have calculated or read the average for a group or distribution of data, the next question to ask is how closely the data cluster or spread about this average—that is, whether the observed values or observations are relatively concentrated or dispersed about the measure of central tendency.
Chapter 6, “Measures of Dispersion,” introduces the two major statistics for mea- suring dispersion in a sample of data: the variance and its close relative, the stan- dard deviation. It also discusses the range and other statistics.
Th e next part of the book addresses probability. Probability can be confusing for students to understand; do not become discouraged! To learn the basic rules and applications of probability, please see Chapter 7, which presents an introduc- tion to the topic. In that chapter, you will learn the basic law of probability as well as what is meant by a priori probabilities, posterior probabilities, joint prob- abilities, and conditional probabilities. With this background, the remaining chap- ters on probability will be much easier to follow.
Chapter 8 presents the most common probability distribution, the normal curve. Th e familiar bell-shaped curve has numerous uses and applications in pub- lic and nonprofi t administration. When data follow a normal distribution, it is practical and easy (OK, maybe not easy, but surely within your reach) to deter- mine the percentage of job applicants who fall above or below a criterion score on a test of job-related skills. Or you can fi nd the score that distinguishes the top 5% of applicants for further consideration (for example, those applicants for whom a follow-up interview is warranted).
Have you ever wanted to know the probability that an agency could hire 3 minorities for 10 positions when 50% of the job applicants were minorities?
For problems similar to this one, Chapter 9 introduces the binomial probability distribution. Th e chapter also shows how the normal distribution can be applied to simplify complex binomial problems, provided certain conditions are met. Th e chapter following discusses other useful probability distributions for public and nonprofi t managers. Th e hypergeometric probability distribution is used when the manager wants to make a generalization from a sample to a fi nite population.
Th e Poisson and the exponential probability distributions are used whenever the manager needs to include time or distance in a probability statement—for example, 1.2 computer failures per day or 15 potholes per 100 meters.
Part IV explores statistical inference and focuses on the issue of how the man- ager can generalize (infer) results from a small sample of data to the much larger population from which the sample was drawn. Th is technique is useful in its own right and also to support advanced statistical procedures presented later in the book, such as regression analysis. Because the public or nonprofi t manager must work almost always with a sample rather than the full population of data—but seeks reliable information about the entire population—knowledge of statistical inference is essential. To learn how to estimate the value of the mean or average for a population from a sample of data, consult Chapter 11. Th is chapter also discusses procedures for constructing confi dence bands or intervals around the mean estimate.
Chapter 12 applies the techniques of statistical inference to testing hypoth- eses. Although it is not possible to avoid the risk of error in inferring from a sample of data to the population (we cannot be sure of results if we do not have population information), public or nonprofi t managers may be willing to take an acceptable risk in drawing an inference. Th e chapter shows how, by using the techniques of classical hypothesis testing on a small sample of data, the manager can make a decision regarding the full population—for example, that the average number of times the population of agency clients seeks assistance is four times or more per year, or that the average is less—at the risk of error of, say, 5%. You will thus learn a technique that in the long run will allow you to make the correct decision 95% of the time but be in error the remaining 5% (remember, because we do not know the “answers” in the population, we cannot be right all the time).
Chapter 13 shows how to estimate population proportions, rather than mean or average values, from a sample—for example, the proportion (or percentage) of motorists in a county who drive faster than 65 miles per hour on a stretch of highway. For those situations in which the manager needs to compare the per- formance or characteristics of two groups (for example, experimental and control groups, groups before and after the implementation of a program or interven- tion or treatment, and so forth), Chapter 14 explains how to test for diff erences between groups using the statistical technique called analysis of variance.
Beginning with Part V, the remainder of the book deals with relationships between two or more variables. Th e study of relationships between two variables is called bivariate analysis. Bivariate statistical techniques can help to answer myriad research and practical questions: Is agency budget related to performance? Do police patrols reduce crime? Does greater inclusiveness in government hiring lead to a more responsive bureaucracy? Does government contracting with nonprofi t organizations produce more effi cient delivery of services? Do employees in non- profi t organizations display greater job motivation than those in other sectors of the economy? Do smaller nonprofi t organizations adapt more quickly to their environ- ments than larger ones? Is there a relationship between delegating decision-making authority to lower levels of the organization and innovativeness of employees?
Part V explains how to construct tables and analyze data at the nominal and ordinal levels of measurement—that is, information measured in terms of catego- ries (for example, gender) or rating scales (for example, attitude toward balancing the federal budget, or clients’ evaluations of the training provided by a volunteer center). Chapter 15 shows how to use percentages to analyze and interpret tables called contingency tables or cross-tabulations that pair data from two nominal or ordinal variables. Chapter 16 builds on this foundation to provide more sophis- ticated techniques for analyzing tables, including statistical inference (chi-square) and measures of association (gamma, lambda, and so forth). Chapter 17 dis- cusses statistical control table analysis, a procedure for examining the relationship between two variables while taking into account or “controlling for” or “holding constant” a third variable. Th e analysis of three or more variables simultaneously presented in this chapter introduces multivariate analysis, a topic covered more extensively in later chapters of the text.
Part VI is concerned with relationships between variables assessed on equal interval scales, or “interval” data, such as variables measured in years, dollars, or miles. Chapter 18 begins the discussion with an “Introduction to Regression Analysis,” a highly fl exible and often used statistical technique that is helpful in a variety of managerial situations in the public and nonprofi t sectors. Th e chapter shows how a line or linear relationship depicted in a graph or set of coordinate axes can summarize the relationship between two interval variables—for instance, the relationship between the number of intake workers at a government facility and the number of clients who receive service in a given day. Chapter 19 explains the assumptions and limitations of regression analysis. Estimating and predicting trends in the future based on past data is the subject of Chapter 20 on time series analysis. Consult this chapter to forecast such trends as future population, the number of people likely to volunteer to government agencies, service usage, sew- age output, the number of organizations that will participate in the community walk-a-thon to raise cancer awareness, and other over-time information impor- tant to public and nonprofi t managers.
Chapter 21, “Multiple Regression,” extends this technique to the multivari- ate context: It shows how to use regression to analyze and understand relation- ships among three or more variables. For example, how well can the average age of housing and the percentage of renter-occupied buildings in a neighborhood explain or predict the incidence of fi res across a city? To what extent do the num- ber of volunteers working in nonprofi t agencies and the number of community events sponsored by these organizations aff ect the amount of money collected in their annual fund-raising campaigns?
Chapter 22, on interrupted time series analysis, explains how to estimate the impact of a program or policy over time. Th e manager can use this technique to evaluate whether a program, such as a senior citizens’ center or a municipal vol- unteer offi ce, has had a short-term, long-term, or short-term temporary impact (or perhaps no impact) on the health and welfare of city residents.
Chapter 23 focuses on the interpretation of regression output—that is, out- put generated by statistical software packages. Th e earlier chapters in this sec- tion (Chapters 18–22) present a variety of regression examples in equation form to illustrate how relationships between variables can be summarized using linear equations. Statistical software packages generally do not present regression results in equation form, however, which can make the leap from textbook to computer applications and printout confusing. Although it is p