Introduction
1.1 Glass Formation
Glass is a liquid that has lost its ability to flow, although structurally, the two states are indistinguishable. Upon cooling to temperatures below its melting point, a liquid can solidify as a crystal or form a glass. Thermodynamically, a periodic crystal has lower energy compared to glass. However, in some cases, the liquid atoms can easily assemble into non-crystalline packing modes, especially when the time available to form a periodic structure becomes a factor. A liquid cooled below its melting point does not crystallize spontaneously because of an activation barrier to nucleation which arises from the competition between volume and interfacial free energies. The level of undercooling depends on the height of the activation barrier. Figure 1.1 schematically shows the cooling curves for three different levels of undercooling. In case (a), the liquid undercools a little until nucleation is triggered and the liquid is raised to the melting temperature. This is followed by isothermal crystallization until all of the liquid is transformed into crystal. In case (b), the liquid is hypercooled, i.e., the amount of heat released is not enough to raise the sample to the melting temperature from such a deeply undercooled state. In the extreme case as shown by curve (c), the liquid bypasses crystallization completely and passes through glass transition, at which point it falls out of equilibrium and becomes solid-like. The glass transition temperature is not a constant
of the material, but rather is a function of experimental conditions. The slower the cooling rate, the lower will be the value of the glass transition temperature [1].
At the melting temperature, the first derivatives of the Gibbs free energy (such as volume, entropy, and enthalpy) are discontinuous. At the glass transition temperature, these thermodynamic variables are continuous but exhibit a change in slope, so there is discontinuity in their derivatives. These derivative quantities are defined as other important thermodynamic variables such as thermal expansion coefficient (α=∂lnV/∂T) and specific heat (Cp=∂H/∂T). The specific volume and specific heat as a function of temperature are shown schematically in Figure 1.2. If crystallization is suppressed, the liquid volume decreases until the atoms are frozen into position during glass transition.
The thermal contraction of the glass is almost the same as the crystal because atomic rearrangement similar to the liquid cannot take place. Therefore the thermal expansion coefficients of the glass and the crystal are similar and smaller in value compared to the liquid as shown in Figure 1.2 (a). The specific heat of the undercooled liquid rapidly decreases from liquid-like values to crystal-like values. This abrupt change in specific heat as shown in Figure 1.2 (b) is regarded by most people as the signature of glass transition. Understanding the properties of undercooled liquid is key to understanding the glass formation process, recognized as one of the most challenging unsolved problems in solid state theory [2].
650 750 850 950 1050 1150 1250 1350
0 10 20 30 40 50 60 70
Time (s)
Temperature (K)
Figure 1.1: Cooling curves showing (a) undercooling followed by isothermal crystallization, (b) hypercooling, and (c) vitrification. The melting and glass transition temperatures are shown by the dotted lines.
(a)
(c) (b)
Melting temperature
Glass transition temperature
Figure 1.2: Dependence of (a) specific volume and (b) specific heat on temperature in the liquid, crystal and glass states.
Crystal Glass
Undercooled liquid
Liquid
Tm Tg
Specific Volume
Temperature
Crystal Glass
Undercooled Liquid
Tm Tg
Specific Heat
Temperature (a)
(b)
1.2 Bulk Metallic Glasses
Turnbull demonstrated in the 1950s that deep undercooling could be achieved in a number of pure metals if heterogeneous nucleation is avoided [3]. In 1960, Klement, Willens, and Duwez [4] at Caltech first reported the vitrification of a binary metallic alloy by rapid quenching technique with a cooling rate of the order of 106 K/s. In the early 1970s, Chen and co-workers [5] used suction-casting techniques to form millimeter- diameter amorphous rods of Pd-Cu-Si with cooling rates of the order of 103 K/s. These are considered to be the first examples of bulk metallic glasses (BMGs). In the early 1990s, Inoue and his coworkers [6] found bulk glass forming compositions near deep eutectics in a number of systems such as La-Ni-Al, Mg-Cu-Y and Zr-Cu-Ni-Al. These alloy systems have critical cooling rates of 100 K/s. Building on the work of Inoue, Peker and Johnson [7] at Caltech discovered exceptional bulk glass formers in the Zr-Ti-Cu-Ni- Be system. A particular alloy in this system with composition Zr41.2Ti13.8Cu12.5Ni10Be22.5
(Vit1) has a critical cooling rate of 1 K/s and has been extensively studied [7]. This alloy can be cast by conventional casting methods in the form of fully amorphous rods of diameter 5 to 10 cm, making it an attractive candidate for many structural applications.
Other zirconium based bulk metallic glasses have been found recently in the Zr-Ti(Nb)- Cu-Ni-Al by Lin and Johnson [8]. Two notable compositions in these systems are Zr57Cu15.4Ni12.6Al10Nb5 (Vit106) and Zr52.5Cu17.9Ni14.6Al10Ti5 (Vit105), which can be cast as glassy ingots 1 cm thick. Structural applications of amorphous alloys were rather
limited until the development of bulk metallic glasses by Johnson at Caltech [7] and Inoue at Tohoku University [6].
Bulk metallic glasses have unique mechanical properties such as high strength, high elastic strain limit, and superior corrosion resistance which make them interesting as engineering materials [9]. Vit1 shows a tensile strength of 1.9 GPa, an elastic strain limit of 2% and plain strain fracture toughness, K1C, in the range of 20 to 55 MPa m1/2 [9]. The strength of the glassy alloys versus the elastic limit compared to other structural materials is shown in Figure 1.3. Since the elastic-strain limit of the metallic glasses exceeds 2%, the maximum stored elastic energy density is much more than useful crystalline metals.
This property makes metallic glasses suitable for a number of applications in sporting equipment such as baseball bats and golf clubs, to name a few [9]. Bulk metallic glasses are also useful as kinetic energy penetrators due to their “self-sharpening” behavior.
Important limiting factors of BMGs in structural applications are their limited plasticity and tendency for shear localization. Plastic deformation in crystalline materials is achieved by the movement of dislocations that have definite slip systems. However, the lack of slip systems or other plastic deformation mechanisms in amorphous systems make them susceptible to shear localization and catastrophic failure. To overcome this problem, research efforts have been directed to the fabrication of metallic-glass composites. A variety of composite materials have been fabricated by direct introduction of a reinforcing crystalline solid into a glass forming melt [10,11] as well as by nucleation of an in situ ductile phase in an amorphous matrix [12,13]. These composites show much higher toughness and ductility compared to the monolithic BMGs [10-13].
0 500 1000 1500 2000 2500
0 1 2 3
Elastic limit (%)
St re ngt h ( M P a )
Figure 1.3: Strength versus elastic limit of glassy alloys compared to other structural materials.
Glassy alloys Steels
Titanium alloys
Silica
Wood Polymers
1.3 Motivation and Objectives
The search for new and improved bulk metallic glass (BMG) forming alloys continues at an ever-increasing pace as more engineering applications are identified for this novel class of materials. To aid in this search, much effort has been directed towards understanding the correlations between the thermophysical properties of these complex multi-component systems and their glass forming ability (GFA). Earlier studies involving simple binary alloys (e.g., Au-Si [4]) which required very high cooling rates (105-106 K/s) to form glass, have paved the way for higher order systems with exceptional glass forming ability, that can be vitrified by cooling rates of the order of 1 K/s [6-9]. Earlier, Turnbull [14] predicted that the ratio of glass transition temperature to the melting temperature of a good glass former should be around 2/3, and this has led to the search of glass forming compositions close to deep eutectics. However, identification of comprehensive predictive indicators of glass forming ability based on thermodynamic and kinetic studies will greatly aid in the systematic search for new glass forming compositions.
The exceptional stability against crystallization of bulk glass forming melts has provided a unique opportunity to study their thermophysical properties in the deeply undercooled state. Some of the thermodynamic and kinetic studies that have been done in the past include specific heat [15-17], Gibbs free energy difference between liquid and crystal [17-19], viscosity [1,20,21], atomic diffusion coefficient [20,22], and specific volume [23,24]. However, most of these studies are limited to the temperature range
glass forming systems consist of highly reactive elements such as Ni, Ti and Zr which limit the applicability of conventional measurement techniques [25]. Therefore, no systematic study involving high temperature thermophysical properties has been carried out to date. Nonetheless, comparative studies of thermophysical properties at high- temperatures for a wide spectrum of glass formers is of utmost importance in assessing the glass forming trend of existing BMGs, as well as for developing new alloy systems.
The glass forming ability of a BMG is quantified by the critical cooling rate to bypass crystallization upon cooling from the stable melt. This can be measured from the time-temperature-transformation (TTT) curve of the alloy which describes the transformation kinetics from undercooled liquid to crystal in an isothermal experiment.
The TTT curves for two of the best known bulk metallic glass formers, Zr41.2Ti13.8Cu12.5Ni10Be22.5 (Vit1) [26] and Pd43Ni10Cu27P20 [27], have been obtained earlier. Though these studies provided remarkable insights into their crystallization behavior, no attempts have been made to correlate the thermophysical properties with the crystallization time scales. Such studies would require the simultaneous measurement of TTT curves and thermophysical properties for a number of BMGs. Moreover, it is critical to identify the heterogeneous influences on TTT curves to understand the intrinsic crystallization behavior and optimize processing conditions. There are only a limited number of studies in this regard.
High vacuum containerless measurement techniques are ideal for investigating TTT curves and thermophysical properties of BMGs, particularly at high temperatures because there is no risk of reaction with container walls. However, there are only a
limited number of studies [23,26] involving bulk metallic glasses that have been carried out utilizing the unique advantages of containerless techniques. Deep undercooling of the melt can be achieved by containerless processing because heterogeneous nucleation induced by container walls or environment can be eliminated altogether. In particular, the high vacuum electrostatic levitation (HVESL) technique developed by Rhim et al. [28]
has several advantages over other containerless measurement methods. The principles behind the working of the electrostatic levitator and its advantages are discussed in detail in chapter 2 of this thesis.
The main objectives of this thesis are identification of reliable predictive indicators of glass forming ability based on measurement of thermophysical properties at high temperatures, and the study of intrinsic crystallization behavior of bulk metallic glasses using the electrostatic levitation technique. The study of thermophysical properties includes the measurement and characterization of both kinetic and thermodynamic quantities that affect glass forming ability. To probe the intrinsic crystallization behavior, it is necessary to identify and eliminate the heterogeneous influences on crystallization. The BMGs are chosen from a wide spectrum consisting of very good glass formers as well as poor glass formers.
1.4 Thesis Overview and Key Contributions
The kinetic properties, thermodynamic properties, and intrinsic crystallization behavior for a number of bulk metallic amorphous alloys having widely different glass forming abilities are investigated in this thesis. The measurements are carried out using
effects from container walls or environment. The principles behind the working of the electrostatic levitator, its advantages, and the noncontact diagnostic techniques are discussed in chapter 2.
The trends in glass formation among five bulk metallic glass forming alloys are investigated within the framework of their measured kinetic and thermodynamic properties which are discussed in chapter 3. The melting temperature viscosity, fragility parameter, and volume change upon crystallization are identified as reliable indicators of glass forming ability based on the study of kinetic properties. The surface tensions of these alloys are measured for the first time and are found in most cases to follow proportional mathematical addition of the surface tension of pure components. The experimentally measured entropies of fusion for a wide range of glass formers show that thermodynamic driving force may not be significant in determining the glass forming ability of these alloys. The specific heat and total hemispherical emissivity obtained from the free radiative cooling curve and sample volume measurement are also discussed.
A pronounced influence of overheating is observed on the undercooling behavior and crystallization time scales of bulk metallic glasses. This overheating effect and its influence on Time-Temperature-Transformation (TTT) curves of the glass forming alloys are discussed in chapter 4. A threshold overheating temperature is found for each alloy, above which there is a drastic increase in the undercooling level and the crystallization times. TTT diagrams are measured for the alloys by overheating above their respective threshold temperatures and are found to be very similar in shape, suggesting that system- specific properties do not play a crucial role in defining crystallization kinetics in these
alloys. The possible mechanisms behind this are also discussed in chapter 4. These TTT curves are important from a practical standpoint because they provide the time- temperature window for commercial processing.
The Time-Temperature-Transformation (TTT) diagrams for novel ternary Zr-Al- Co bulk metallic glasses are measured for the first time over a wide temperature range between their glass transition and melting temperatures, and are discussed in chapter 5.
Change in crystallization behavior due to the addition of a small amount of Cu is also investigated. To assist in understanding the crystallization pathways, X-ray diffraction studies are carried out for the alloys after isothermal crystallization at different undercooling levels.
Chapter 6 deals with quantitative correlation between crystal-melt interfacial tension, melt viscosity, and glass forming ability. The TTT diagrams for three alloys are analyzed within the framework of nucleation theory and the crystal-melt interfacial tensions are obtained by fitting of the TTT curves. These alloys are chosen because of their widely different glass forming abilities but otherwise similar properties. The times for crystallization in these alloys are found to scale with the melt viscosities. The influence of icosahedral short-range order of the undercooled liquid on viscosity and interfacial tension are discussed.
The crystallization behavior, microstructure, specific volume, and viscosity of an in situ ductile phase reinforced amorphous matrix composite are investigated as a function of the processing temperature and compared with a monolithic BMG in chapter 7. Based on the experimental results, an optimum processing route is suggested.
1.5 References
[1] R. Busch, E. Bakke, and W. L. Johnson, Acta Mater. 46, 4725 (1998).
[2] P. W. Anderson, Science 267, 1615 (1995).
[3] D. Turnbull and R. E. Cech, J. Appl. Phys. 21, 804 (1950).
[4] W. Clement, R. H. Willens, and P. Duwez, Nature 187, 869 (1960).
[5] H. S. Chen and D. Turnbull, Acta Metall. 17, 1021 (1969).
[6] A. Inoue, T. Zhang, and T. Masumoto, Mater. Trans. JIM 31, 177 (1990).
[7] A. Peker and W. L. Johnson, Appl. Phys. Lett. 63, 2342 (1993).
[8] X. H. Lin and W. L. Johnson, J. Appl. Phys. 78, 6514 (1995).
[9] W. L. Johnson, MRS Bulletin 10, 42 (1999).
[10] H. C.-Yim and W. L. Johnson, Appl. Phys. Lett. 71, 3808 (1997).
[11] R. D. Conner, R. B. Dandliker, and W. L. Johnson, Acta Mater. 46, 6089 (1998).
[12] C. C. Hays, C. P. Kim, and W. L. Johnson, Phys. Rev. Lett. 84, 2901 (2000).
[13] C. P. Kim, Ph.D. Thesis, California Institute of Technology (2001).
[14] D. Turnbull, Contemp. Phys. 473, 10 (1969).
[15] R. Busch and W. L. Johnson, Appl. Phys. Lett. 72, 2695 (1998).
[16] I.-R. Lu, G. Wilde, G. P. Gorler, and R. Willnecker, J. Non-Cryst. Solids 250-252, 577 (1999).
[17] Z. P. Lu, X. Hu, and Y. Li, Intermetallics 8, 477 (2000).
[18] S. C. Glade, R. Busch, D. S. Lee, W. L. Johnson, R. K. Wunderlich, and H. J. Fecht, J. Appl. Phys. 87, 7242 (2000).
[19] R. Busch, Y. J. Kim, and W. L. Johnson, J. Appl. Phys. 77, 4039 (1995).
[20] A. Masuhr, T. A. Waniuk, R. Busch, and W. L. Johnson, Phys. Rev. Lett. 82, 2290 (1999).
[21] Y. Kawamura and A. Inoue, Appl. Phys. Lett. 77, 1114 (2000).
[22] U. Geyer, S. Schneider, W. L. Johnson, Y. Qiu, T. A. Tombrello, and M. P. Macht, Phys. Rev. Lett. 75, 2364 (1995).
[23] K. Ohsaka, S. K. Chung, W. K. Rhim, A. Peker, D. Scruggs, and W. L. Johnson, Appl. Phys. Lett. 70, 726 (1997).
[24] I. R. Lu, G. P. Gorler, and R. Willnecker, Appl. Phys. Lett. 80, 4534 (2002).
[25] T. Iida and R. I. L. Guthrie, The Physical Properties of Liquid Metals (Clarendon, Oxford; 1988).
[26] Y. J. Kim, R. Busch, W. L. Johnson, A. J. Rulison, and W. K. Rhim, Appl. Phys.
Lett. 68, 1057 (1996).
[27] J. Schroers, Y. Wu, R. Busch, and W. L. Johnson, Acta Mater. 49, 2773 (2001).
[28] W. K. Rhim, S. K. Chung, D. Barber, K. F. Man, G. Gutt, A. Rulison, and R. E.
Spjut, Rev. Sci. Instrum. 64, 2961 (1993).
Experimental Approach: Electrostatic Levitator and Noncontact Diagnostic Techniques
2.1 Introduction
Investigation of liquid thermophysical properties by containerless measurement techniques enables the observation of intrinsic behavior because of the removal of the disturbing influences of container walls and impurities. Numerous types of levitators have been developed [1] which include acoustic [2], aero-acoustic [3], electromagnetic [4], electrodynamic [5], and electrostatic levitators [6], each having its own unique capabilities. In particular, the high-vacuum electrostatic levitation (HVESL) technique developed by Rhim et al. [6] has several advantages over other containerless measurement methods: (i) sample heating and levitation are decoupled, thus allowing the sample temperature to be varied over a wide range; (ii) the feedback control provides quiescent sample positioning; and (iii) there is no severe distortion of the liquid drop as is common in electromagnetic levitation, thus allowing accurate volume measurement. The HVESL can be employed for obtaining viscosity and surface tension of the melt simultaneously using the drop oscillation technique, described later in detail. By this technique, both the surface tension and viscosity can be obtained from a single transient signal, thereby eliminating uncertainties introduced from different measurement techniques. Also, a single axisymmetric mode can be excited in an almost spherical
sample, making the data analysis unambiguous. Because all of the heating sources can be blocked without affecting sample levitation, the specific heat over total hemispherical emissivity can be obtained from the free radiative cooling curve and volume of the sample.
In this investigation, the electrostatic levitation technique was used for the measurement and characterization of crystallization behavior and thermophysical properties of bulk metallic glasses. The unique advantages of this technique outlined above allowed the measurements to be carried out in the deep undercooled liquid state.
Moreover, this enabled the probing of intrinsic behavior because there was no risk of contamination or chemical reaction. The principles, hardware, and the diagnostic techniques involved in this method are discussed in the following sections.
2.2 Levitation Principles and Hardware
In High Vacuum Electrostatic Levitator (HVESL) [6], a sample (sphere ~ 2 mm diameter) is levitated between a pair of parallel-disk electrodes spaced about 10 mm apart. According to Earnshaw’s theorem [7], there is no three-dimensional electrostatic potential minimum. So in an electrostatic levitator, the sample is positioned through active feedback-controlled electrostatic fields that are generated using properly positioned electrodes. A schematic diagram of the High Vacuum Electrostatic Levitator is shown in Figure 2.1. The electrode assembly is housed in a stainless steel vacuum chamber which is evacuated to 10-8 torr. The vacuum system used to achieve this high level of vacuum consists of a roughing diaphragm pump, a turbo-molecular pump, and a
the three-dimensional position information that is used by a computer to generate the feedback signal. The schematic of the electrode assembly is shown in Figure 2.2. The assembly consists of a top electrode, a bottom electrode and two pairs of side electrodes.
The top and bottom electrodes provide vertical positioning, while the side electrodes are placed orthogonally for lateral positioning of the sample. The bottom electrode is connected to a high voltage amplifier which generates an oscillating electric field to induce drop oscillation for viscosity and surface tension measurement.
Three sample-charging methods are employed for electrostatic positioning of the sample: capacitive, photoelectric and thermionic. Capacitive charging is used for launching the sample by increasing the top electrode potential until the electrical contact of the sample with the bottom electrode is broken. A 1 kW UV-rich xenon arc lamp provides initial photoelectric charging and heating. This is followed by heating with a continuous wave (CW) Nd-YAG laser operating at 1.064 µm with maximum output power of 200 W. By splitting the YAG laser beam into four beams of equal intensity in a tetrahedral arrangement, the temperature gradient in the sample is greatly reduced (Figure 2.2). The maximum temperature difference on the sample surface for the four-beam configuration is estimated to be less than 1K for a sample temperature of around 1000 K.
At close to the melting temperature, thermionic emission from the sample becomes the dominant charging mechanism and the desired temperature is achieved by using just the YAG laser while the xenon lamp is completely turned off. The temperature is measured remotely using a two-color pyrometer with a nominal sensitivity range of 650-1650 K. A detailed description of the ESL facility is given in an earlier publication [6].
Figure 2.1: Schematic diagram of the High Vacuum Electrostatic Levitator (HVESL) showing the different components.
Nd-YAG Laser
He-Ne Laser (rotation) Illumination Lamp
Position Detector He-Ne Laser
He-Ne Laser
To Vacuum Pyrometer
Xe Lamp
Position Detector
Telephoto CCD Camera
Wide view CCD Camera
Figure 2.2: Schematic diagram of the electrode assembly showing tetrahedral laser heating arrangement. The top and bottom electrodes control the sample position along the vertical direction, while the two orthogonal side electrodes around the top electrode control the sample position in the horizontal directions. The bottom electrode is connected to a high-voltage amplifier which generates an oscillating electric field to induce drop oscillation.
Laser beam
Side electrode Side electrode
Top electrode
Bottom electrode
To H.V. amplifier
AC HV amplifier
2.3 Noncontact Diagnostic Techniques to Measure Thermophysical Properties
2.3.1 Specific Volume Measurement by Image Capture and Digitization
The sample images are captured by a charge coupled device (CCD) video camera with a telescopic head. The sample image for one of the alloys is shown in Figure 2.3.
The edge points of the sample images are fitted with Legendre polynomials through sixth order. Finally the sample volumes are obtained by calibrating with stainless steel spheres of known volume. The specific volume (VSP) and thermal expansion coefficient (α) are calculated from the known sample mass (M) and volume (V) as:
M
VSP = V (2.1)
T V V ∂
= 1 ∂
α . (2.2)
A UV-rich halogen lamp for background illumination and a UV-passing filter placed before the camera reduce the camera blooming effect at high temperatures. The detailed volume measurement technique is described elsewhere [8].
2.3.2 Viscosity and Surface Tension Measurement by Drop Oscillation Technique To measure the viscosity and surface tension, drop oscillations are induced by applying alternating current (AC) voltage to the bottom electrode. The electrode assembly, being axially symmetric, can effectively excite n=2 mode. The levitated drop is backlit by a collimated laser beam, and a photodetector with a narrow slit placed before it
consisting of a given number of sine-wave cycles is applied at the resonant frequency of the drop and the ensuing transient signal is recorded. A typical transient signal obtained by such a process is shown in Figure 2.4. The high-pass filtered data in the time domain along with the Fast Fourier Transform (FFT) based spectrum are used for analysis. The data are assumed to follow the function:
(
π φ)
τ +
= Ae− ft
y t/ sin 2 , (2.3)
where A is the amplitude, t is the time, τ is the decay time constant, f is the resonant frequency, and φ is a constant phase factor. The decay time and frequency are obtained by fitting the signal with this equation.
Viscosity (η) of the liquid drop is calculated from the decay time constant (τ) of free oscillation that follows the excitation pulse and is given as [9,10]:
τ η ρ
5 r2
= , (2.4)
where, ρ is the density and r is the radius of the spherical drop. Surface tension (σ) of the oscillating liquid drop is calculated from its resonant oscillation frequency (ω=2πf) [11]:
8
3 2ρr
σ =ω , (2.5)
where, ρ is the density and r is the radius of the liquid drop. This value of surface tension is corrected to take into account the charge distribution on the sample surface and the non-sphericity in sample shape [10]. A detailed description of the viscosity and surface tension measurement technique is given elsewhere [10].
Figure 2.3: A typical side view of a levitated molten sample from which the specific volume is extracted by Legendre polynomial fitting.
Figure 2.4: Typical transient oscillation of a levitated drop. The signal is fitted with a function which is the product of a decaying exponential and a sinusoidal wave.
)
/τsin(ω +φ
=Ae− t
y t
2.3.3 Specific Heat and Total Hemispherical Emissivity
In the ESL, heating and levitation are decoupled. Therefore, when all the heating sources are blocked, the sample cools from high temperature in a purely radiative way following the heat transfer equation:
) ( 4 S4
T SB
P AT T
dt C dT M
m =−σ ε − , (2.6)
where m is the sample mass, M is the molecular weight, CP is the constant pressure specific heat, T is the sample temperature, TS is the ambient temperature, σSB is the Stefan-Boltzmann constant (5.6705 × 10⁻⁸ W·m-2·K-4), A is the surface area of the sample, and εT is the total hemispherical emissivity. This can be rewritten as:
dt dT M
m T T A
C SB S
T
P =−σ ( 4 − 4)
ε . (2.7)
Since all the parameters on the right hand side of the equation can be determined from temperature and volume measurements, CP/εT can be obtained. This equation is the basis for determining the specific heat by the ESL technique if the total hemispherical emissivity is known, and vice-versa [12].
2.3.4 Measurement of Time-Temperature-Transformation Curves
To investigate crystallization behavior, samples are levitated and melted using a Nd-YAG laser. For undercooling experiments, the samples are allowed to free cool in vacuum from the molten state by turning off the laser. Free cooling vitrifies some of the good glass formers. However, the poor glass formers crystallize at a certain level of
undercooling as observed by recalescence - the sharp rise in temperature due to the release of the latent heat of fusion. Isothermal experiments are performed to determine the TTT diagram. The molten sample is cooled to a predetermined temperature by turning off the laser which is subsequently turned back on at a preset power to maintain an isothermal temperature. Figure 2.5 shows a cooling curve obtained by free radiative cooling of a sample in the ESL. There is no heat release event during the entire cooling process and the sample vitrifies. The schedule of constructing a TTT diagram is also shown in Figure 2.5. Prior to each isothermal measurement, the alloy is subjected to melting and radiative cooling to ensure proper fluxing. The overheating has a pronounced influence on the undercooling behavior and crystallization time scales [13]. The TTT curve gives a summary of time for crystallization after isothermal annealing at different temperatures. The starting of the isothermal anneal time at each temperature is used as the time origin (t=0) for the TTT curves. The temperature is monitored using a two-color pyrometer. The temperature fluctuations are within ±2 K during the isothermal treatment for the TTT curve measurement.
650 750 850 950 1050 1150 1250 1350
0 10 20 30 40 50 60 70
Time (s)
Temperature (K)
Figure 2.5: Free radiative cooling in the ESL showing glass formation. The schedules for isothermal measurements to determine a TTT diagram are shown by arrows in the plot.
Melting temperature
Glass transition temperature
2.4 References
[1] E. H. Brandt, Science 243, 349 (1989).
[2] Y. Tian, R. G. Holt, and R. E. Apfel, Rev. Sci. Instrum. 66, 3349 (1995).
[3] J. K. R. Weber, D. S. Hampton, D. R. Merkley, C. A. Rey, M. M. Zatarski, and P. C.
Nordine, Rev. Sci. Instrum. 65, 456 (1994).
[4] J. Szekely, E. Schwartz, and R. Hyers, J. Metals 47, 50 (1995).
[5] Aerosol Measurement, edited by K. Willeke and P. A. Baron (Van Nostrand Reinhold, New York, 1993).
[6] W. K. Rhim, S. K. Chung, D. Barber, K. F. Man, G. Gutt, A. Rulison, and R. E. Spjut, Rev. Sci. Instrum. 64, 2961 (1993).
[7] S. A. Stratton, Electromagnetic Theory, McGraw-Hill, New York, 1941.
[8] S. K. Chung, D. B. Thiessen, and W. K. Rhim, Rev. Sci. Instrum. 67, 3175 (1996).
[9] H. Lamb, Hydrodynamics, 6th ed., Cambridge University Press, Cambridge, 1932.
[10] W. K. Rhim, K. Ohsaka, P.-F. Paradis, and R. E. Spjut, Rev. Sci. Instrum. 70, 2796 (1999).
[11] J. W. S. Rayleigh, Phil. Mag. 14, 184 (1882).
[12] A. J. Rulison, and W. K. Rhim, Rev. Sci. Instrum. 65, 695 (1994).
[13] S. Mukherjee, Z. Zhou, J. Schroers, W. L. Johnson, and W. K. Rhim, Appl. Phys.
Lett. 84, 5010 (2004).
Influence of Kinetic and Thermodynamic Properties on Glass Forming Ability
Abstract
The trends in glass formation among bulk metallic glass forming alloys of widely differing glass forming abilities are investigated within the framework of their measured kinetic and thermodynamic properties. The kinetic properties, viscosity and free volume, are found to have the most definite influence on their glass forming ability. On the other hand the thermodynamics do not play a major role. The glass forming melts show orders of magnitude higher viscosity compared to pure metals. Among the glass forming alloys, the better glass former has higher melting-temperature viscosity, higher fragility, and shows a smaller change in volume upon crystallization compared to a poorer glass former. The experimentally measured entropies of fusion for a wide range of glass- formers are almost similar, indicating that thermodynamic driving force may not be significant in determining the glass-forming ability of these alloys. The other measured thermophysical properties, surface tension and specific heat, do not show any strong correlation with glass forming ability.
Keywords: Bulk metallic glass; Viscosity; Specific volume; Free Volume; Surface tension; Specific heat; Entropy of fusion
3.1 Introduction
The kinetic properties that are important in the study of metallic glasses include specific volume and viscosity. The study of volume change of the atoms, as well as the associated unoccupied free volume with temperature, is of utmost importance because a small variation in the free volume can induce large changes in the flow behavior [1].
Measurement of specific volume for alloys and comparison with an ideal mixture of the constituents gives an indication of the nature of interaction between the constituent elements. Viscosity is a kinetic parameter that describes the time scale for structural rearrangement of the liquid atoms in an undercooled state to form a crystal nucleus. Thus, viscosity determines the crystallization kinetics of an undercooled melt and has special significance in the study of glass forming systems. Moreover, study of the strong-fragile behavior [2] of bulk metallic glass (BMG) melts is critical in understanding the factors affecting glass forming ability. Although viscosity data close to the glass transition region exists for quite a few BMGs, only a limited amount of data is available for the high temperature region. Viscosity data around the melting temperature of a BMG is much more difficult to obtain because these glass forming systems consist of highly reactive elements such as Ni, Ti and Zr that limit the applicability of conventional methods.
Sophisticated custom-made equipment [3,4], as well as levitation experiments [5], were used to explore the viscosity in the region around the melting temperature. Because of limited viscosity data close to the melting point, no systematic study involving high temperature viscosity has been reported for BMGs with different glass forming ability
and specific volume are important for optimization of processing conditions such as in casting and composite infiltration.
Surface tension is another important thermophysical property that is vital in understanding the nature of liquids. While viscosity portrays the bulk characteristics of the melt, surface tension gives information about the surface. Particularly, the surface tension of alloys is vital for studying segregation effects and the extent of Marangoni flow which is important for diffusion studies [6]. A number of phenomenological models have been proposed to estimate the surface tension for liquid metals from their viscosity.
Reasonable agreement has been found with experiments for pure metals [7]. These models have been used to estimate the surface tension of alloys where they could not be measured directly [8] without testing the validity of extending them to multi-component systems. These estimates for multi-component systems may be misleading, and this necessitates the experimental determination of reliable surface tension data for alloys and investigation of their correlation with viscosity. Although surface tension data for pure metals is available in the literature [7], they are scarce for binary alloys, and in the case of complex glass forming systems, a nearly complete lack of data is evident.
Knowledge of specific heat is required for quantitative evaluation of the thermodynamic driving force for crystallization. Thus it has special significance in the study of glass forming systems. The driving force for crystallization can be approximated by the Gibbs free energy difference (∆G) between the supercooled liquid and crystal. ∆G can be calculated from the enthalpy of fusion and the difference in specific heat (∆CP) between the supercooled liquid and crystal.
In this chapter, the influences of kinetic and thermodynamic properties on glass forming ability are investigated. For this purpose, five bulk amorphous alloys with widely differing glass forming abilities were chosen. The kinetic properties studied are viscosity and specific volume. The glass forming alloys are classified according to their strong- fragile behavior [2] of viscosity. The correlations between surface tension and viscosity of bulk metallic glasses are explored and compared with pure metals. To investigate the thermodynamics, specific heat and entropy of fusion are measured and their role in the glass formation process is discussed. All of the measurements are made using the electrostatic levitation technique to avoid heterogeneous influences of containers.
3.2 Experimental Details
In this study, alloy systems were chosen that have widely differing glass forming abilities. This makes them suitable for a comparative study and helps in identifying the influence of thermophysical properties on their glass forming ability. The alloys investigated in order of decreasing glass forming ability are: Zr41.2Ti13.8Cu12.5Ni10Be22.5
(Vit1), Zr57Cu15.4Ni12.6Al10Nb5 (Vit106), Zr55Al20Co25 (ZrAlCo), Zr52.5Cu17.9Ni14.6Al10Ti5
(Vit105), and Ni59.5Nb40.5 eutectic alloy (NiNb). The samples were prepared from high purity starting materials in an arc-melter. The glass transition temperatures (Tg), and the liquidus temperatures (TL) were obtained for the alloys by heating with a rate of 0.33 Ks-1 in a Differential Scanning Calorimeter (DSC). The Tg, TL, and Tg/TL values for the alloys investigated in this study are summarized in Table 3.1.
BMG Tg (K) TL (K) Tg/TL ∆T/TL (%) Rc (K s-1)
Vit1 620 993 0.624 Vitrified 2*
Vit106 682 1115 0.612 Vitrified 10*
ZrAlCo 753 1323 0.569 Vitrified 17*
Vit105 675 1090 0.619 21 25#
NiNb 920 1448 0.635 9 250#
* Measured from TTT curve
# Estimated from the critical casting thickness to form fully amorphous plates
Typical free radiative cooling curves obtained for the five alloys are shown in Figure 3.1. Vit1, Vit106, and ZrAlCo could be vitrified by free cooling in the ESL, while Vit105 and NiNb eutectic alloy crystallized after a certain degree of undercooling. The maximum undercooling achieved for Vit105 was 230 K, and that for the NiNb eutectic alloy was 130 K. The maximum undercooling as a percentage of the liquidus temperature (∆T/TL) and the critical cooling rates to vitrify (Rc) the samples are shown in Table 3.1.
The critical cooling rates vary more than two orders of magnitude for the five alloys, indicating their widely differing glass forming abilities. Vit1 is the best glass former and NiNb is the worst among the five alloys investigated. The critical cooling rates for Vit1, Vit106, and ZrAlCo were measured from their respective time-temperature- transformation (TTT) curves [9,10] and will be discussed later, while those of Vit105 and NiNb were estimated from critical casting thickness to form fully amorphous plates [11,12]. The details of measurement techniques for the different thermophysical properties are discussed in chapter 2. The trends in glass formation are analyzed within the framework of the measured thermophysical properties.
700 900 1100 1300 1500
0 10 20 30 40 50 60
Time (s)
Temperature (K)
Vit1, Vit106, ZrAlCo Vit105
NiNb
Figure 3.1: Free radiative cooling curves for Vit1, Vit106, ZrAlCo, Vit105, and NiNb.
Vit1, Vit106, and ZrAlCo could be vitrified by free radiative cooling in the ESL.
However, Vit105 and NiNb crystallized after certain undercooling.
3.3 Results and Discussion
3.3.1 Specific volume
The simultaneously measured specific volume and cooling curve for one of the alloys, Vit105, are shown in Figure 3.2. On the temperature-time curve, crystallization is evidenced by recalescence - the sharp rise in temperature due to the release of the latent heat of fusion. However, at this large undercooling, the heat released during recalescence is insufficient to raise the sample to the melting temperature. On the volume-time curve, crystallization is evidenced by the discontinuous decreases in the sample volume. The noise level in the volume data for the crystal is about twice that of the liquid due to slight deformation of the sample upon crystallization. The liquid and crystal specific volumes can be extracted separately and plotted as a function of temperature. For alloys that vitrified upon free radiative cooling, crystalline specific volume was measured after the sample was crystallized entirely by heating it up from glass transition temperature.
The liquid and crystal specific volumes plotted as a function of temperature are shown in Figure 3.3 for one of the alloys (ZrAlCo) that could be vitrified by free radiative cooling in the ESL. The measurement accuracy as shown for ZrAlCo is representative of the results for all other alloys obtained in this study. The measurement accuracy of liquid specific volume is estimated to be within ± 0.1% and of the crystal, is about twice that. The specific volume V(T) at a temperature T is fit with an equation of the form:
)]
( 1 [ )
(T Vm T Tm
V = +α − (3.1)
where α is the volume expansion coefficient, Tm is the melting (or liquidus) temperature and Vm is the specific volume at the melting (or liquidus) temperature. The liquid and crystalline specific volumes at the liquidus temperatures (VLiqm, VCrym) and the volume expansion coefficients (αLiq, αCry) for the five alloys are summarized in Table 3.2. The volume change of the liquid upon crystallization expressed as a percentage of the crystal volume (∆Vm/VCrym) at the liquidus temperature is shown in the last column of Table 3.2.
Table 3.2: Specific volume and thermal expansion coefficient BMG VLiqm (cm3 g-1) αLiq
(10-5 K-1) VCrym (cm3 g-1) αCry
(10-5 K-1) ∆Vm/VCrym
(%)
Vit1 0.1668 5.334 0.1650 4.52 1.09 Vit106 0.1502 5.329 0.1468 3.29 2.32 ZrAlCo 0.1672 5.790 0.1637 3.06 2.14
Vit105 0.1559 5.846 0.1525 4.06 2.23 NiNb 0.1199 6.812 0.116 --- 3.36
The specific volume data in Table 3.2 show that the best glass former (Vit1) has the smallest change in volume (1.09%) upon crystallization, while the worst glass former (Ni59.5Nb40.5) has the largest volume change (3.36%). Recently, Shen et al [13] reported a similar trend during crystallization of amorphous alloys in the Pd-Ni-Cu-P system upon heating in the supercooled liquid region. They found that alloys having the smallest density difference between amorphous and crystalline states revealed the largest supercooled liquid region [13] and larger supercooled liquid regions correlate with better GFA. This implies that the denser the packing of atoms in the glass compared to the corresponding crystal, the better the glass forming ability which is in fact, the trend we observe in this study.
800 900 1000 1100 1200 1300 1400
0 10 20 30 40 50 60
Time (s)
Temperature (K)
0.148 0.15 0.152 0.154 0.156 0.158 0.16
Specific Volume (cm3 /g)
Figure 3.2: Simultaneous measurement of cooling curve and specific volume for Vit105 showing the discontinuous change in volume during recalescence.
0.152 0.154 0.156 0.158 0.16 0.162 0.164
200 600 1000 1400
Temperature (K) Specific Volume (cm3 /gm)
Figure 3.3: Specific volumes of the liquid and crystal as a function of temperature for Zr55Al20Co25 (ZrAlCo). Room temperature (RT) specific volumes of the glass (∆) and the crystal (×) are also indicated in the figure. A straight line (solid line in the figure) connecting the RT amorphous specific volume to the liquid specific volume at the calorimetric glass transition temperature was used to obtain the volume expansion coefficient of the glass. Room temperature (RT), glass transition temperature (Tg), and liquidus temperature (TL) are indicated by vertical dotted lines in the figure.
Liquid
Crystal Glass
Tg
RT TL
3.3.2 Viscosity
The viscosities measured for four of the alloys using the drop oscillation technique are shown in Figure 3.4 with the temperature axis normalized by their respective liquidus temperatures. The viscosities of Vit105 are almost in the same range as Vit106 and hence, are not indicated. The viscosities for two of the constituent pure metals, Cu and Ni, are also shown for comparison [14]. The bulk glass forming alloys show two orders of magnitude higher viscosity compared to pure metals. Among the bulk glass forming alloys, the better glass formers show higher melting temperature viscosity.
The critical cooling rates (Rc) are indicated alongside the viscosities in Figure 3.4. Thus, this study demonstrates that the high viscosity of bulk glass forming melts plays a decisive role in determining their superior glass forming ability, as seen from the smaller critical cooling rates for vitrification.
Noise level of the measured viscosity is larger at lower temperature because of the increased resistance to oscillation. The maximum viscosity measured was about 200 mPa⋅s. The average error in viscosity measurement from the decay times at the low temperature end is estimated to be within ± 5%. The range of temperature over which the viscosities were measured and the melting temperature viscosity (ηm) are shown in Table 3.3. The relatively low viscosity of the NiNb alloy made viscosity measurements possible, down to about 60 K undercooling. The viscosity of Vit1 close to the liquidus temperature was measured by Masuhr et al [3] using a Couette viscometer, and viscosities close to Tg were measured by Waniuk et al [15] using the three-point beam bending method. For the range of oscillation frequencies used in this study, the viscosity
of Vit1 was found to be non-Newtonian below 1300 K, as discussed in the Appendix.
The viscosities for Vit1 are found to be lower for measurements done with higher resonance frequency, indicating that higher strain rate of deformation leads to lowering of the viscosity. However, for the range in strain rate used during drop oscillation in the ESL, the other alloys investigated in this study did not show non-Newtonian behavior.
For Vit106, viscosity close to Tg was determined from the measured flow stresses.
Table 3.3: Melting temperature viscosity and VFT fitting parameters
BMG Temp. range (K) ηm (mPa⋅s) ηo (mPa⋅s) D To (K)
Vit1 1118 – 1278 4835 0.001 23.8 390.0
Vit106 1120 – 1360 200 0.015 11.3 524.7
ZrAlCo 1280 – 1480 100 0.006 12.2 576.0
Vit105 1095 – 1360 180 0.01 11.6 521.0
NiNb 1390 – 1690 45 0.06 5.6 800.0
Within Angell’s fragility concept, viscosity of liquids has been correlated with their GFA [2]. Use of glass transition temperature (Tg) as the scaling temperature for viscosity allows for classification of liquids according to their “strong-fragile” behavior.
Strong liquids show close to Arrhenius temperature dependence of viscosity and form stable glasses. Fragile liquids, on the other hand, show low viscosity at the melting temperature, only to rise sharply close to the glass transition and form glasses that are unstable with respect to crystallization. The fragility behavior shows a correlation with GFA for BMGs with all metallic constituents [15,16]. However, the behavior of metal- metalloid BMGs such as Pd-Ni-Cu-P does not follow the same trend [17]. The difference in fragility behavior for these two classes of alloys has been attributed to the difference in their liquid structure [18].
1 10 100 1000
0.8 0.9 1 1.1 1.2 1.3
T/TL
Viscosity [mPa s]
Vit1 Vit106 ZrAlCo NiNb Cu Ni
Figure 3.4: Viscosity for the alloys investigated in this study with temperature axis normalized by their respective liquidus temperatures. Viscosity for the pure metals Ni and Cu (obtained from Reference 14) are also indicated. The critical cooling rates for vitrification (Rc) are indicated alongside the viscosity data. The alloys with higher melting temperature viscosity show lower critical cooling rate for vitrification.
Rc=2 K/s
Rc=10 K/s Rc=17 K/s Rc=250 K/s Rc=107 K/s
Figure 3.5 is the fragility plot for the alloys investigated in this study. Also shown in the figure are the viscosities of silica (SiO2) [2] which is a canonical example of a strong glass showing Arrhenius temperature dependence of viscosity. The alloys with behavior similar to silica are strong liquids. These strong liquids have a built in resistance to structural change, and their radial distribution function shows little reorganization with wide temperature fluctuations [2]. On the other hand, alloy melts with strong non- Arrhenius temperature dependence of viscosity are termed as fragile liquids. These fragile liquids show large variation in particle orientation and coordination states with slightest provocation from thermal fluctuations [2]. The viscosity values for ZrAlCo and Vit105 are in the same range as Vit106 and are not indicated. This investigation (Figure 3.5), as well as other previous investigations [2,15-17], have shown that the viscosity of most alloy melts, with metallic as well as non-metallic constituents, approaches 1015 mPa⋅s at the calorimetric glass transition temperature. This is the value assumed for the viscosity of ZrAlCo, Vit105 and NiNb at their glass transition temperatures. The viscosities measured in this study were fitted (as shown in Figure 3.5) with the Vogel- Fulcher-Tammann (VFT) equation [2,15-17]:
⎟⎟⎠
⎜⎜ ⎞
⎝
⎛
= −
o o
o T T
exp DT η
η , (3.2)
where To is referred to as the VFT temperature, D is called the “fragility parameter” and ηo is the high temperature limit of viscosity. The three parameters are summarized in Table 3.3 for all the alloys.
1.0E+00 1.0E+02 1.0E+04 1.0E+06 1.0E+08 1.0E+10 1.0E+12 1.0E+14 1.0E+16
0.4 0.5 0.6 0.7 0.8 0.9 1
Tg/T
Viscosity (mPa s)
Vit1 Vit106 NiNb VFT Fits SiO2
Figure 3.5: Fragility plot of viscosity for Vit1, Vit106 and NiNb. Viscosity data for SiO2
is taken from Ref [2]. Viscosity data for Vit1 measured by Waniuk et al. [15] and Masuhr et al. [3] are indicated by arrows. All the remaining data points are measured in this study. The liquidus temperature for the three alloys is indicated by the vertical line at Tg/T=0.62. The best fits to the experimental data by Vogel-Fulcher-Tammann (VFT) relation [Equation (3.2)] are indicated by the dotted lines.
Couette Viscometer Masuhr et al.
3-point Beam Bending Waniuk et al.
Strong
Fragile
Tg/T = 0.62
A stronger liquid has a higher value of the fragility parameter. The best glass former (Vit1) has the highest value of fragility parameter (D = 23.8), while the worst glass former (NiNb) is found to be most fragile (D = 5.6). Vit1 is therefore a much stronger liquid compared to the NiNb eutectic alloy, and this strong liquid behavior contributes towards better GFA of Vit1. The fragility parameters for ZrAlCo, Vit106, and Vit105 are very close to each other (D = 11.8 ± 0.5), showing their similar GFA. Silica has a fragility parameter of about 100. Thus, stronger metallic glass melts are found to be better glass formers as well. The ratio of glass transition temperature to the liquidus temperature for the alloys investigated in this study is close to 0.62. The liquidus temperature is indicated by a line at Tg/T = 0.62 in Figure 3.5. The best glass former (Vit1) has about two orders of magnitude higher viscosity compared to the worst glass former (NiNb) at their respective liquidus temperatures. The viscosities of Vit106, ZrAlCo, and Vit105 are intermediate between those of Vit1 and NiNb. Thus, this study demonstrates that both the strong liquid behavior and high melting temperature viscosity increase the propensity for glass formation.
3.3.3 Correlation Between Viscosity and Free Volume
Viscosity is correlated with the free volume of the liquid in the Cohen-Grest model as [19]:
(
bvo/vf)
0exp η
η = (3.3)
where, vf denotes the average free volume per atom, and bvo the critical volume for flow.
According to equation (3.3), larger viscosity corresponds to smaller free volume, which
viscosity liquid will show a smaller change in volume upon crystallization.
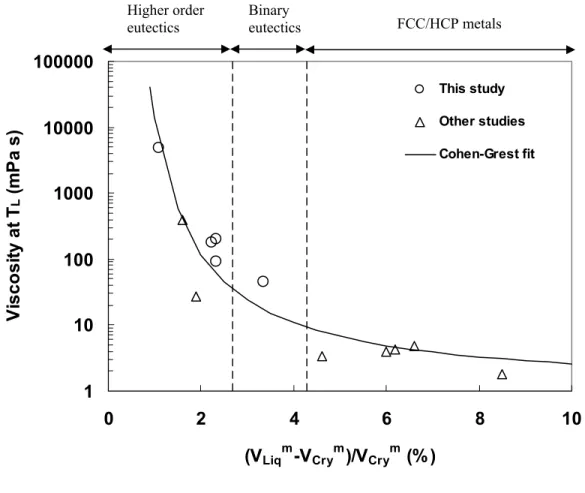
Figure 3.6 shows viscosity versus volume change upon crystallization for several eutectic (or close to eutectic) alloys and pure metals at the melting temperature, including the alloys investigated in this study. The constituent elements (Ti, Zr, Cu, Ni, Al) which have face-centered cubic (FCC) and hexagonal close-packed (HCP) crystal structures, show large volume changes upon crystallization [7,20], compared to the higher order eutectic alloys investigated in this study or reported elsewhere [21,22]. Also, the viscosities of pure metals [7] are orders of magnitude lower compared to the higher order alloys. It is clear that smaller critical cooling rate is observed for alloys with higher melting temperature viscosity, which translates to a smaller volume change upon crystallization [23]. This suggests that high temperature viscosity and free volume that govern the crystallization kinetics close to the melting temperature have a pronounced influence on the critical cooling rate for vitrification. As shown in Figure 3.6, all the data points can be reasonably fitted with the equation: ηm = 0.98×exp[9.76×VCrym/∆Vm] mPa⋅s, which is of the same form as equation (3.3) with vf/vo being proportional to ∆Vm/VCrym. Thus, the melting temperature viscosity is correlated with excess volume in the liquid for a wide variety of alloys and pure metals. These results are consistent with the Cohen- Grest free volume theory [19] because a smaller change in volume upon crystallization implies little free volume in the liquid and correspondingly lower atomic mobility, which leads to higher viscosity.
1 10 100 1000 10000 100000
0 2 4 6 8 10
(VLiqm-VCrym)/VCrym (%)
Viscosity at TL (mPa s)
This study Other studies Cohen-Grest fit
Figure 3.6: Viscosity at liquidus temperature versus the volume change upon crystallization for several eutectic alloys and pure metals. In order of increasing volume change, the data points are for: Vit1 [present work], Pd43Ni27Cu10P20 [17,22], Pd40Ni40P20
[4,21], Vit105 [present work], Vit106 [present work], Zr55Al20Co25 [present work], NiNb [present work], and pure metals (Ti, Zr, Cu, Ni, Al [7,20]). Cohen-Grest free volume fit [19] is indicated.
FCC/HCP metals Binary
eutectics Higher order
eutectics
Comparing equations (3.2) and (3.3), the free volume of the liquid can be expressed in terms of its fragility parameter as:
⎟⎟⎠
⎜⎜ ⎞
⎝
= ⎛ −
o o o
f
T T T D
b v
v . (3.4)
Cohen and Turnbull [24], in their “free volume” theory for liquids and glasses, proposed that diffusion occurs when redistribution of free volume opens up a void of critical volume (vo). The parameter b in equation (3.4) corrects for the overlap of free volume.
Taking vo as the limiting specific volume of the liquid at To, Cohen and Turnbull [24]
found the parameter b to be in the range 0.66 to 0.86 for van der Waals liquids and 0.1 to 0.4 for most pure liquid metals. So the critical volume for flow in case of liquid metals is much smaller (of the order of the ion core volume) compared to van der Waals liquids (of the order of atomic volume). Figure 3.7 shows the percentage of free volume for the three alloys, Vit1, Vit106, and NiNb expressed as a function of the temperature normalized by To. Using a value of b ~ 0.2, the free volumes for the three alloys at their liquidus temperatures (indicated by arrows in Figure 3.7) agree closely with the experimental values, ∆Vm/VCrym given in Table 3.2. Thus, the parameter “b” is almost the same for the three alloys and is within the range found by Cohen and Turnbull [24] for pure metals. In this picture, a stronger liquid can be viewed as one in which the rate of free volume change with temperature is smaller. Thus, better glass formers have smaller free volume at their melting temperatures and also show smaller change in free volume with change in temperature.
0 1 2 3 4
0 0.5 1 1.5 2
(T-To)/To Vf / Vo (%)
NiNb
Vit1 Vit106
1/D
Figure 3.7: Free volume of the glass forming alloys expressed as a percentage. The parameter “b” in Equation (3.4) is about 0.2 for all the alloys. The slope of the free volume curves is inversely proportional to the fragility (D) of the melt. The liquidus temperatures for the alloys are marked with arrows.
3.3.4 Surface Tension and Its Correlation with Viscosity
Surface tension was obtained for the five glass forming alloys: Vit1, Vit106, ZrAlCo, Ni60Nb34.8Sn5.2 (NiNbSn), and NiNb. Surface tension for the ternary alloy, Ni60Nb34.8Sn5.2 (NiNbSn) that is obtained by a small addition of tin to the NiNb eutectic alloy, is investigated to understand the surface segregation behavior of tin. The surface tensions for the alloys investigated in this study are shown in Figure 3.8. Except for the NiNb binary alloy that shows a positive temperature gradient of surface tension, the other four alloys show almost constant values over the temperature range investigated [25].
The surface tension of a liquid should decrease with rising temperature because at the critical temperature, the surface between liquid phase and gas phase disappears and the surface tension is reduced to zero. Negative temperature gradient for surface tension has been found for almost all of the pure metals [7] and the values for two of the constituent elements, Cu and Ni, are shown in Figure 3.8. Positive temperature gradient of surface tension has been reported for another deep-eutectic binary alloy, Ni36Zr64 [26]. The anomalous positive temperature gradient of surface tension in some alloys may be due to surface segregation of low surface tension element with increasing undercooling. The temperature dependence of surface tension in NiNb alloy suggests that there will be a considerable amount of Marangoni flow if there are temperature gradients in the sample.
However, Marangoni flow will not be significant in the other bulk glass forming alloys, making them suitable for diffusion studies.
1.0 1.2 1.4 1.6 1.8 2.0
1100 1300 1500 1700 1900
Temperature [K]
Surface Tension [N/m]
Vit1 Vit106 ZrAlCo NiNbSn NiNb Cu Ni
Figure 3.8: Surface tension for the alloys investigated in this study. The surface tension for the pure metals Ni and Cu (obtained from Reference [7]) are also indicated.
The surface tension of most binary liquid mixtures shows negative deviation from the value obtained by assuming the rule of mixtures of pure components’ surface tension [7]. This has been attributed to the enrichment of the liquid surface with the component of lower surface tension to minimize the total energy. To evaluate the possible surface segregation effects, surface tension at the melting (or liquidus) temperatures (σm) of the alloys investigated in this study are compared with the proportional mathematical addition of pure components’ surface tension, as shown in Table 3.4. While the three zirconium-based alloys (Vit1, Vit106 and ZrAlCo) show small deviations from the rule of mixtures, NiNb and NiNbSn show large deviations. The considerably large negative deviation of 52% in the case of NiNbSn shows a significant degree of surface segregation of Sn which has a very low surface tension of 0.56 N/m.
Table 3.4: Surface tension values obtained experimentally and from the rule of mixtures BMG σm [N m-1]
(Experiment) σm [N m-1]
(Rule of mixtures) % deviation
Vit1 1.47 1.49 -1.35
Vit106 1.51 1.45 +4.05
ZrAlCo 1.47 1.44 +2.06
NiNbSn 1.04 1.76 -51.43
NiNb 1.36 1.83 -29.47
The segregation behavior in binary Ag-Sn alloy melts has been investigated theoretically by solving the grand partition functions for the bulk and the surface within the framework of compound formation model [27]. The theoretical results agree well with the experimental finding for Ag-Sn alloys [28], showing pronounced surface segregation of Sn atoms for all bulk concentrations between 0 and 100% Sn. The low surface tension values for NiNbSn observed in this study support this surface segregation
behavior of Sn. The total error involved in the surface tension value is estimated to be within ±5%, and the deviations observed for the zirconium-based alloys are within the experimental uncertainty.
Based on the hard sphere model, a relationship between surface tension (σ) and viscosity (η) was derived for pure metals, making use of the fact that both surface tension and viscosity can be expressed as integrals over the product of inter-atomic forces and the pair distribution function [29,30]:
m kT 16
=15 η
σ , (3.5)
where m is the molecular weight, k is the Boltzmann’s constant, and T is the temperature.
Figure 3.9 shows (σ/η)×(m/TL)1/2 plotted versus the square root of temperature normalized by the liquidus temperature (TL). The correlation has been found to be true for a number of transition and noble metals within 10-20% (shown for Ni and Cu in Figure 3.9) [29]. However, for the complex multi-component alloys, the disparity is by orders of magnitude as shown in Figure 3.9. Equation (3.5) has been derived for pure metals with atoms of a single species and does not take into account the surface segregation and alloying effects that are very important for multi-component systems. In the case of a