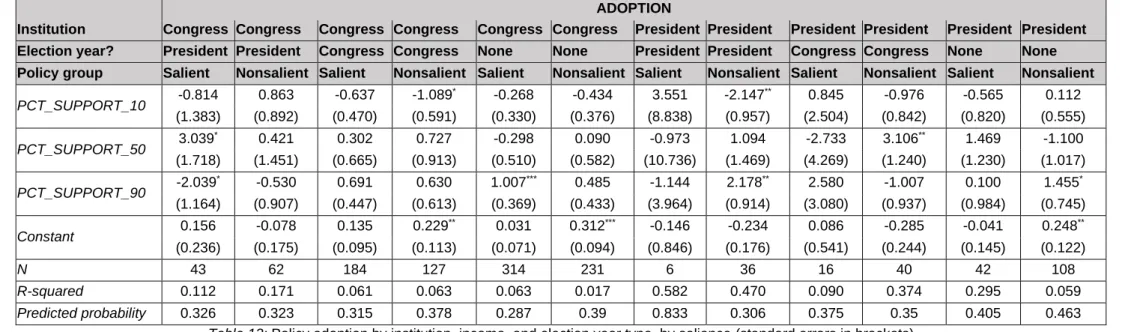
Although measures of responsiveness in election years will be cardinally greater than measures in non-election years, there will still be differential responsiveness to voter preferences within Congress and the presidency. Therefore, I will analyze Congress (or the President) in years of congressional only (presidential only) elections as well as Congress (president) in years of presidential (congressional only) elections. These results provide evidence against my first hypothesis: the president appears to be more responsive to voters than Congress.
The last part of my hypothesis is wrong, however, because Congress is still less responsive to voters than the president (or, more precisely, less responsive to high-income voters, those at the ninetieth percentile that I use to understand responsiveness to economic elites). Regarding the second part of my hypothesis, similar to the first part, a comparison of the confidence intervals of the coefficients between institutions (e.g., Congress in presidential election years and the President in presidential election years) reveals an overlap in response estimates between congressional and non-election years, making it impossible for me to definitively confirm of the second part of H3 despite the fact that the coefficient point estimates are higher for the Presidency than for Congress (which would support my hypothesis, similar to what I observe in the test of the first part of H3). Interestingly, the preferences of low-income voters are negatively and significantly (at the 5% level) associated with congressional policymaking in congressional election years.
congressional elections, the preferences of economic elites are irrelevant for Congress (ie the president) - i.e., the preferences of economic elites are irrelevant in the first and fifth columns.
Discussion of Potential Confounders
- Constituents’ Agenda-Setting Power (or Lack Thereof)
- On Constituents Expressing Preferences
- The State’s Emergent Preferences(?)
- Interest Groups
As a result, members of the House of Representatives can always try to maximize their responsiveness to elites in non-election years in preparation for increasing their funding for the upcoming election (which will increase their chances of re-election, making my results again consistent with Mayhew's theory). In summary, holding unchanged the preferences of middle- and low-income voters—i.e. those least able to fund legislators' election campaigns and therefore those most likely to be marginalized -- lawmakers may not distinguish between election and non-election years. when trying to secure campaign funds from potential donors. Furthermore, since members of the House of Representatives make up the majority of Congress, it is possible that this lack of difference between congressional responsiveness in election and non-election years is due to the effects of House responsiveness "overriding" the increased responsiveness of the Senate in election years.
Future research could expand my data to examine legislators' roll call votes and whether they correspond with their constituents. A similar effect may explain the lack of significant difference between presidential responsiveness during election and non-election years: the president may try to remain as responsive as possible since he has fewer opportunities to adopt a policy, which every policy of make greater importance. Future research could examine the potential general equilibrium linking unresponsive government to the likelihood of political participation.
Another potential problem with my analysis is endogeneity bias: while policy adoption can be determined by voters' preferences, voters' preferences can also be determined by policy proposals. If we define 'the state' as 'an interconnected set of governing institutions' that acts as a neutral arbiter between the preferences of low-, middle- and high-income citizens (Cudworth et al., 2007, p. 2), we can see proposed policies as expressions of voters' preferences (Latham, 1952). Through this lens, it is possible for our government to have its own policy agenda (Latham, 1952), in which case the proposed policies originate within the state and may follow voters' preferences about them.
My analysis assumes that all proposed policies start with voters' preferences, which leaves my findings open to this potential threat to their validity. Future research could examine whether the state implements policies that are largely inconsistent with the preferences of its constituents; Such a policy could be a sign that there is a mechanism at play within our government that is not constitutionally based. As a result, the likelihood of proposals being passed could impact voters' support for them, and the cycle could repeat itself.
Conclusion
Acknowledgements
Gender, race, and descriptive representation in the United States: Findings from the Gender and Multicultural Leadership Project. Limits to the application of motivational homogeneity in the work of Buchanan and the Virginia School. Tracking the public mood at the Supreme Court: Cross-time analyzes of criminal proceedings and civil rights cases.
The President as Agenda Setter: The Dynamics of Congressional and Presidential Agenda Setting.
Appendix A. Robustness Checks
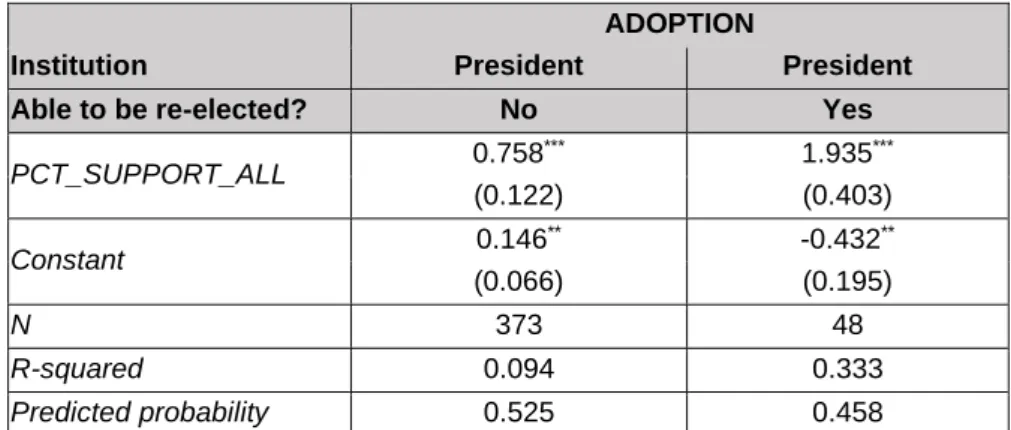
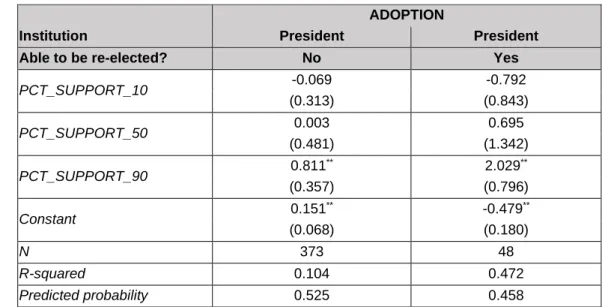
When the President Isn’t Up for Re-Election
As in my previous analyses, only the preferences of economic elites are significantly correlated with adopted policies, and although the confidence intervals of their coefficients from the two models overlap, the point estimates of the coefficients suggest that the president's responsiveness increases when he is about to be re-elected. that year, in line with my hypothesis and previous findings, despite not being a definitive, fully robust result. Future research could collect more data on presidential policymaking when the president is up for re-election and run this model again.
Policy Salience
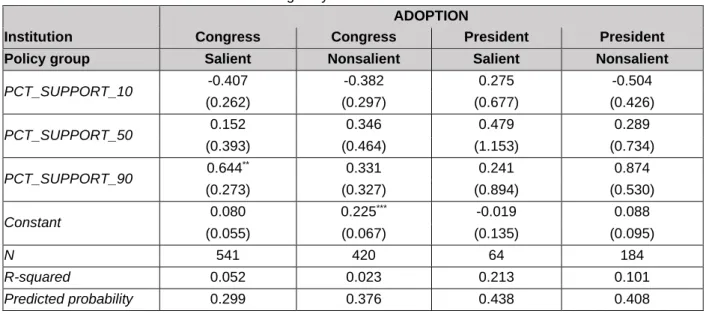
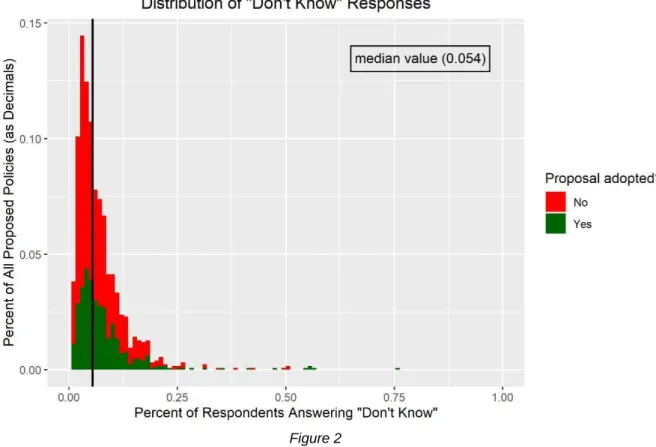
As a result, my analysis based on observability will be incomplete, but since the proportion of actually significant policies in my group of important policies will be greater than the proportion of actually important policies in my group of unimportant important policies, any increase in the responsiveness of the coefficients from the models of my important group relative to the models of my unimportant groups will show that policymakers are more responsive when voters' preferences are pronounced. Since all three government institutions are privy to policies earlier than the other institutions, I consider all policies relevant to my calculation. In summary, I use the median DK_PERCENT value (0.054) as the threshold below which policies must fall to be considered significant, and analyzing only those significant policies allows me to examine responsiveness to an “attentive public” (Arnold, 1990), voters who will pay attention to the actions of their legislators and more easily mobilize to re-elect them or vote to remove them.
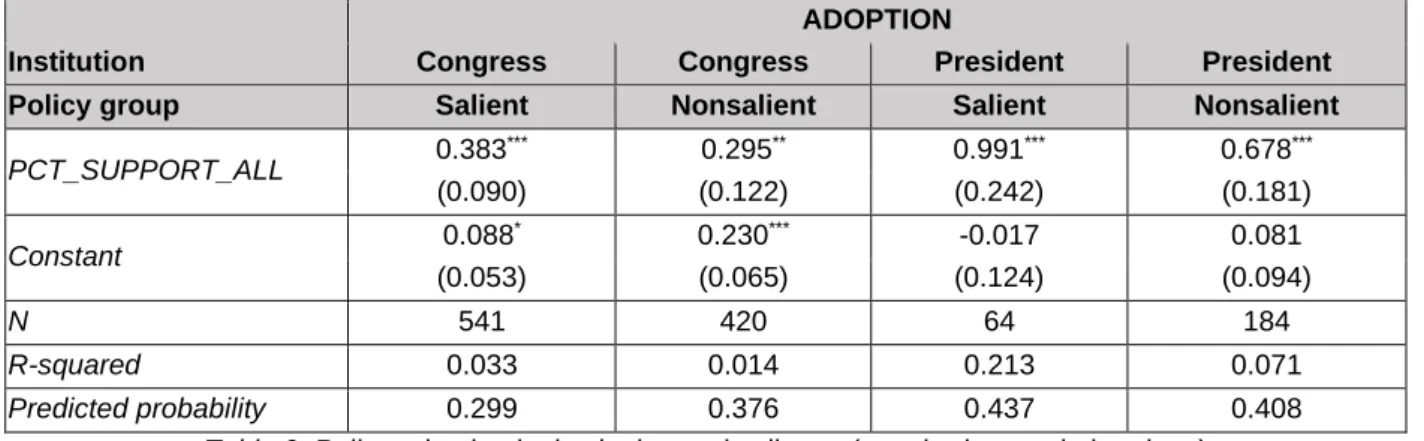
Constituent preferences remain significantly associated with congressional and presidential policy approval, although the confidence intervals for the respective coefficients within government institutions (eg, the confidence intervals for the coefficients for Congress) overlap slightly. As for the president, future research could expand my data to include more observations, possibly by shrinking the confidence intervals of the coefficients to the point that the ranking of the coefficient point estimates—with that for salient preferences that is greater than that for non-salient preferences—to be indicative of the presidency in general (ie, indicating that the president also responds more to salient preferences .). Interestingly, these models show that preferences of economic elites are significantly related to policy enacted only for Congress and when policy preferences are salient.
This increases the credibility of my hypotheses very slightly – salient preferences may be more likely to correlate with policy, and differentials remain. Because there is so much overlap between the coefficients' confidence intervals within their respective settings (eg, both sets of intervals for the models of Congressional responsiveness), I cannot definitively conclude whether a policy that is salient increases responsiveness across income groups. Institution Congress Congress Congress Congress Congress Congress President President President President President President President Election Year.
Notably, there is much overlap between each set of confidence intervals of the respective coefficients (eg, confidence intervals for Congress during presidential elections with salient and non-salient preferences). This is likely due to my having such small sample sizes (which may also decrease the reliability of these results). Because of this, I cannot evaluate my hypotheses that responsiveness increases during election years and that Congress is more responsive than the presidency.
Similar to my previous analyses, future research could expand my data set and repeat this analysis; such a repeat would have smaller confidence intervals and would then be able to evaluate my hypotheses. Similar to my earlier robustness check, I lack enough statistical power and large enough sample sizes to run these specifications with confidence intervals small enough to draw reliable conclusions, so I leave this question of responsiveness to future research.
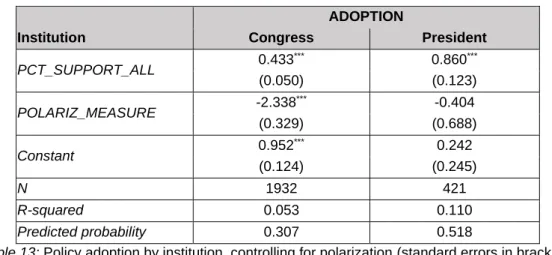
Polarization
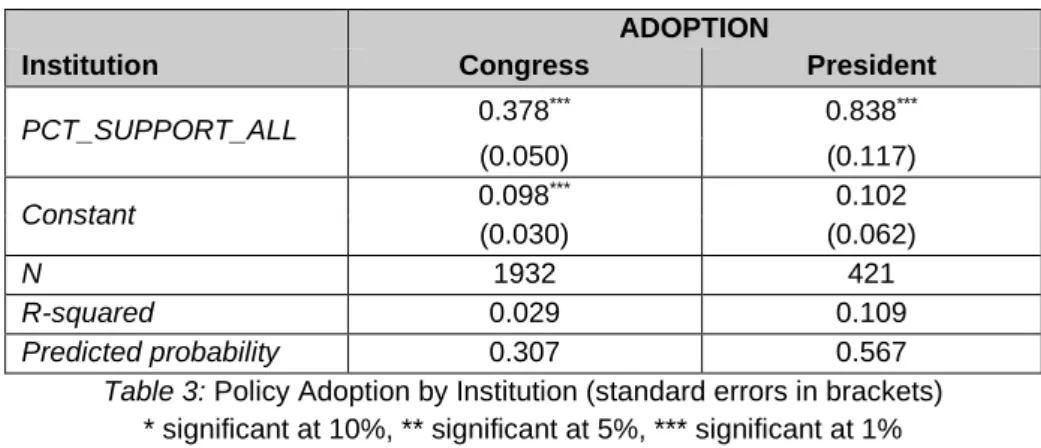
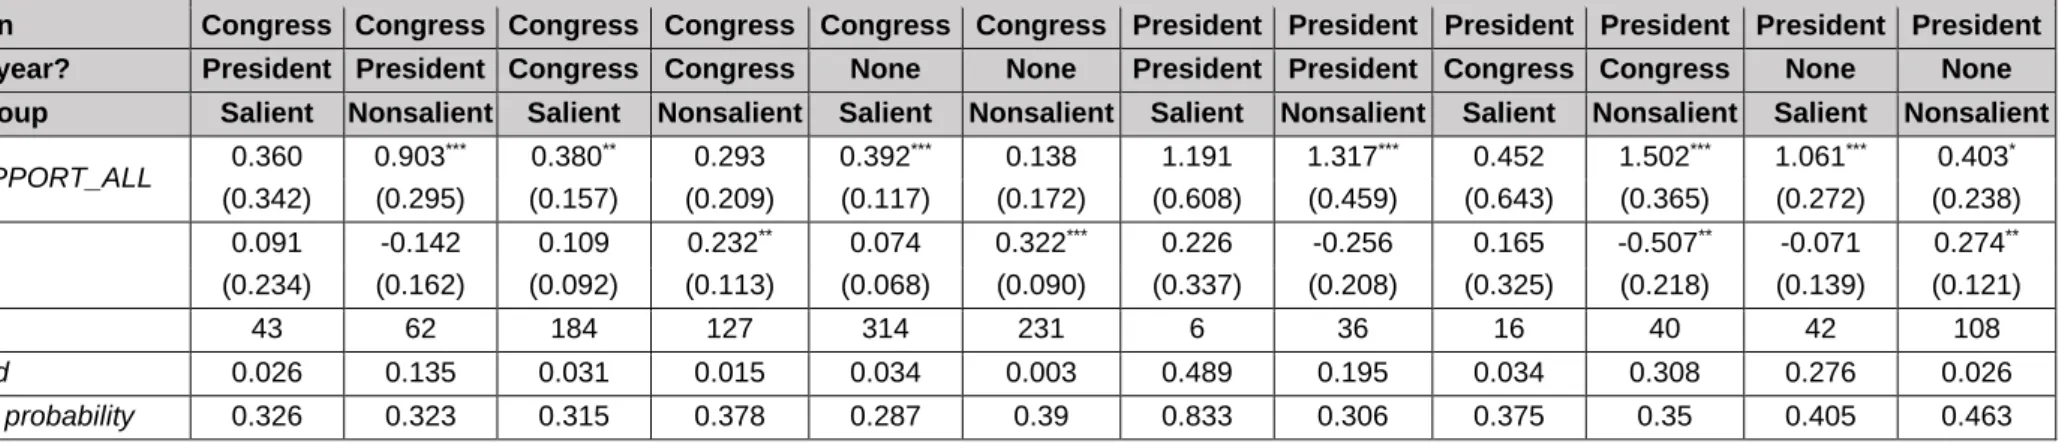
As in my earlier first-half test, the preferences of all voters are significantly correlated with policy acceptance at the 1% level for both Congress and the president, and the coefficient of PCT_SUPPORT_ALL is larger in the. These results are consistent with my original results testing H1: Voter preferences are significantly and more strongly correlated with presidential policymaking than with congressional policymaking, ranking the president as more responsive than Congress and my findings are considered robust. I then turn to H2, which argues that there is differential responsiveness within our institutions based on income.
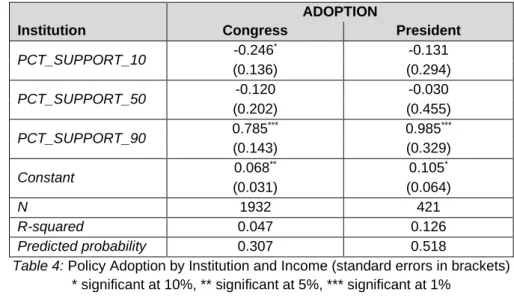
As in my results from the first time I tested H2, the preferences of low- and median-income constituents are not significant at the 1% level (although the preferences of low-income constituents are again significantly correlated with congressional policymaking at the 10% level). Additionally, similar to some of my previous results, due to the overlapping confidence intervals for the response coefficients to economic elites, I cannot conclude at 95%. The point estimate of responsiveness to elites for the president is larger than the estimate for Congress, though consistent with my previous findings.
I now turn to H3 that (1) elections increase political responsiveness and (2) the ordinal order of responsiveness from H1 will remain constant. Probably because I have so few observations for policies proposed to Congress in congressional-only election years and policies proposed to the President in presidential election years, the confidence intervals are for . Notably, however, the point estimates for congressional responsiveness during congressional election years and presidential responsiveness during presidential election years (i.e., responsiveness when these institutions are up for re-election) are larger than the coefficients for these institutions in non-election years, suggesting. the first part of my hypothesis may be true.
Finally, I turn to H4 that (1) despite the increasing political responsiveness of the election year, (2) differential responsiveness will still exist.