Studies Related to Chemical Changes in Biochar. I. Polyacrylonitrile Internal Standard to Assess Chemical Changes in Graphene Oxide. II. Ultrasonic Effects
on Polycyclic Aromatic Hydrocarbons as Models for Biochar
By
Kaci Brantley Crawford
A thesis submitted to the faculty of The University of Mississippi in partial fulfillment of the requirements of the Sally McDonnell Barksdale Honors College.
Oxford May 2019
Approved by
___________________________________
Advisor: Dr. Daniell Mattern ___________________________________
Reader: Dr. Wei-Yin Chen ___________________________________
Reader: Dr. Adam E. Smith
ii
©2019 Kaci Crawford ALL RIGHTS RESERVED
Acknowledgements ACKNOWLEDGMENTS
iii
Acknowledgements
First and foremost, I would like to thank Dr. Daniell Mattern for giving me the opportunity to work in his lab. Over the past 3 years, Dr. Mattern has been extremely patient with me through all of the ups and downs. His guidance in not only in the lab, but also classes and even some spring break plans provided the positive attitude needed to overcome the obstacles of confusion and
discouragement. I would also like to thank Dr. Wei-Yin Chen in the department of Chemical Engineering. Dr. Chen made my research position possible through NSF EPSCoR R-II Track-2. Thank you Trey Vaughn for your help in the lab and always looking for solutions to the problems encountered. I would also like to thank Riya Chatterjee. Without her help, guidance, and flexibility the second part of my research would not have been possible. Thank you to the Department of Chemical Engineering for making these last four years hard but unforgettable. I would like to give a special thanks to Kara Crawford, Daniel Stucki, and Ava Street for their constant, consistent encouragement throughout this process and this year. Most importantly, I would like to thank my parents, Kevin Crawford and Kris and Clay Patterson. They have all supported me in my academic endeavors and I am eternally grateful for each of your love and support.
iv Abstract
KACI BRANTLEY CRAWFORD: Studies Related to Chemical Changes in Biochar. I. Polyacrylonitrile Internal Standard to Assess Chemical Changes in Graphene Oxide. II. Ultrasonic Effects on Polycyclic Aromatic Hydrocarbons as
Models for Biochar
(With direction from Dr. Daniell Mattern)
Biochar has become an increasing area of research due to its reactive edges from stacks of graphene clusters. One particular area of interest in biochar is because it is a potent soil amendment which reduces soil acidity and can reduce greenhouse gas emissions from plants. Also, chemically-modified biochar is being studied as a carbon storage method to potentially mitigate climate
change. In order to understand the chemistry that takes place on biochar’s reactive edges during modification, a standard is essential. This research
attempted to identify an internal standard that could be added to biochar samples to quantify chemical changes by infrared spectroscopy. In a second project, model compounds were studied to help interpret the effects on biochar of ultrasound treatment, which appears to increase the percent carbon and hydrogen in biochar.
v
Table of Contents
Table of Figures ... vi
List of Abbreviations: ... viii
Chapter 1: Polyacrylonitrile Internal Standard to Assess Chemical Changes in Graphene Oxide ... viii
Background ... 1
Introduction ... 3
Experimental Procedures ... 5
Results and Discussion ...24
Conclusion ...29
Chapter 2: Ultrasonic Effects on Polycyclic Aromatic Hydrocarbons as Models for Biochar ... 31
Experimental Procedure ...34
Addition of Biochar ...35
Replacing Phenanthrene with Styrene Oxide ...36
Results and Discussion ...37
Initial Procedure ...37
Addition of Biochar ...42
Styrene Oxide as Model ...46
Conclusion ...52
References ... 53
vi Table of Figures
Figure 1: Structures of Possible Standards Containing Cyano Groups ... 4
Figure 2: Activated Carbon ... 6
Figure 3: 95:5 Carbon to Benzonitrile ... 7
Figure 4: 9:1 Carbon to Benzonitrile ... 8
Figure 5: 1:1 Benzonitrile to Carbon ... 8
Figure 6: Pure Benzonitrile ... 9
Figure 7: 9:1 Benzonitrile to Carbon ... 9
Figure 8: Polyacrylonitrile ...10
Figure 9: Pure Polyacrylonitrile ...11
Figure 10: 1:1 PAN to Carbon ...11
Figure 11: 1:1 Pan to Carbon Ground ...12
Figure 12: 75% PAN to Carbon ...13
Figure 13: 9:1 PAN to Carbon ...14
Figure 14: Graphene Oxide KBr ...15
Figure 15: 75% PAN to KBr ...16
Figure 16: 75% PAN to GO ATR ...16
Figure 17: 75% PAN to GO trial 2 ...17
Figure 18: 75% PAN to GO Trail 3 ...17
Figure 19: 9:1 GO to PAN ...18
Figure 20: ATR Scan of 9:1 GO to PAN ...19
Figure 21: GO from JSU ...20
Figure 22: 9:1 JSU GO to PAN ...20
Figure 23: 9:1 JSU GO to PAN ...21
Figure 24: PAN Spectra Using DRIFT ...22
Figure 25: GO Using DRIFT ...22
vii
Figure 26: 9:1 GO to PAN Using DRIFT ...23
Figure 27: Sample of PAN Using ATR-FTIR ...24
Figure 28: Sample of 9:1 GO to PAN Using ATR-FTIR ...25
Figure 29: 9:1 GO to PAN Using KBr Pellet ...26
Figure 30: DRIFT Spectrum of PAN. ...27
Figure 31: Drift Spectrum of 9:1 GO to PAN. ...28
Figure 32: Phenanthrene after Hydration ...32
Figure 33: Structure of Phenanthrene ...32
Figure 34: Possible Mechanism Steps ...33
Figure 35: Styrene Oxide ...33
Figure 36: Pure Phenanthrene Proton NMR ...38
Figure 37: Pure Phenanthrene Carbon NMR ...38
Figure 38: Pure Phenanthrene ...39
Figure 39: Proton NMR of Solid Sample after Ultrasound ...39
Figure 40: Carbon NMR of Solid Sample after Ultrasound ...40
Figure 41: Proton NMR of Filtrate ...41
Figure 42: Carbon NMR of Filtrate ...41
Figure 43: 9:1 Phenanthrene to Biochar after Sonication ...43
Figure 44: 1:1 Phenanthrene to Biochar IR after Sonication ...44
Figure 45: 1:1 Phenanthrene to Biochar NMR after Sonication ...45
Figure 46: ATR Pure Styrene Oxide ...46
Figure 47: NMR of Pure Styrene Oxide ...47
Figure 48: Product Recovered from Aqueous Phase of Filtrate ...48
Figure 49: Product from Aqueous Phase of Filtrate ...49
Figure 50: Possible Reaction Mechanism under Acidic Conditions ...50
Figure 51: Possible Reaction Mechanism under High Temperatures ...50
viii
List of Abbreviations:
ATR Attenuated Total Reflectance
DRIFT Diffuse Reflectance Infrared Fourier Transform Spectroscopy FTIR Fourier Transform Infrared Spectroscopy
GO Graphene Oxide
IR Infrared Spectroscopy
JSU Jackson State University (Located in Jackson, MS) KBr Potassium Bromide
PAN Polyacrylonitrile
Chapter 1: Polyacrylonitrile Internal Standard to Assess Chemical Changes in Graphene Oxide
Background
Carbon dioxide emissions have risen significantly since the onslaught of the industrial revolution, and while society has come a long way, scientists and engineers alike have come to see these emissions as harmful. The lack of methods in reducing industrial emissions has thus prompted this research. Chen and coauthors published Photochemical and Acoustic Interactions of Biochar with CO2 and H2O: Applications in Power Generation and CO2 Capture, 3 outlining the possibilities of carbon dioxide absorption through use of biochar.
Biochar is a carbon rich solid made by the pyrolysis of biomass in reduced oxygen presence.9. Biochar contains stacks of graphite clusters. These clusters contain graphene or graphene oxide where the carbons on the edges are often reactive and could possibly serve as binding sites for CO2. Biochar also contains titanium dioxide, which as a semiconductor could serve as an electron donor in reactions of aromatics and carbon dioxide. Based on the phenol decomposition rate reported by horn6, biochar also has a low decomposition of phenols at the high biochar preparation temperatures of 550°C. This is beneficial because phenols are susceptible to chemical interactions with ammonia and amines3. Treating biochar with ammonia and amines can lead to increased CO2 capture
2
through aminolysis that happens on the surface. Chemical changes to the structure of biochar are often monitored using infrared (IR) spectroscopy.
IR is a technique that displays a spectrum based on specific frequencies of a bond’s vibrations in a compound. It is useful to identify functional groups of a compound. Different chemical bonds absorb different and specific frequencies of Infrared radiation. IR is used because the spectra will display peaks at distinct frequencies when changes to the structure occur. When a standard is present, IR will show the frequencies of both biochar and the standard. However, when the biochar reacts and changes chemically, the frequencies displayed will also change, but the standard signals should remain the same. For example, if biochar is absorbing CO2, then there would be an additional peak or increased absorption around 2360 cm-1 for CO2, or around 1700 cm-1 for a carbonyl group.
In order to understand how carbon dioxide could be absorbed and to validate findings, there existed a need for an internal standard on biochar to quantify the ways the spectra changed after a variety of chemical treatments of the biochar, including exposure to carbon dioxide.
When this work started, the Chemical Engineering lab at the University of Mississippi was only able to produce small amounts of biochar, so activated charcoal was initially used as a model for biochar, followed by graphene oxide (GO).
Graphene Oxide (GO) is produced by oxidizing graphene to chemically exfoliate to mono sheets and introduce various oxygen functional groups. The structure of GO can be difficult to describe, because the way in which it was prepared can
3
affect its characteristics. GO has long-range order in its sp2 lattice. GO has a large amount of functional groups and a large surface area, making GO reactive.
GO is similar to biochar in that biochar is made up of stacks of GO layers4. Activated carbon is a similar structure made up of graphite, but without the variety of functional groups. Activated carbon is similar to GO in that it has a large surface area, but the area is made up of large pores. The layers of activated carbon are held together by C-C bonds. Similarly to GO, the final properties of activated carbon are dependent on how the chemical was prepared5. While activated carbon and GO are different, their similarities of graphite skeleton and a large surface area is the reasoning for using both in this procedure.
The functional groups of GO undergo significant changes under various chemical treatments, but these are difficult to quantify. An internal standard for infrared analysis could provide information about whether analyte peaks are increasing or decreasing.
Introduction
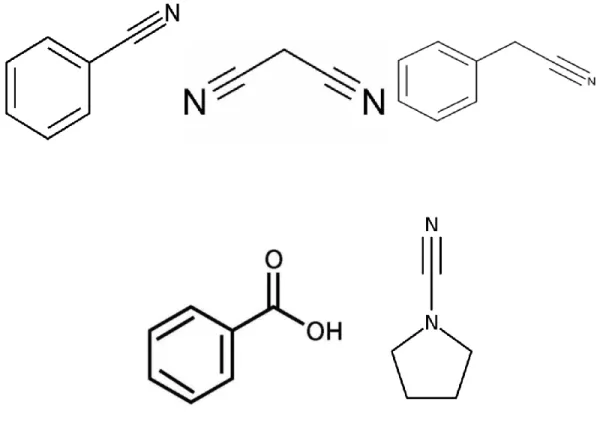
The standards we used all contained cyano groups to provide a characteristic peak around 2200 cm-1, a region in which GO shows no
absorption. The first chemical tried as a standard was benzonitrile. Benzonitrile is an aromatic colorless liquid that is known to have a large peak at 2224 cm-1.
4
Figure 1: Structures of Possible Standards Containing Cyano Groups
The spectroscopy used to obtain spectra on the carbon sample and the nitrile standard was Fourier Transform Infrared spectroscopy (FTIR). FTIR is utilized through infrared radiation passing through a sample. The amount of radiation that is transmitted is detected by the instrument, leaving a spectrum which can give indicators as to what functional groups the sample contains. The simplest method of sample preparation involves the Attenuated Total Reflectance (ATR) technique, where the sample is compressed onto the collection window.
As an alternative, to have a better read on the samples, KBr pellets were used to obtain some spectra. The KBr pellet method involves making a solution of the sample in KBr solid by compressing a powdered mixture. The KBr pellet method was chosen because it can allow ATR lasers to penetrate through the
5
solid giving a spectrum that does not just scan the surface10. This method can provide better results than ATR for solid samples.
Finally, Diffuse Reflectance Infrared Fourier Transform Spectroscopy (DRIFT) was the final technique used to obtain a clearer scan of the internal standard when combined with the biochar model. DRIFT spectroscopy of a dilute mixture of sample in KBr powder is a viable option for coarse samples or when sample absorptivity is high. Whereas ATR relies on an internal reflection of the IR source into the sample, DRIFT is a hybrid combining both an internal and
external reflection.
Throughout this experiment many procedures were followed in order to attempt to obtain clear signals from the standard and reduce the amount of both the biochar model and standard needed.
Experimental Procedures
Safety. The following experiments use activated charcoal, benzonitrile, polyacrylonitrile, and graphene oxide. Activated charcoal inhalation can cause respiratory irritation and can be an eye and nose irritant. Benzonitrile can be harmful if ingested and is a skin irritant. Polyacrylonitrile is a skin, eye,
respiratory, and digestive tract irritant. Graphene oxide can be a skin, eye, and respiratory irritant.
The first procedure involved activated charcoal as a biochar model and benzonitrile as the internal standard. In this case a 95:5 ratio of activated charcoal to benzonitrile was used. To get a complete mixing of the activated charcoal and benzonitrile, the mixture was added to a round bottom flask and
6
hexane was added to assist the mixing of benzonitrile and activated charcoal.
The mixture was left to sit for four days allowing hexane to evaporate. From there, the rotary evaporator was used to evaporate any hexane remaining. After 10 minutes the flask was removed and the mass was taken. Unexpectedly, the mass continued to decrease even after the hexane was perceived to have evaporated. Then, it was noticed that some of the activated charcoal was being sucked into the rotary evaporator. We were also concerned that some of the benzonitrile was evaporating.
Once the hexane was fully evaporated, a spectrum of the mixture was taken using ATR. Unfortunately, the spectrum of the mixture looked identical to the uncomplicated spectrum of pure carbon and no evidence of benzonitrile was detected.
Figure 2: Activated Carbon
7
Figure 3: 95:5 Carbon to Benzonitrile
Due to complications in using the rotary evaporator, it was decided that hexane would not be added to the mixture and that mixing of the compounds would take place by grinding. The second time the experiment was run, there was a 9:1 ratio of activated charcoal to benzonitrile. By lowering the ratio, it was hoped to get a clearer spectrum of the standard. After grinding the mixture, an ATR-FTIR spectrum was immediately taken to prevent possible evaporation. The results of this spectrum were similar to the first in that no evidence of the internal standard was found.
8
Figure 4: 9:1 Carbon to Benzonitrile
Since the standard was not found in the spectrum, the procedure was repeated using a 1:1 ratio.
Figure 5: 1:1 Benzonitrile to Carbon
9
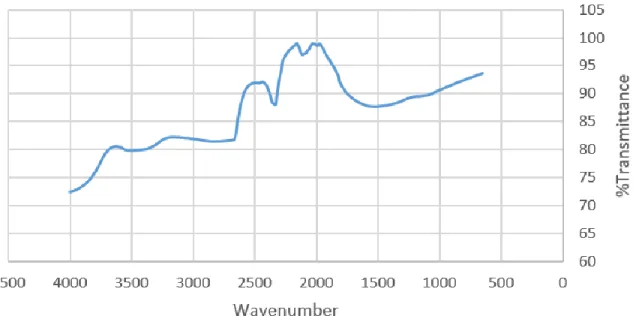
Unfortunately, still no standard was found, so a scan of pure benzonitrile was made to ensure the instrument was working properly.
Figure 6: Pure Benzonitrile
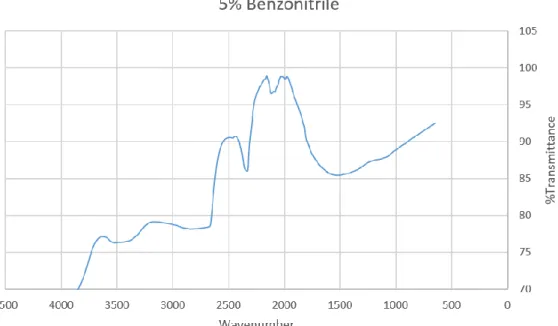
As is evident, the pure sample is pictured in the scan with prominent signal peaks. A 9:1 ratio of benzonitrile to activated charcoal was then taken.
Figure 7: 9:1 Benzonitrile to Carbon
10
The spectrum finally showed evidence of the standard, but hardly any evidence of the carbon. While we were able to see the standard, we did not want to have to use such a high ratio of the standard. It seemed likely that the benzonitrile was being absorbed into the activated charcoal such that it became undetectable by ATR-IR. After benzonitrile, n-cyanopyrrolidine, malononitrile, benzyl cyanide, and benzoic acid were all considered and tested as potential standards.
After many unsuccessful trials, utilizing a different type of standard seemed like a better option. Polyacrylonitrile (PAN) was chosen due to the its cyano peaks that would be present and the fact that it is a macromolecular solid-- hopefully preventing it from being absorbed by the activated charcoal or
evaporating. A scan of pure polyacrylonitrile was taken.
Figure 8: Polyacrylonitrile
11
Figure 9: Pure Polyacrylonitrile
The first procedure involving polyacrylonitrile used a 1:1 ratio of the
standard and activated charcoal. The mixture was stirred and an ATR-FTIR scan was taken.
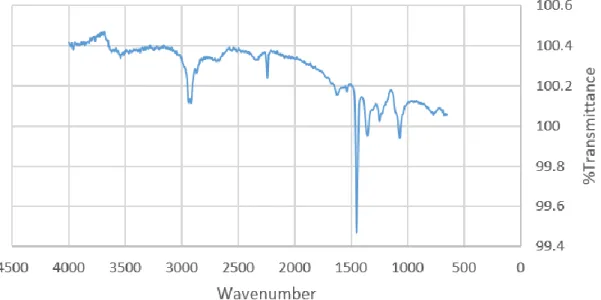
Figure 10: 1:1 PAN to Carbon
12
There is a large peak for the pure sample at 1453 cm-1, and a similar, but smaller peak found on the scan of the mixture.
In an attempt to generate a more uniform sample, it was ground before the spectrum was obtained. After grinding, the sample appeared more uniform based on multiple scans taken from the same sample.
Figure 11: 1:1 Pan to Carbon Ground
While there were better results using polyacrylonitrile, the peak of interest at 2200 cm-1 was not visible. Due to this, we hypothesized that the
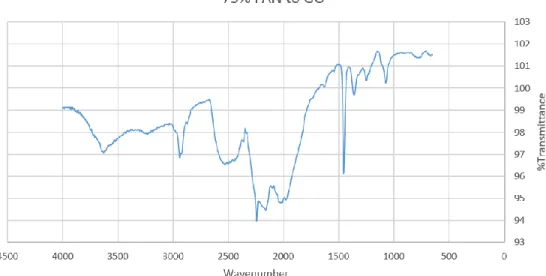
polyacrylonitrile might, like the benzonitrile, be absorbed into the activated charcoal. To get a more in-depth scan, KBr pellets were a hopeful solution. A 75% ratio of polyacrylonitrile to activated charcoal was used with KBr pellets hoping to achieve similar peaks to the 9:1 ratio using ATR. The 75% ratio did show the peaks of interest, but the transmittance was low.
13
Figure 12: 75% PAN to Carbon
Next, a 9:1 PAN to carbon sample was made and analyzed using KBr Pellets.
14
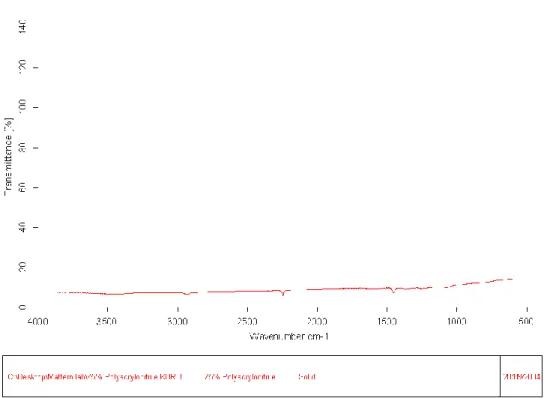
Figure 13: 9:1 PAN to Carbon
This spectrum shows the desired peaks, just as the 75% PAN does. While the peaks are visible, the KBr Pellet method was not producing the desired results of strong peaks at low levels of the internal standard.
After these results, a different model for biochar was chosen. Graphene Oxide (GO) was chosen to replace activated charcoal as the model for biochar.
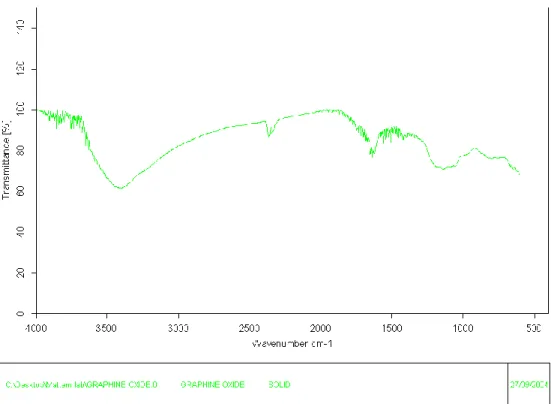
The Chen research group was actively making GO in their lab along with biochar, so GO became an available alternative with a similar environment to biochar. To understand how graphene oxide differed from activated carbon, an unground KBr pellet was made and an ATR scan was taken.
15
Figure 14: Graphene Oxide KBr
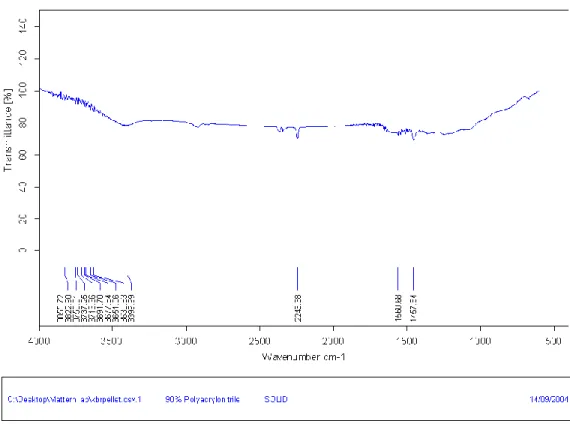
Once the initial scan of GO was taken, a 75% mixture of polyacrylonitrile and 25% GO was made into a KBr pellet and scanned.
16
Figure 15: 75% PAN to KBr
To compare, the same ratio of polyacrylonitrile to GO was used for an ATR-FTIR scan.
Figure 16: 75% PAN to GO ATR
17
Both the KBr and ATR-IR spectra have the peaks of interest at 2200 cm-1 and 1450 cm-1. The baseline of the IR is still a concern. The KBr does have a better baseline, but after using the same sample for an additional KBr Pellet, the spectrum indicated that producing the same spectrum is not a guarantee.
Figure 17: 75% PAN to GO trial 2
Figure 18: 75% PAN to GO Trail 3
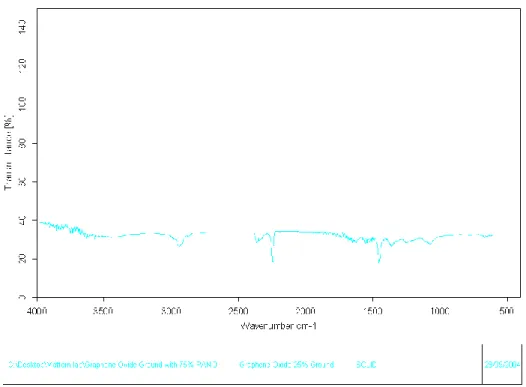
A 9:1 ratio of GO to PAN was also used to make a KBr pellet.
18
Figure 19: 9:1 GO to PAN
This spectrum shows the characteristic peak at 2200 cm-1. The sloping baseline in the spectrum is an issue.
Based on these results from the KBr spectrum of polyacrylonitrile and GO, a 9:1 mass ratio of GO to PAN was also evaluated using FTIR.
19
Figure 20: ATR Scan of 9:1 GO to PAN
This spectrum has the characteristic peaks at 2200 cm-1 and 1453 cm-1. The baseline is the biggest problem. The next task was to show strong
characteristic peaks were reproducible.
After using GO produced at the University of Mississippi, we were also given samples of GO made at Jackson State University (JSU). To compare the samples, a pure sample of JSU GO and a 9:1 ratio of JSU GO and
polyacrylonitrile was made. These samples were evaluated using ATR-FTIR.
20
Figure 21: GO from JSU
Figure 22: 9:1 JSU GO to PAN
The spectrum of the GO from the lab at JSU is closer to the literature spectrum, so this GO was used from then on. Another 9:1 GO: PAN ratio was used for an ATR-FTIR, this time with extensive grinding of the components to better ensure uniformity. The same sample used for the last FTIR was used to make a KBr pellet and scan.
21
Figure 23: 9:1 JSU GO to PAN
The purpose of this scan was to attempt to see more peaks from the PAN that had not been picked up using ATR. This spectrum is not as strong as
expected and further emphasizes the inconsistencies in KBr Pellet method.
After searching different techniques to obtain better spectra of samples, the lab obtained a Diffuse Reflectance Infrared Fourier Transform (DRIFT) spectroscopy attachment. Using DRIFT, spectra of PAN, GO, and a 9:1 ratio of GO to PAN were collected.
22
Figure 24: PAN Spectra Using DRIFT
Figure 25: GO Using DRIFT
23
Figure 26: 9:1 GO to PAN Using DRIFT
While using DRIFT did provide a better spectra, the spectra were not always consistent. A specified ratio of KBr to the sample was not initially
measured by mass; to try to combat the inconsistencies, a 5:1 ratio of KBr to the sample was thereafter used when collecting spectra using DRIFT.
Once multiple spectra were collected, the spectra were adjusted using Microsoft Excel to have the %Transmittance of the peaks span from 0-100%.
This allowed different sample spectra to be compared. From there, the PAN spectrum was subtracted from the mixture spectrum. The cyano PAN peak (around 2200 cm-1) was added back to the mixture spectrum at its experimental intensity to become an internal standard for the spectrum.
24 Results and Discussion
It was found that small molecules with reporter groups like cyano (C≡N) that might serve as internal standards were absorbed by the sample and gave no signal. But peaks from the cyano polymer PAN were observable.
Attenuated Total Reflectance Fourier Transform Infrared (ATR-FTIR) spectroscopy of PAN showed only a small signal for the cyano group at 2280 cm-
1, but a stronger band at 1450 cm-1 showed promise for use as an internal standard peak. However, ATR of GO-PAN mixtures showed only small PAN peaks unless there were excessive amounts of PAN present in the sample.
Figure 27: Sample of PAN Using ATR-FTIR
25
Figure 28: Sample of 9:1 GO to PAN Using ATR-FTIR
KBr pellet analysis of the mixtures was also attempted. The thought was that if the PAN had been absorbed into the GO, it might still be detectable in a KBr suspension. The results did not produce the quality needed.
26
Figure 29: 9:1 GO to PAN Using KBr Pellet
In the past, routine IR analyses were performed as either a mineral oil suspension on salt discs, or as a solution of sample in solid KBr pellets. Current usage of attenuated total reflectance (ATR) IR spectroscopy has drastically shortened sample preparation time, as a sample can be placed on the ATR stage and measured directly.
Limitations of ATR, which gathers signal from the sample’s surface, occur with samples of high absorptivity, or when the particle size is large (as occurs with GO). Both ATR and DRIFT are based on reflectance of the incident IR source as it interacts with the sample. While transmission IR spectroscopy gives a direct quantitative relationship of transmitted light to concentration, and is therefore the standard for IR quantification methods, it is sometimes impractical, for example with opaque samples like GO.
27
Diffuse Reflectance Infrared Fourier Transform (DRIFT) spectroscopy resulted in better baselines and stronger peaks than ATR powder or KBr pellet IR analyses. DRIFT spectra of the mixture and of pure PAN were adjusted using Microsoft Excel to have the %Transmittance of the peaks range from 0-100%, so they could be compared. This allowed the PAN spectrum to be subtracted from the mixture sample spectrum. The cyano PAN peak was then added back to the difference spectrum to serve as the internal standard peak.
Figure 30: DRIFT Spectrum of PAN. The % Transmission was adjusted to range from 100% to 0%
28
Figure 31: Drift Spectrum of 9:1 GO to PAN.
The PAN spectrum now shows the C≡N stretch as the major peak. The
mixture spectrum shows the PAN peaks prominently (green arrows), with
additional peaks from GO (red arrows).
In this search for a good standard for biochar, there are a multitude of errors that could have arisen. One possible error is the inconsistency of grinding.
Some samples were ground and others were unground. Some were marked if they were ground or unground and some samples were unspecified. Grinding was performed in the hopes of generating a uniform sample. The grind time was also inconsistent, ranging from 30 seconds to 5 minutes. The inconsistencies in
29
grinding/not grinding and the time of grinding could be reflected in the outcomes of the spectra. Another possible source of error could be from the amount of scans taken for each sample. For FTIR, the number of scans on the sample is manually entered. For the most part, the number of scans were from 32 - 52.
Originally, the scans were done set at 32, but later it was hypothesized that raising the number of scans might produce better spectra, so the number of scans was raised. Overall, it is inherently difficult to produce representative spectra from insoluble carbon solids where the surfaces might not match the interior. There was also problems with roaming baselines and weak functional groups that made useful spectrum-to-spectrum comparisons untenable.
Conclusion
While we were able to get peaks of interest from the different scans at
some ratios, the spectra were drastically inconsistent and a useful internal
standard was not found. To find a reliable, consistent internal standard using
spectroscopy, I would recommend using DRIFT. The spectra using DRIFT picked
up the PAN even at low ratios. I would also look into using a different potential
standard. In this testing, the C≡N peak, which was typically around 2200 cm-1, was the peak of interest. Another chemical that has different properties with
30
noticeable, literature supported peaks could possibly lead to more success.
Overall, this experiment did not produce a uniform, consistent standard.
31
Chapter 2: Ultrasonic Effects on Polycyclic Aromatic Hydrocarbons as Models for Biochar
The Chen group has gathered evidence that sonication of biochar changes its surface area, pore size, mineral content and heating value.7 As minerals are leached from biochar into the water, the percentage of the
remaining content (carbon and hydrogen) increases. The most remarkable claim by the Chen group is that the absolute amount of hydrogen and carbon increases during sonication. The idea was that the biochar could be “fixing” hydrogen from the water and/or carbon from the carbon dioxide. These remarkable claims could have far-reaching impacts on the use of ultrasound to improve on the use of ultrasound to improve the energy content of biochar. However, the analytical evidence supporting the claims was near the limits of significance. In this work, I attempted to verify these claims. If the claims of biochar fixing hydrogen and carbon were true, it meant that the overall energy content of the biochar increased, providing a boost to its heating value. In order to test this theory, a model for biochar was used. Biochar’s structure is a scaffold of graphite-like carbon sheets of aromatic rings with oxygenated functional groups such as phenol, carboxyl, and epoxy. For models, small polycyclic aromatics were considered. The first was phenanthrene
This hydrocarbon has three fused rings. If hydrogen is fixed to the fused scaffold like what could be happening to biochar, we expected to see partially reduced rings with a pi double bond changed to a saturated -CH2-CH2- fragment.
32
Figure 32: Phenanthrene after Hydration
Alternatively, the fixing of carbon from CO2 could lead to new -CO2H groups on the model.
It is known that ultrasound makes cavitation bubbles, and when they collapse local regions have extremely high temperatures and pressures. These temperatures and pressure are so high that they can cleave bonds homolytically.
Figure 33: Structure of Phenanthrene
33
The second model for biochar used in this experiment was styrene oxide.
Figure 35: Styrene Oxide
Styrene oxide served as a good model because of the epoxide functional group.
Biochar can have epoxides between the graphene clusters and can occasionally be on the surface. While the epoxides on biochar and styrene oxide might
undergo similar reactions, the styrene oxide would be more reactive.
Figure 34: Possible Mechanism Steps
34 Experimental Procedure
Safety.
The first study involves the use of phenanthrene. Phenanthrene is a solid that can be harmful if swallowed. It is also a skin, eyes, and respiratory irritant.
Phenanthrene’s melting temperature is at 101°C.
The second study involves the use of styrene oxide. Acute exposure causes skin and eye irritation. Exposure can also cause temporary loss of consciousness and is a suspected carcinogen.
Initial procedure
The conditions used in the following procedure were chosen to match conditions where an increase of %C and %H were found when using biochar.
In this procedure, 7.5 g of phenanthrene was used and ground to a size of 160 μm. The phenanthrene was suspended in 125 mL of water. The mixture was pre-bubbled with CO2 for an hour. The pH was measured. From there the mixture was put in a QSonica Q700 Ultrasonic reactor producing ultrasound of 20 kHz US at 50% amplitude for 240 sec. The temperature was adjusted to 19°C (60°F).
Following ultrasound, the solid was collected by filtration and the filtrate was extracted with CH2Cl2 to isolate the organic model compound and any reaction products from it. From there, the samples were analyzed using NMR, FTIR, and combustion (elemental) analysis.
35 Addition of Biochar
After inconclusive results from the initial procedure (see Results), biochar was added to the system in case it acts as a required catalyst for the effect of treatment on the phenanthrene structure.
In this procedure, 6.75 g of phenanthrene and 0.75 g of biochar were used and ground together to a size of 160 μm. The mixture was suspended in 125 mL of water. The mixture was pre-bubbled with CO2 for 30 minutes. The pH was measured both before CO2 bubbling and after. From there the mixture was put under ultrasound of 20 kHz US at 50% amplitude for 240 sec. The temperature was adjusted to 19°C (60°F).
The resulting solid was collected by filtration. After filtration, the solid recovered was put in the oven to insure no water was present. The aqueous filtrate was extracted with CH2Cl2 and the organic solvent was removed by rotary evaporation to isolate any water-soluble organic material. From there, the
samples were analyzed using NMR, FTIR, and combustion analysis.
The next procedure called for sonicating a 1:1 ratio of biochar to phenanthrene. 2.03 g of phenanthrene and 2.01 g of biochar were mixed and ground to a size of 160 μm. The mixture was suspended in 67 mL of water. The mixture was pre-bubbled in CO2 for 30 minutes. The pH was measured both before CO2 bubbling and after. From there the mixture was put under ultrasound of 20 kHz US at 50% amplitude for 240 sec. The temperature was adjusted to 19°C (60°F).
The solid was collected by filtration. After filtration the solid recovered was put in the drier to insure no water was present. The filtrate was extracted with
36
CH2Cl2. From there, the samples were analyzed using NMR, FTIR, and
combustion analysis. The next step was to remove as much phenanthrene and converted phenanthrene as possible from the biochar. To remove the
phenanthrene, CH2Cl2 was poured into the solid sample. The phenanthrene dissolved into the CH2Cl2 and filtered through the biochar. The CH2Cl2 was evaporated off to leave the phenanthrene.
Replacing Phenanthrene with Styrene Oxide
After inconclusive results from the use of phenanthrene, styrene oxide replaced phenanthrene as the model and biochar was kept at a 1:1 ratio.
A 1:1 ratio of biochar to styrene oxide was used. 1.996 g of styrene oxide and 2.001 g of biochar was mixed. The mixture was suspended in 67 mL of water. The pH of the mixture was taken and then the mixture was then pre-
bubbled in CO2 for 30 minutes. The pH was measured again after CO2 bubbling.
From there, the mixture was put under ultrasound at 240 sec of 20 kHz US at 50% amplitude. The temperature was adjusted to 19°C (60°F) and rose to 48°C (118.4 °F).
The solid was collected by filtration. After filtration the solid recovered was put in the oven to remove any water present. The filtrate was extracted with CH2Cl2 and water. Samples from the aqueous and organic phases of the filtrate were analyzed using NMR and FTIR. The next step was to remove as much styrene oxide as possible from the biochar. To remove the styrene oxide, CH2Cl2
37
was poured into the solid sample and ground. The styrene oxide partially dissolved into the CH2Cl2 and filtered through the biochar. The CH2Cl2 was dissolved off to leave the styrene oxide. Styrene oxide is slightly soluble in water, so after the solid sample dried, water was poured into the solid sample to attempt to remove any styrene oxide remaining.
Results and Discussion Initial Procedure
Phenanthrene (7.531 g) was suspended in 125 mL of water. I then bubbled carbon dioxide into the mixture for 1 hour. After the hour, the pH of the solution was 3.81, which was very similar to the testing the Chen research group did on biochar during this stage. I then put the mixture under ultrasound of 20 kHz at 50% amplitude for 240 seconds. I collected the sample by filtration and retrieved a mass of the solid = 6.09 g. This was a large loss of mass, but there was a lot of material lost in the extraction process. I also extracted the filtrate with CH2Cl2 and recovered a mass of 1.03 g. Results from the NMR show that this mass was actually CH2Cl2 and there was no recovery of phenanthrene in the filtrate. After this I took NMR samples of pure phenanthrene, the solid collected, and the residue from the filtrate.
38
Figure 36: Pure Phenanthrene Proton NMR
Figure 37: Pure Phenanthrene Carbon NMR
The NMR spectrum of the pure samples agreed with what the literature reports.
39 IR of pure phenanthrene was also taken.
Figure 38: Pure Phenanthrene
Figure 39: Proton NMR of Solid Sample after Ultrasound
40
One peak was of interest, because it was not in the literature. This peak is around 1 ppm. The pure sample has a peak around 1.5 ppm, so we thought after the ultrasound it may have shifted. Adventitious water usually appears in CDCl3
NMR spectra at around 1.5 ppm.
Figure 40: Carbon NMR of Solid Sample after Ultrasound
The carbon NMR showed that there were no new carbon signals and that the reason the peak shifted from the pure sample to the solid after ultrasound was that the NMR was most likely not calibrated the same. This is known because each peak shifted by the same amount.
We were also interested in the filtrate NMR samples. Phenanthrene is not very water soluble, so if some did dissolve in the water we believed it might have had to undergo a physical change.
41
Figure 41: Proton NMR of Filtrate
Figure 42: Carbon NMR of Filtrate
42
While we were hopeful, the spectrum from the filtrate only showed evidence of CH2Cl2. The sample was put into the rotary evaporator and there was no organic material left in the liquid phase. This is not definitive, but does show evidence that no phenanthrene was dissolved in the water.
Addition of Biochar
In this procedure, there was a 9:1 ratio of phenanthrene to biochar. There was 6.757 g of phenanthrene stirred with 0.757 g of biochar. This mixture in water before the CO2 bubbling had a pH of 7.46. After CO2 bubbling, the pH was measured as 4.55. This lower pH compared to the initial procedure could be a result of a reduced CO2 bubble time and the addition of biochar which typically has a pH of around 10. The biochar presumably makes the mixture more basic and the CO2 makes it more acidic via carbonic acid. After filtration, 6.916 g of solid was recovered. An IR scan was taken and showed that the addition of biochar did not change the results.
43
Figure 43: 9:1 Phenanthrene to Biochar after Sonication
The IR from the pure phenanthrene sample was very similar to the IR from the 9:1 ratio of phenanthrene and biochar sample.
When using the 1:1 ratio of phenanthrene and biochar, 2.82 g of solid was recovered. Of the solid that was recovered, 0.557 g of phenanthrene was
recovered. The pH of the mixture before CO2 bubbling was 7.69 and after bubbling was 5.14. An IR of the solid was taken.
44
Figure 44: 1:1 Phenanthrene to Biochar IR after Sonication
The IR is not as clear as previous, but the major trends are the same. The NMR results provide further evidence that the phenanthrene after sonication is
chemically the same as phenanthrene before sonication.
45
Figure 45: 1:1 Phenanthrene to Biochar NMR after Sonication
The NMR from the product after sonication and filtering out biochar has the same peaks as pure phenanthrene indicating that no chemical change took place. To futher validate that no change took place, combustion analysis was performed.
Table 1: Results from Combustion Analysis
Lab Customer Carbon Hydrogen
Sample ID Sample ID % w/w % w/w
19H01362-001 Pure Phenanthrene 94.42 5.56
19H01362-002
Phenanthrene after
sonication 94.51 5.78
The percent of carbon and hydrogen are similar enough to indicate that there was not a change that took place.
46 Styrene Oxide as Model
When styrene oxide was chosen as a model, a NMR and IR were taken to compare with samples after sonication.
Figure 46: ATR Pure Styrene Oxide
47
Figure 47: NMR of Pure Styrene Oxide
This experiment was performed on a 1:1 ratio of styrene oxide to biochar. Before CO2 bubbling the pH was measured at 6.81 and after the pH was measured to be 4.78. After filtration, there was 0.327 g of product recovered from the aqueous filtrate and 0.327 g of product recovered from the organic filtrate. After grinding CH2Cl2 with the biochar, 0.075 g of additional product was recovered from the solid. In total, 0.729 g of product was recovered giving a total mass recovery of 36.45%. An NMR and ATR was taken of the product recovered from the aqueous phase of the filtrate.
48
Figure 48: Product Recovered from Aqueous Phase of Filtrate
The aqueous phase compound’s IR is clearly different from the styrene oxide IR.
This spectrum is a match for styrene glycol. In the water, the epoxide ring
opened with water to make a glycol. An NMR of the product was taken to confirm results.
49
Figure 49: Product from Aqueous Phase of Filtrate
The CO2 bubbling could provide an acidic environment for the reaction to take place. The high heat from the sonication could also provide means for the reaction.
50
Figure 50: Possible Reaction Mechanism under Acidic Conditions
Figure 51: Possible Reaction Mechanism under High Temperatures
51
In this case, the diol is water soluble which is why it was found in the aqueous phase. The addition of water will increase the %H and %O and decrease the %C.
Table 2: Comparing Change in % Composition of Carbon, Hydrogen, and Oxygen. *biochar values from table 6 Variables governing the initial stages of the
synergisms of ultrasonic treatment of biochar in water with dissolved CO28.
Sample % Carbon % Hydrogen % Oxygen
Styrene Oxide 79.97 6.71 13.32
Styrene Glycol 69.55 7.30 23.16
Biochar Before Treatment*
85.22 1.32 6.85
Biochar After Treatment*
85.09 1.77 7.38
Table 1 shows that after sonication, in the case of both the styrene oxide and biochar, the %H and %O increased and the %C decreased. Based on these results it is reasonable to conclude that the increased of overall %H and %O could be the result of epoxide functional groups in the presence of water becoming diols. Since no C-H bonds are formed, and the extra oxygen and hydrogen is introduced, the heating value should not increase.
(0.3491 XC + 1.1783 XH + 0.1005 XS – 0.0151 XN –0.1034 XO – 0.0211Xash) Eq 12
52
Equation 1 is used to calculate the heating value in kJ/g from the % composition.
In this case the heating value of styrene oxide is 34.45 kJ/g and the heating value of styrene glycol is 30.49 kJ/g. This shows that the heating value has decreased and is not energetically useful.
Conclusion
In conclusion, no evidence was obtained that treatment of phenanthrene with ultrasound in saturated aqueous CO2 resulted in a chemical change, whether or not biochar was present. While phenanthrene was unchanged, styrene oxide in the presence of water forms styrene glycol resulting in an increase of %H and %O. This is similar to the changes present found by the Chen research group providing evidence that the increase of %H could be the result of epoxides turning into diols during sonication. While there is evidence to support the increase of % composition of hydrogen and oxygen, the heating value would decrease making it energetically not useful.
53 References
1. Abdul, G., Zhu, X., & Chen, B. (2017). Structural characteristics of biochar-graphene nanosheet composites and their adsorption
performance for phthalic acid esters. Chemical Engineering Journal, 319, 9-20. doi:10.1016/j.cej.2017.02.074
2. Channiwala SA, Parikh PP. "A unified correlation for estimating HHV of solid, liquid and gaseous fuels." Fuel 2002;81(8):1051-63.
3. Chen, W., Mattern, D. L., Okinedo, E., Senter, J. C., Mattei, A. A., &
Redwine, C. W. (2014). Photochemical and acoustic interactions of biochar with CO2 and H2O: Applications in power generation and CO2 capture. AIChE Journal, 60(3), 1054-1065. doi:10.1002/aic.14347
4. Dave, S. H., Gong, C., Robertson, A. W., Warner, J. H., & Grossman, J.
C. (2016). Chemistry and structure of graphene oxide via direct imaging.
ACS Nano, 10(8), 7515-7522. doi:10.1021/acsnano.6b02391 5. Harris, P. J. F., Liu, Z., & Suenaga, K. (2008). Imaging the atomic
structure of activated carbon. Journal of Physics: Condensed Matter, 20(36), 362201. doi:10.1088/0953-8984/20/36/362201
6. Horn C, Roy K, Frank P, Just T. Shock-tube study on the high-
temperature pyrolysis of phenol. 27th Int Symp Combustion. 1998:321–
328.
7. Sajjadi, B., Broome, J. W., Chen, W. Y., Mattern, D. L., Egiebor, N. O., Hammer, N., & Smith, C. L. (2019). Urea functionalization of ultrasound- treated biochar: A feasible strategy for enhancing heavy metal adsorption capacity. Ultrasonics - Sonochemistry, 51, 20-30.
doi:10.1016/j.ultsonch.2018.09.015
8. Sajjadi, B., Chen, W., Adeniyi, A., Mattern, D. L., Mobley, J., Huang, C., &
Fan, R. (2019). Variables governing the initial stages of the synergisms of ultrasonic treatment of biochar in water with dissolved CO2. Fuel, 235, 1131-1145. doi:10.1016/j.fuel.2018.08.077
54
9. Song, B., Tang, J., Zhen, M., & Liu, X. (2019). Influence of graphene oxide and biochar on anaerobic degradation of petroleum hydrocarbons. Journal of Bioscience and Bioengineering, doi:10.1016/j.jbiosc.2019.01.006
10. Yoon, Y., Breshike, C. J., Kendziora, C. A., Furstenberg, R., & McGill, R.
A. (2019). Reduction of speckle noise and mitigation of beam wander in tunable external cavity quantum cascade lasers using rotating
diamond/KBr pellet coupled with multimode fiber. Optics Express, 27(6), 8011. doi:10.1364/OE.27.008011