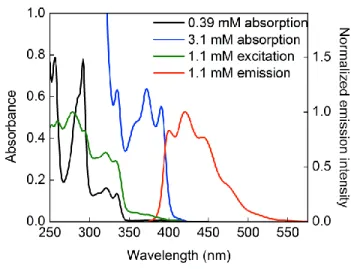
Richardson for showing me the beauty in the humanities, which is truly half of me. 130 Figure A.9: UV-vis spectra of [Li(MeCN)][Cu(carbazolide)2] at different concentrations in CH3CN at room temperature in 1 mm cuvette.
Introduction
Motivations
Photoinduced, Copper-Catalyzed Cross-Coupling Reactions
Photoredox Catalysis for Nitrite Reduction
Time-Resolved Laser Spectroscopy
Chapter Summaries
Photoinduced, Copper-Catalyzed Alkylation of Amines: A Mechanistic
Introduction
Results and Discussion
- Background
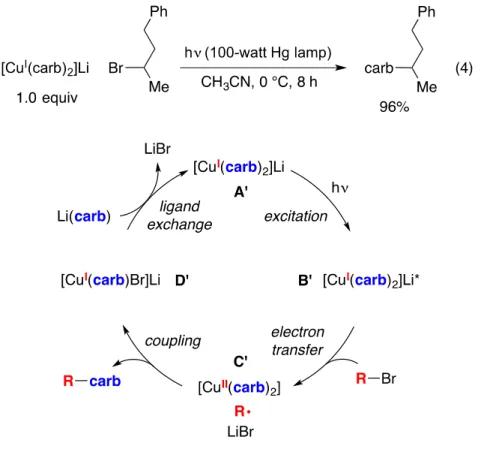
- Stoichiometric coupling of [Cu I (carb) 2 ]Li (1) with an alkyl bromide
- Excitation of [Cu I (carb) 2 ]Li
- Single electron transfer (SET) from [Cu I (carb) 2 ]Li* to an alkyl bromide
- SET from [Li(carb)]* to an alkyl bromide
- Evidence for the presence of [Cu I (carb) 2 ]Li under catalysis conditions
- Evidence for the presence of [Cu II (carb) 3 ]Li (2) under catalysis conditions
- Evidence for out-of-cage C–N bond formation via a free-radical intermediate
- Evaluation of a radical chain mechanism under catalysis conditions
Conclusions
Introduction
Results and Discussion
- Optimization and Scope
- Mechanistic Observations
Conclusion
Photocatalytic Nitrite Reduction on Heterobimetallic Cobalt-
Introduction
Other monometallic complexes that catalyze N-O bond cleavage of nitrites to generate transition metal nitrosyl intermediates and release N2O include Van Eldik's Fe phthalocyanine8 and Ford's heme9 systems. However, the mechanism of N-N bond formation in the phthalocyanine platform is unexplored, and the heme iron nitrosyl complex was shown to release free HNO upon protonation, which can dimerize to form N2O (Scheme 4.1, Path a). There are also a variety of heterogeneous systems that can catalyze the reduction of ·NO to N2O.
One generally accepted mechanism for N-N coupling on surfaces is through NO dissociation to an oxide and a nitride, followed by the surface-bound nitride interacting with a neighboring adsorbed NO (Scheme 4.1, Path b).11 Computational- and experimental results also suggest an alternative mechanism in which two NO molecules link to generate adsorbed (NO)2 (a hyponitrite intermediate). Considering the mechanistic uncertainties surrounding NOx reduction catalysis in biological, molecular and surface systems, there is a need for fundamental studies on the nature of the N-N bond formation step.
Results and Discussion
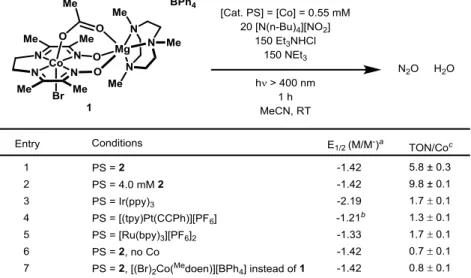
- Photocatalysis with [(Br)(μ-OAc)Co( Me doen)Mg(Me 3 TACN)][BPh 4 ] (1)
- Identification of (NO 2 )Co( Me doen)Mg(Me 3 TACN) complex under
- Characterization and reactivity of a {CoNO} 9 complex
- N–N Coupling Step
All the compounds shown in Figure 4.1 have been isolated and thoroughly characterized.5 It has been suggested that the Co(III) acetate pre-catalyst is able to exchange the acetate for a nitrite ligand and to Co(I ) to be reduced to (μ-NO2)Co(Medoene)Mg(Me3TACN) (3). We first turned to optical spectroscopy to identify which, if any, of the complexes in the proposed mechanism in Figure 4.1 were generated during photocatalysis. Therefore, we first studied the behavior of the {CoNO}9 complex resulting from reduction of 4 since this complex is competent for N2O generation in the presence of acid.
Reduction of both 4 and 5 gave identical EPR spectra (Figure 4.3b), demonstrating that reduction is accompanied by loss. In the presence of nitrite, the UV-Vis spectrum of the reduction of 4 (Co(III)) to the {CoNO}9 species reveals the appearance of the Co(I)-NO2 intermediate 3, which has a characteristic peak at 700 nm (Figure 4.4).
Conclusions
While a crystal structure of 5 confirms the 5-coordinate structure of the Co-nitrosyl complex, the identity of the Mg-coordinated species is unclear. Using either the photosensitizer/triethylamine combination or cobaltocene as the reducing agent resulted in the same EPR spectrum. 25. This experiment was performed in the absence of nitrite because it would not be possible to distinguish between water generated from catalysis and exchanging its aquo ligand with deuterated acid to form 4 from 3 .
The rate-determining step of the photocatalytic reaction is the reduction step, which is first order in 4, zero order in the acid, and zero order in the nitrite. The slow reaction of 4 and NO to generate N2O was first order with NO and first order with 4 and zero order with the acid.
General Information
Steady-state fluorimetry and time-resolved transient absorption and luminescence measurements were performed at the Beckman Institute Laser Resource Center (BILRC; California Institute of Technology). Samples for room temperature transient absorption and luminescence measurements were prepared in dry (pass through aluminum three times), degassed acetonitrile (three freeze-pump-thaw cycles) inside a nitrogen-filled glovebox and transferred in a 1 cm or 1 mm box. Path-length quartz or glass fused cuvette (Starna Cells) which was sealed with a high-vacuum Teflon valve (Kontes), or a Harrick demountable liquid flow cell (DLC-S25) with quartz window and Teflon separator with a path length of 100 μm. For transient luminescence and absorption on the nanosecond to microsecond time scale, was used as the excitation pulse source.
Probe light for transient absorption kinetics measurements was provided by a 75-W arc lamp (PTI model A 1010) operated in continuous wave or pulse mode. Transient absorption difference spectra were collected using the same excitation source (λex = 355 nm) and a white light flash source with a nanosecond duration.

Preparation of Substrates
The resulting yellow solution was allowed to stir at room temperature for 6 h and diluted with Et2O (~250 mL). The suspension was filtered through a pad of silica over MgSO 4 and concentrated under reduced pressure on a rotary evaporator. This solution was added to a solution of tetrabutylammonium fluoride (30 mL, 1 M in THF) at room temperature over 5 min.
Excess trimethylamine (28 mL) was added after 1 h at 78 °C and the mixture was allowed to warm to ambient temperature. The aqueous layer was extracted with Et 2 O (2 x 50 mL) and the organic layer was dried over Na 2 SO 4 , filtered and concentrated under reduced pressure on a rotary evaporator.
Procedures for Photoinduced Cross-Couplings
- General procedure for the coupling of alkyl bromides
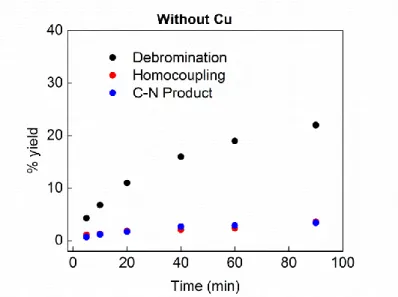
- Procedure for the photolytic reaction in the absence of copper
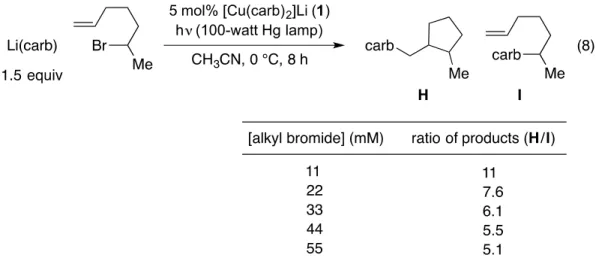
- Procedure for standard photolytic reactions at varying reaction concentrations
- Procedure for stoichiometric coupling of [Cu I (carb) 2 ]Li* with 2-bromo-4-
- Procedure for the time-course analysis of reactions with and without
Lithium carbazolide (0.2 mmol) and alkyl bromide (0.13 mmol) were added to a 4 mL borosilicate vial in the glove compartment under a nitrogen atmosphere. Desired amounts of each were transferred to a 4 ml borosilicate vial and the mixture was diluted to a total volume of 4 ml with acetonitrile. The vial was subjected to standard photolytic conditions and the products were analyzed by GC.
Desired amounts of each were transferred to a 4 mL borosilicate vial as described in the general procedure, and the vial was diluted to a total of 4 mL with acetonitrile. The vial was exposed to standard photolytic conditions for the specified time and the products were analyzed by GC.
Preparation of Metal Carbazolides
- Preparation of [Li(MeCN) n ][Cu(carbazolide) 2 ]
- Preparation of Li(carbazolide) (13390-92-6)
- Preparation of [K(benzo-15-crown-5) 2 ][Cu II (carbazolide) 3 ]
The mixture was allowed to stand overnight at -70 °C to give a deep blue suspension containing a deep blue precipitate.
![Figure A.4: X-Band EPR spectra of [K(benzo-15-crown-5) 2 ][Cu II (carbazolide) 3 ] in butyronitrile glass (black trace, 77 K) and in the solid-state (blue trace, 77 K)](https://thumb-ap.123doks.com/thumbv2/123dok/10401066.0/151.918.287.686.648.955/figure-band-spectra-benzo-crown-carbazolide-butyronitrile-glass.webp)
Procedures for Freeze-Quench EPR Studies
- Stoichiometric reaction between [Li(MeCN)][Cu(carb) 2 ] and 2-bromo-4-
- Detection of EPR active [Li(CH 3 CN) n ][Cu II (carb) 3 ] in a catalytic reaction
- Generation and detection of EPR active [Li(CH 3 CN) n ][Cu II (carb) 3 ] via
- Detection of EPR active [Li(CH 3 CN) n ][Cu II (carb) 3 ] via oxidation of
The deep blue solution was allowed to stir for 5 min before transferring a portion to a butyronitrile solution in an acetone/dry ice bath. To this frozen layer was added a 200 μL solution of tris(4-bromophenyl)ammoniumyl hexachloroantimonate ("Magic Blue", 3.4 mg, 0.0042 mmol) in butyronitrile. Black trace: mixture of [CuI(carb)2]Li and 2-bromo-4-phenylbutane (5 equiv) in cryogenic butyronitrile after irradiation at 350 nm; Red trace: mixture of [CuI(carb)2]Li and Magic Blue (0.2 equiv) in butyronitrile at –80 °C;.
![Figure A.5: EPR spectra (9.4 GHz, 77 K). Black trace: mixture of [Cu I (carb) 2 ]Li and 2- 2-bromo-4-phenylbutane (5 equiv) in freezing butyronitrile upon irradiation at 350 nm; red trace: mixture of [Cu I (carb) 2 ]Li and Magic Blue (0.2 equiv)](https://thumb-ap.123doks.com/thumbv2/123dok/10401066.0/154.918.234.742.107.497/figure-spectra-mixture-phenylbutane-freezing-butyronitrile-irradiation-mixture.webp)
Procedures for UV-vis studies
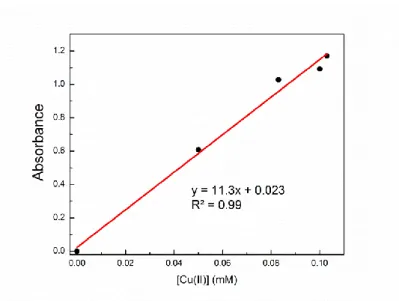
- Molar absorptivity of [Li(CH 3 CN) n ][Cu II (carb) 3 ] at 580 nm
- Detection of [Li(CH 3 CN) n ][Cu II (carb) 3 ] during catalysis
- Generation and detection of [Li(CH 3 CN) n ][Cu II (carb) 3 ] via oxidation of
- Molar absorptivity of [Li(MeCN)][Cu(carbazolide) 2 ] at 365 nm
- Molar absorptivity of lithium carbazolide at 365 nm
In a glove box atmosphere, a 4 ml butyronitrile solution containing [Li(MeCN)n][Cu(carbazolide) 2 ] (0.037 mmol) and lithium carbazolide (0.074 mmol) was added. The sample lock was opened and the Magic Blue solution was added to the mixture with vigorous stirring. Each solution was pipetted into a 1 mm path length cuvette and absorbance spectra at room temperature were obtained for each concentration.
A 10 mM solution of lithium carbazolide was made, and this solution was used as a stock to generate solutions of lower concentration of the complex. The molar absorbance at 365 nm for lithium carbazolide concentrations greater than 0.4 mM was found to be 2200 M–1 cm–1.
Procedures for DOSY Analysis
Actinometric Studies
- Determination of light intensity
- Determination of quantum yield for stoichiometric model reaction
The reaction mixture was allowed to cool to 0°C with an internal cooling loop in a cuvette holder. After irradiation, the reaction mixture was diluted with diethyl ether and dodecane as an internal standard.
Stern-Volmer Quenching and Determining Quenching Efficiency
- Quenching of [Li(MeCN)][Cu(carbazolide) 2 ] with electrophile
- Quenching of lithium carbazolide with electrophile
- Self-quenching of [Li(MeCN)][Cu(carbazolide) 2 ]
- Self-quenching of lithium carbazolide
- Quenching efficiency of lithium carbazolide
An equal amount of lithium carbazolide was weighed into four other volumetric flasks, but only ~5 mL of acetonitrile was added. Lithium carbazolide (43.3 mg, 0.25 mmol) was diluted in 5 mL of acetonitrile to make a 0.05 M solution (concentration in catalytic reactions). The excited-state lifetime of lithium carbazolide as a function of electrophile concentration was measured by transient absorbance spectroscopy (λpump = 355 nm, λprobe = 580 nm).
This value for the quenching fraction implies that 33% of all lithium carbazolide excited states generated are quenched by the electrophile. Solvation was treated with the conductor-like screening model, using standard parameters for acetonitrile in all cases.14 For [CuII(carb)3]–, the Loewdin spin density shown in Figure 2.11 was derived from a constrained optimization where N-Cu -N angles and The C(1)-C(9a)-N-Cu dihedrals along each carbazole were constrained to match the angles of the experimentally determined solid crystal structure.
![Figure A.14: Transient absorbance decays for [Li(MeCN)][Cu(carbazolide) 2 ] with varying electrophile concentrations.](https://thumb-ap.123doks.com/thumbv2/123dok/10401066.0/166.918.288.685.108.410/figure-transient-absorbance-decays-carbazolide-varying-electrophile-concentrations.webp)
- Decomposition of [Li(CH 3 CN) n ][Cu II (carb) 3 ]
- Decomposition of [Li(CH 3 CN) n ][Cu II (carb) 3 ] in the presence of TEMPO–H
Computational Methods
The Orca 3.0.1 program was used for all calculations.11 All optimizations and energy calculations were performed with tight convergence criteria using the M06-l functional12 and def2-TSVP basis sets.13 Open- and closed-shell species were modeled within the unconstrained and constrained Kohn-Sham formalisms or The energy was derived from an unconstrained optimization. Time-dependent DFT calculations were performed using the M06l functional within the Tamm-Dancoff approximation using the def2-TSVP basis set. Solvation was treated with the conductor-like screening model using values of ε = 20 and η = 1.38 for butyronitrile.
Due to the shallow nature of the potential energy surface, a precise transition state could not be located. The donor orbital is shown in red and the acceptor orbital in blue.
![Figure A.21: Relaxed surface scan for the reaction between [Cu I (carb) 2 ] - and carb radical](https://thumb-ap.123doks.com/thumbv2/123dok/10401066.0/176.918.243.725.112.401/figure-relaxed-surface-scan-reaction-carb-carb-radical.webp)
Characterization data for new coupling products
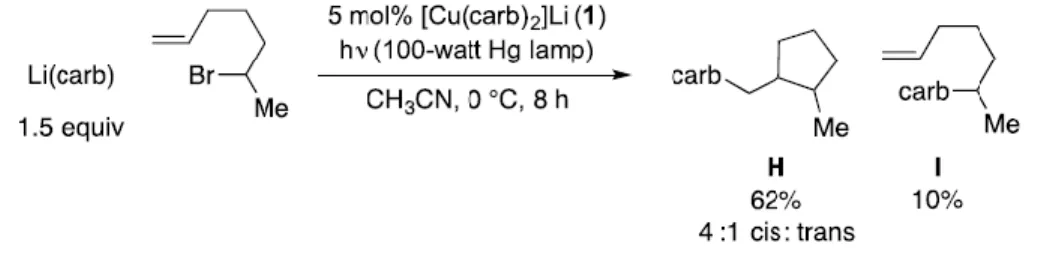
Following the general coupling procedure for 6-bromohept-1-ene, the title compound could be obtained as a mixture of diastereomers after column chromatography (hexanes → 1% . ethyl acetate/hexanes) as a colorless solid. Following the general coupling procedure with ( E )-6-bromohept-1-ene-1-d , the title compound could be obtained as a mixture of diastereomers after column chromatography (hexanes → 1% ethyl acetate/hexanes) as e colorless solid. The difference in correlation magnitude is consistent with the cis configuration in a 5-membered ring.

X-Ray Crystallography Data
General Information
Preparation of Electrophiles
Photoinduced, Copper-Catalyzed Cyanation Reactions
Electrophile Competition Experiments
General Information
Procedure for Photocatalytic Nitrite Reduction
UV-Vis Absorbance and Fluorimetry Experiments
Stern-Volmer Quenching
EPR Spectroscopy of {CoNO} 9
Infrared Spectroscopy
GC-MS Data
Step-scan TRIR Data
DFT Calculations
X-Ray Structure of 5
The lifetime of [CuI(carb)2]Li* in CH3CN decreases with increasing alkyl bromide concentration (Figure 2.3b), and the second-order rate constant for quenching is 4.8 × 10⁶ M-1 s-1. As in the case of the original mechanism (Figure 2.2),16 the key step of C-N bond formation is the reaction of an alkyl radical with a Cu(II)-carbazolide complex, but the pathway for the formation of these intermediates is different. Next, using UV-vis spectroscopy, we have examined the aggregation of the stable radical, [CuII(carb)3]Li (2), under our standard conditions for a catalyzed coupling (eq 3).
We turned to the radical cyclization probe to gain insight into the C–N bond formation step of the catalytic cycle. When copper-catalyzed photoinduced cross-coupling takes place in the presence of TEMPO, a significant amount of TEMPO adducts (arising from the capture of an uncyclized secondary radical or a cyclized primary radical) is observed. In situ generation of the alkyl iodide could increase the efficiency of the pathway shown in Figure 3.1, for example, by facilitating excited-state electron transfer from complex B to the alkyl halide.
The 1H NMR spectrum of the oil matched that of hex-5-en-1-ol except for resonances corresponding to the deuterated vinylic proton. The 1H NMR spectrum of the oil matched that of hept-6-en-2-ol except for resonances corresponding to the deuterated vinylic proton. The EPR spectrum of the crude mixture showed complete conversion of CuBr2 to CuII(carbazolide)3-.