My achievement was possible because of the endless love and encouragement of my husband Nicholas. The basis of most current clay suspension behavior is based on early studies carried out before the application of colloidal concepts in ceramic systems and also when many of the colloidal theories were developed. Technological advances in colloid science and the application of the theories greatly improve the interpretation of the clay suspension behavior.
It is suggested that the magnitude of the cohesive stress directly influences the ductility and stress gradients established during drying.
INTRODUCTION
The additives were normalized to the surface area of the powders and the pH of the suspension was monitored. These results indicate the specific adsorption of anionic species causing dispersion in the clay. For additional support, electrophoretic mobility measurements were used to evaluate the influence of anions and cations on the dispersion and coagulation of the clay suspension.
Zeta potential (ζ-potential) values were calculated using electrophoretic mobility measurements of clay particles in suspension.
LITERATURE SURVEY
The exchange capacity is a function of the surface area and the charge on the surface. Theoretically, these two terms indicate the potential energy (VT) of the system and its derivative. The pressure and measured potential, which is determined across the particle network or the plug, provide the charging information of the system.
Gravity or centrifugal force drives the settlement and the potential of the system can be determined. Quirk, “Effect of polymer adsorption on the properties of the electrical double layer,” Faraday Discuss. Schwartz, "Fundamental study of clay: XII, a note on the effect of surface tension of water on the plasticity of clay," J.
A CRITICAL EVALUATION OF DISPERSANTS
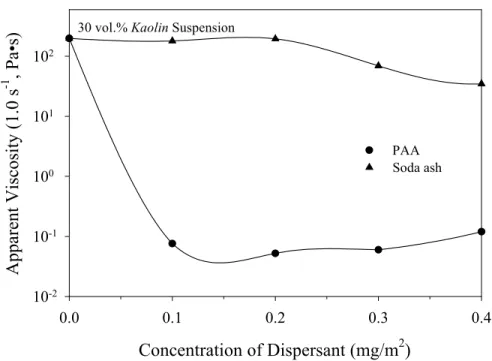
The effectiveness of the dispersant was measured by the change in apparent viscosity as a function of dispersant concentration. Due to the higher viscosity of the kaolin suspensions compared to the batch suspensions (attributed to differences in particle packing and morphology), the kaolin suspensions were prepared at a lower solids loading (30 v/o) than used for the batch suspensions becomes (40 f/o). The abbreviation v/o represents volume percentage.). The amount of dispersant added to the suspensions was based on the surface area of the suspension.
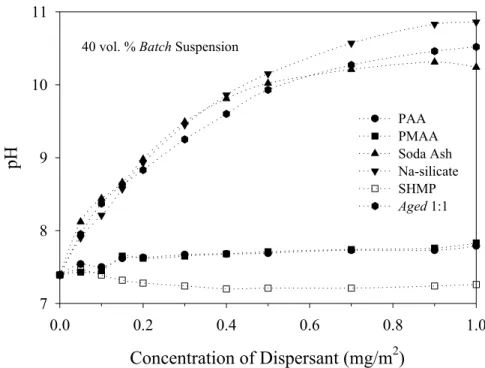
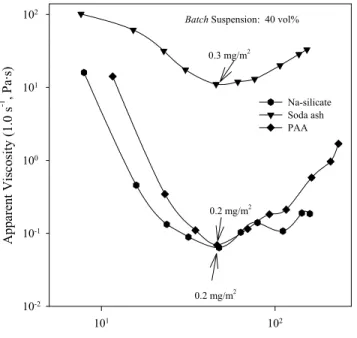
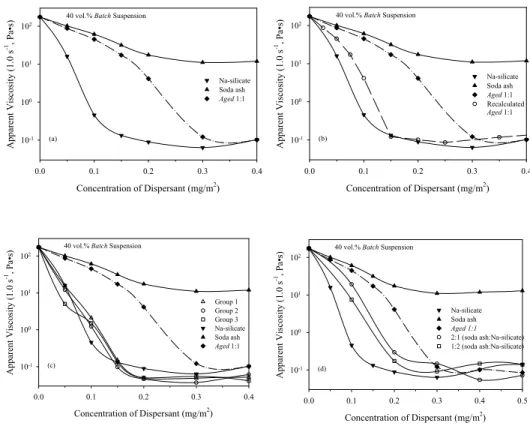
The apparent viscosity curves of the batch suspension shown in Figure 3-2 clearly illustrate that the Na silicate and the PAA both disperse equally well, and are independent of the change in suspension pH. The pH of the suspension as a function of dispersant concentration, for all six dispersants in the batch suspension. The apparent viscosity at 1.0 s-1 of the batch suspensions as a function of dispersant concentration (a) PAA and PMAA and (b) Na silicate, SHMP, sodium carbonate and aged 1:1 in the batch suspension.
The apparent viscosity behavior of this suspension begins by following the path of the ineffective dispersant, soda ash. The rheology of soda ash and Na-silicate suspensions is illustrated in Figure 3-5 along with the results for the aged 1:1 suspension. The behavior of the old 1:1 curve is similar to the soda ash curve, but at 0.3 mg/m2 it follows the behavior of the Na-silicate curve.
The behavior of the 1:2 and 2:1 (sodium soda:Na-silicate) suspensions best corresponds to the Na-silicate suspension. The apparent viscosity of the sodium carbonate suspension varied very gradually, by a factor of 10, over the range of dispersant concentration from 0.0 to 1.0 mg/m2. Apparent viscosity as a function of dispersant concentration of batch suspensions containing mixtures of sodium carbonate and sodium silicate.
The apparent viscosity of aged 1:1 shows only the effects of Na silicate and not soda ash.
EFFECTS OF IONIC CONCENTRATION ON RHEOLOGY
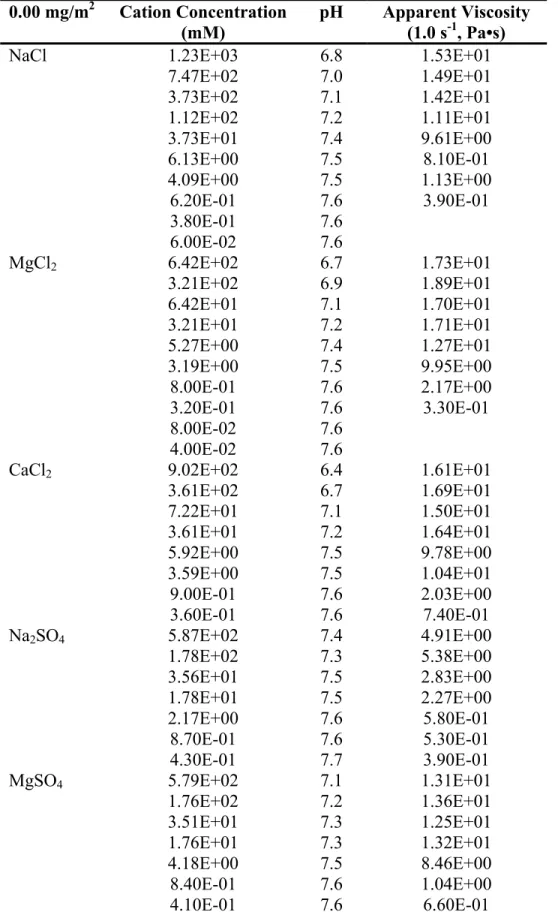
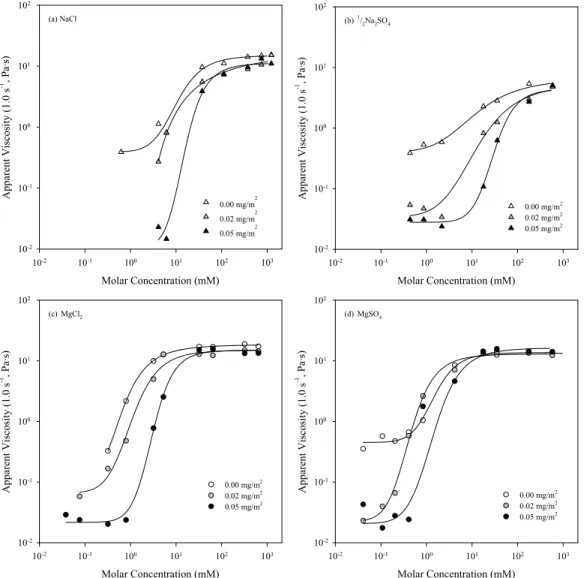
The suspension rheology as a function of cation concentration for all six salts, at the three dispersion levels, is shown in Figure 4-2 and the data are listed in Table VII. These three regions in the apparent viscosity curves are indicators of the particle-particle interactions that control suspension behavior. A plateau in the apparent viscosity values with respect to the initial salt additions defines this region.
The lowest apparent viscosity values indicate that the repulsive forces are sufficient to inhibit agglomeration and interaction between suspension particles despite the salt additions. The critical coagulation concentration (CCC) of the CaCl2 in the suspension occurs within the region where a sudden change in the apparent viscosity occurs. Enough counterions are present to compress the double layer so that the van der Waals forces of attraction begin to dominate the suspension.
CCC is defined in this region as the inflection point of the curve that fits the data points. Region III, which includes the highest salt concentration, shows little change over the maximum apparent viscosity reached in Region II, despite increasing CaCl2 concentration. The structure of the coagulated suspension as measured by apparent viscosity is similar for all salt types and all dispersion levels suggesting that a similar final structure is formed in all cases.
Three distinct regions in the apparent viscosity behavior were observed: Region I was independent of cation additions (dispersed), Region II showed a dramatic change due to cation addition (coagulation onset), and Region III was again independent of cation additions (coagulated). The rheological behavior observed in the suspension across these three regions indicates that the mechanism responsible for coagulation is compression of the bilayer rather than.
Electrolyte 0.00 mg/m 2 0.02 mg/m 2 0.05 mg/m 2
ZETA POTENTIAL MEASUREMENTS ON DISPERSED AND COAGULATED SUSPENSIONS
The ζ-potential is then calculated using the electrophoretic mobility, which is an estimate of the net charge on the particle measured from electrokinetic effects. ζ-potential values were determined by measuring the electrophoretic mobility (Acoustosizer, Colloidal Dynamics, Warwick, RI) of kaolin suspensions. Changing the pH of the suspension changes the dissociation of Na-silicate and would affect the dispersion of the suspension and the value of the ζ-potential.
If the IEP of the clay suspension in the background electrolyte in Figure 5-1 were assumed to have a pH of 4, the IEP of the suspension with Na-silicate would occur at a lower pH. The effects of stepwise additions of three dispersants, PAA, Na-silicate, and soda ash, on the ζ-potential magnitude of the suspension are illustrated in Figure 5-2. The addition of the dispersants increased the ζ-potential of the clay suspensions, suggesting that the anion species are responsible for dispersion.
A comparison of the suspension behavior measured by ζ-potential, pH and apparent viscosity between these three dispersants yielded some unexpected results. First, the ζ-potential and pH of the suspension with soda ash were similar to those observed with Na-silicate. This will be indicated by higher apparent viscosity values with soda ash over that of the Na-silicate.
These curves, PAA additions and PAA with CaCl2 additions, suggest solidification due to compression of the bilayer because there is no shift in the IEP. Based on the ζ-potential measurements and the nature of the clay particle geometry and charge, a shift in the IEP was not observed, which would confirm specific adsorption.

EFFECT OF CATION CONCENTRATION ON PLASTCITY
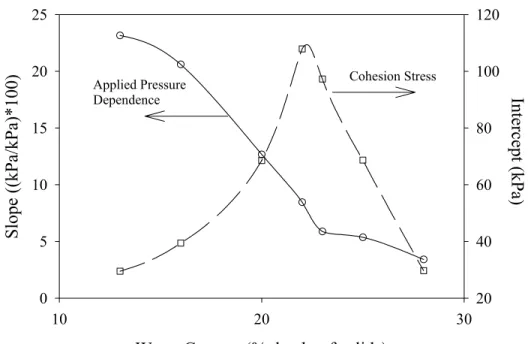
The cohesive stress of a plastic body increases when the water content is reduced to a maximum stress, and then gradually decreases after further water reduction. Dependence of applied pressure and cohesive stress as a function of water content for a clay and plastic body of water.9. The Body A samples were tested immediately after mixing, so the effects of plastic body aging would be.
The slope is a measure of the applied pressure dependence, and the intercept is a measure of the cohesive stress of the plastic body.9-11. At low cation levels, the cohesive tension is high, but decreases at a concentration of about 1.0 mM in the plastic body with a water content of 16%. Therefore, the attractive forces between the particles in a suspension play a role in the behavior of the plastic body.
Furthermore, it suggests that by controlling the suspension chemistry, the plastic body behavior during forming and drying can be improved by reducing the cohesive stress. The plastic body is produced by dewatering the slurry but maintaining the cation concentration. It is suggested that by reducing the maximum cohesive stress of a plastic body, the behavior of the plastic body will be more favorable during drying.
The plasticity of a dispersed and solidified plastic body is compared using the cohesive stress and applied pressure dependence. Increasing the cation concentration in a plastic body decreases the cohesive stress measured by the HPASC.
CONCLUSIONS
From this work it is clear that the Na+ ion is not responsible for dispersing the clay suspension. The anionic species controls the dispersion of the clay suspension, probably due to specific adsorption. Within the pH range studied, the dispersion efficiency, as measured by the apparent viscosity, does not correlate with the pH of the suspension.
The magnitude of the ζ-potential cannot predict suspension stability consistent with the apparent viscosity of a clay suspension. The mixture produces a very effective dispersion that is inconsistent with the amount of Na silicate added to the suspension. Normalizing with respect to the surface area of the clay suspension, the amount of PAA and PMAA required to completely disperse the suspension was 0.20 mg/m2.
Work by Cesarano, et.al.1 indicated that approx. 0.45 mg/m2 was needed to disperse alumina with PAA and PMAA at the same pH as the clay suspension. Based on the available surface area on a clay particle, these two studies support a positive (octahedral surface) and a negative (tetrahedral surface) basal plane on a kaolin particle. Lower concentrations of divalent cations are required to coagulate the clay suspension than of monovalent cations.