Coast Guard and Smithsonian Institution, in consultation and cooperation with the federal members of the Aquatic Nuisance Species Task Force. It covers the two-year period from January 2020 through December 2021 to demonstrate the effectiveness of the Coast Guard's legally mandated BWM regulatory program and validates that enforcement efforts continue to increase BWM and reduce the risk of ANS introduction in the U.S. Reduce. The Coast Guard noted a trend of vessels reporting their inoperable systems prior to arrival, and a 60 percent reduction in the number of discharges of non-compliant BW into US waters4.
2This report uses the term "Overseas BW" to refer to BW discharged in US waters. Evaluating the effects of the national BWM program requires a multifaceted approach, including discharge, (2) Coast Guard compliance and enforcement, and. Thus, regardless of the success of BWM, some level of ANS invasions can be expected to continue in the USA.
VIDA further directed the Coast Guard to prepare each report in consultation and collaboration with the Task Force and SERC. NBIC prepares and submits to the Coast Guard an annual report on the status and trends of BWM commercial vessels in the United States. Data used in this report on the status and trends of ANS invasions of marine and estuarine habitats in the United States
The information in the NEMESIS database is derived from ongoing reviews of the scientific literature and thus reflects the reports of invasions resulting from independent research.
Status and Trends in BW Delivery and Management
Overview
Overseas arrivals are defined as arrivals directly after operating anywhere outside the combined US/Canadian EEZs. Coastwise Arrivals are defined as arrivals directly from last ports or ports of call within the combined US/Canadian EEZs. Note that a vessel must also remain within the combined US/Canadian EEZs prior to arrival to be considered a coastal arrival.
A coastal arrival designation is not related to the country in which a ship is registered or owned (eg, not related to US or foreign flag designation). Overseas BW discharge is defined as ballast water originating or transported anywhere outside the combined US/Canadian EEZs, which is then discharged into US waters. Note, because this designation is defined by the place of origin of the BW, Overseas BW may be present in BW tanks on both overseas and coastal arrivals.
Coastwise BW discharge is defined as ballast water originating from and remaining within the combined US/Canadian EEZs that is then discharged into US waters. Note that because this designation is defined by the BW's place of origin, coastal BW may be present in BW tanks on both overseas and coastal arrivals.
Period of Record 2020 and 2021
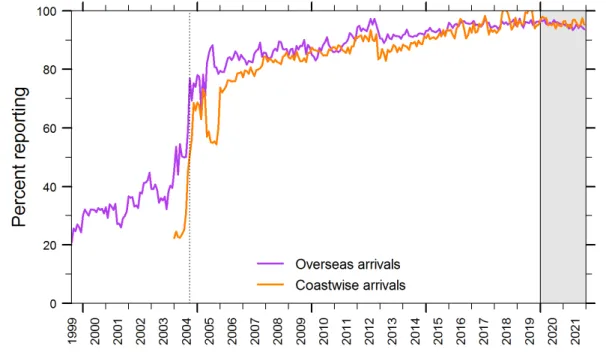
Number of BWMRs received by the NBIC monthly (July 1999 – December 2021). The vertical dashed line indicates when the Coast Guard promulgated BWM regulations that included penalties for non-reporting, and the expansion of mandatory reporting to include vessels making shore-wise arrivals. Percentage reporting by overseas and shore-wise arrivals compared to the corresponding number of eligible arrivals of the respective arrival types (see box 1). The vertical dashed line indicates when the Coast Guard promulgated BWM regulations, including penalties for non-reporting, and the expansion of mandatory reporting to include vessels making shore-wise arrivals.
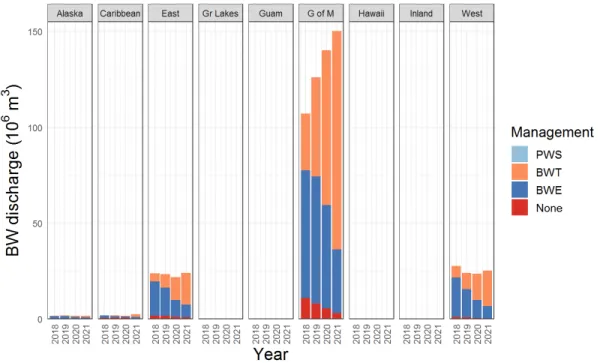
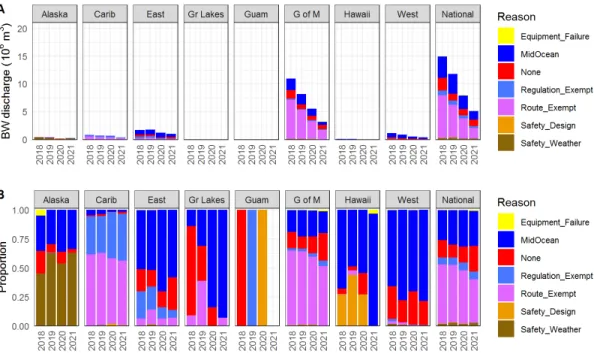
This change reflects a 15.2 percent increase16 in average annual discharges for overseas discharges compared to the previous two-year period (2018 and 2019) and a 10.7 percent decrease in coastal discharges, coinciding with the slowdown in shipping due to the COVID-19 disease. This change was particularly noticeable in 2020-2021, when emissions per capita increased while overseas arrivals decreased due to the economic slowdown related to COVID-19 (Figure 1), during which time, which caused the peak of releases abroad (Figure 7A). ). 16 In this report, all measures of "percentage change" comparing current to previous time points are relative percentages.
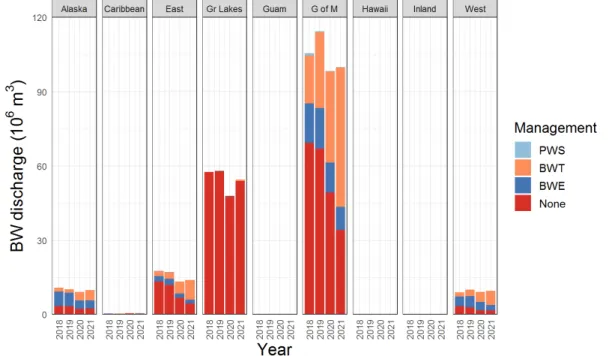
At the same time, the amount of coastal discharges to the Great Lakes and inland waterways remained relatively stable, averaging millions of m3 per year. years (mean ± SEM; 16 years) (Fig. 6B). Coastal discharges to inland areas (ie the Great Lakes and Rivers; B), most of which occurs from non-seagoing vessels currently exempt from BWM requirements. Coastal discharge to . rivers), are mostly by non-seagoing vessels which are currently exempt from BWM requirements. inland regions (ie the Great Lakes and inland.
The most common reason provided for discharging unmanaged BW in the Gulf Coast and Caribbean was en route exclusion (ie, the vessel did not transit at least 200 nm from shore long enough to perform BWE); on the east and west coasts, the most frequently claimed reason was an ocean-to-ocean exchange of BW; and in Alaska and Hawaii, safety exemptions were significant responses (Fig. 10). These increases indicate a significant shift toward installing CGTA BWMS (78.2 percent) rather than AMS (21.8 percent) during this period, compared to the previous two-year period. Number of unique vessels with BWMS. Unique vessels that reported having a CGTA BWMS, an AMS, or no BWMS (none), by year.
2020: There was a noticeable decrease in ship arrivals in the US, which correlated with an overall decrease in PSC exams compared to previous years. In 2020, the Coast Guard administered 7,383 PSC exams, including examinations of vessels' compliance with BWM requirements. The number of exams fell by 9.3 percent between 2018 and 2020, reflecting the impact of the COVID-19 pandemic on international shipping.
In most cases where the discharge of BW could pose a threat to the marine environment, vessels were required to modify their cargo plans to facilitate safe and compliant discharges of BW, leading to costly unforeseen scheduling conflicts. port. Incomplete BWM plans (22 percent) and failures to report BWM practices to NBIC (13. percent) also ranked high among deficiencies noted by Coast Guard PSC Examiners.

Conclusions
Status and Trends in Invasions of Aquatic Nuisance Species Resulting from BW
Overview (1990-2021)
To provide a comprehensive summary of all ANS detected in US coastal marine areas, SERC conducts an ongoing synthesis of available information, using these data to evaluate the status and trends of invasions. Second, analysis of these records is used to identify those that are ANS based on current knowledge of the taxonomy and biogeography of the species. The Coast Guard and SERC are working with other partner agencies in the Task Force to identify potential sources of information for freshwater habitats where commercial vessels operate and to incorporate such information as it is available into future versions of the report.
This report documents the cumulative number of new species from the continental US, the West Coast, the East Coast of the United States, and the Gulf Coast, explicitly taking into account invasions since 1990. An additional section reports the number of ANs that have expanded geographically since 1990 spread to new bays or states along each of the three coasts. This report is based entirely on data from NEMESIS, with an emphasis on ANS invasions of continental US marine coastal waters by invertebrates and . information from standardized contemporary studies.
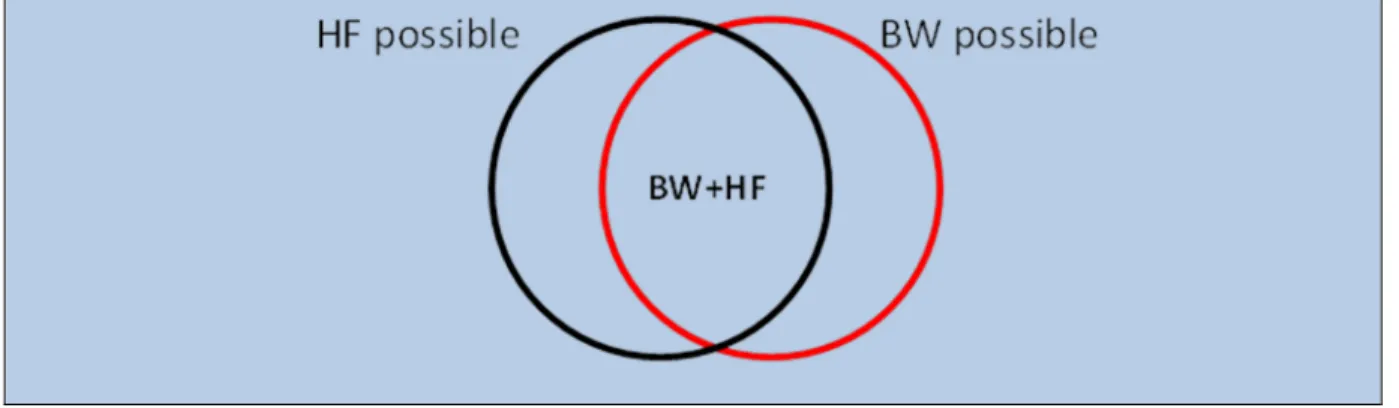
Shipping (including both BW and HF) is the dominant vector of established ANS in coastal marine waters. These findings highlight three key points about invasions in coastal estuaries in the United States, both on a continental scale and for individual coasts. Second, both BW and HF are considered a possible vector for over 50 percent of ANS detected to date.
In addition, other vectors such as mariculture and trade in live products (e.g., seafood and bait) are possible for some ANS transported by BW and HF (Fofonoff et al. 2003, Ruiz et al. 2015). For these new ANS discovered since 1990, 62 percent of all at the continental level (US coastal waters on all three coasts) were linked to BW as a possible carrier. Cumulative number of new ANS per year associated with BW as a possible vector (red line) compared to all entries with any vector (grey line) since 1990.
13 shows the potential contribution of the BW vector to new ANS discovered per year relative to the total number (red and gray lines, respectively) for each geographic region. The shapes of the ANS curves in fig. Specifically, the slopes of the lines may appear to be flatter in recent years, and this slowdown roughly coincides with the 2004 Coast Guard regulation (dashed line) introducing mandatory BWM for overseas vessels. Cumulative number of new ANS per year associated with HF as a possible vector (red line) compared to all introductions (gray line) since 1990.
For the three individual coasts, geographic distribution beyond the initial bay of introduction was documented for 35-54 percent of the recent ANS invasions. Thus, while prevention of new ANS introductions is a major focus of the BWM program, coastal spread adds another dimension to this issue.
New ANS Invasions for the Period 2020-21
Transfer and invasion mechanisms for non-native species on North American coasts. International Maritime Organization (IMO) (2011) Guidelines for the control and management of ship biofouling to minimize the transfer of invasive aquatic species. Ruiz (2018) Estimating commercial vessel wetted surface as flux of biodegradable habitat in the United States.
Turning the tide: C. National Academy Press, Washington, D.C.control of the introductions of. invasion risk in ballast water. Shiba (2011) Marine invasion history and vector analysis of California: a hotspot for western North America. Diversity and Distributions 17:362-373. Ruiz (2014) Small boats provide connectivity for non-native marine species between a heavily invaded international port and nearby coastal ports. Management of Biol.
Comparison of Data from the NBIC and the NVMC
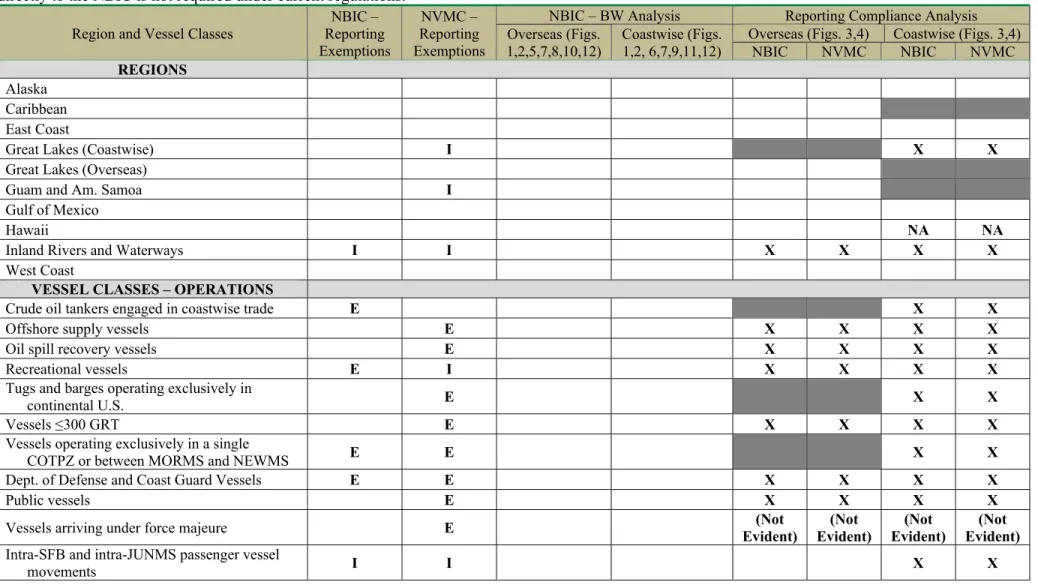
Ship classes marked as “not evident” do not have to report to the NVMC, but were not evident and not explicitly excluded.