from the continental margin of the southwest Caribbean
Daniel A. Rincon
1*, Jose E. Arenas
1, Carlos H. Cuartas
1'
2, Andres L. Cardenas
1, Carlos E. Molinares
1'
2'
3, Claudia Caicedo
1and Carlos Jaramillo
3Biostratigraphy Team, Colombian Petroleum Institute, ICP-ECOPETROL, km. 7 via Piedecuesta, Santander, Colombia Departamento de Geologial \ Universidad EAFIT, Carrera 49 No. 7sur-50, Medellin, Colombia
Smithsonian Tropical Research Institute, Apartado Postal 0843-03092, Balboa, Ancon, Panama email: [email protected]; [email protected]
ABSTRACT: Biostratigraphy in northern Colombia has traditionally been done using foraminifera. Quantitative biostratigraphic tech- niques could improve the zonations that have been proposed for the region. We analyze the biostratigraphic information from 190 planktonic foraminifera species, and 1961 ditch-cutting samples from 26 oil wells in northern Colombia to produce a zonation for the region. A quantitative biostratigraphic technique known as Constrained Optimization was used to analyze the data.
The proposed zonation relies exclusively on last occurrences, which are readily applied to petroleum exploration. It has thirteen zones and eight subzones for the Eocene to Pliocene interval. Three zones and two subzones are defined for the Eocene, three zones for the Oligocene, six zones and six subzones for the Miocene, and one zone for the Pliocene. The zonation reveals three major unconformi- ties: (1) a late Eocene - early Oligocene hiatus; (2) a late Oligocene - early Miocene hiatus; and (3) a late Miocene hiatus; the hiatuses are related to the collision of the Caribbean with the South American plate.
INTRODUCTION
Marine Cenozoic sequences from northern Colombia (south- west Caribbean) have traditionally been dated using biostrati- graphic schemes developed for the southeastern Caribbean (e.g.
Cushman and Renz 1941; Cushman and Stainforth 1945;
Cushman and Renz 1946, 1948; Renz 1948; Bolli 1957b, 1957c; 1959a, 1959b; Blow 1959, 1969; Bermudez 1961;
Stainforth 1969; Postuma 1971; Bolli and Saunders 1985), and several local zonations, based on the analysis of a limited suite of local sections (e.g. Fetters and Sarmiento 1956; Duque-Caro 1968, 1975; Stone 1968). Unfortunately, use of few sections leads to considerable subjective judgment regarding zonation, based on the perceived "true" stratigraphic order of taxa, and rarely gives insight into the actual geographic distribution of taxa and zones (Gradstein and Agterberg 2003).
Over the past 35 years the Empresa Colombiana del Petroleo (Ecopetrol) and its partners have collected a wealth of biostratigraphic data from the analysis of thousands of samples from hundreds of wells over the entire northern Colombia re- gion. This large amount of historic micropaleontological infor- mation was used to produce a planktonic biostratigraphic zonation for the basin, which was calibrated to modern time scales and will help in the integration of other events derived from benthonic foraminifera, nannoplankton, pollen/spores, and dinoflagellates to further improve the resolution of biostratigraphy in the area. Given the amount of data available, a quantitative biostratigraphic technique known as Constrained Optimization was used to analyze the biostratigraphic data. The proposed planktonic foraminiferal biostratigraphic scheme is heavily biased towards using the highest occurrence (HO) events to avoid problems related to caving, and then can be
* Current address: Alfred Wegener Institute, Bremerhaven - Germany.
readily applied to petroleum exploration in the region. A reli- able biostratigraphic model for this region helps in the recon- struction of the history of the collision of the southern Central American volcanic arc with the South American plate and the Andes uplift.
Previous Cenozoic local biostratigraphic zonations
The first zonation for the Cenozoic of northern Colombia was proposed by Fetters and Sarmiento (1956) and was based on the study of benthic and planktonic foraminifera from the Carmen-Zambrano section, which is the reference stratigraphic column of northern Colombia. Even though these zones can be found in several northern Colombia localities, some of them are clearly fades dependent (e.g. Fiorini and Jaramillo, 2006).
Stone (1968) applied Bolli's (1957b) zonation to the same sec- tion used by Fetters and Sarmiento. The application of Bolli's zonation, which was based on planktonic foraminifera from Trinidad, allowed the correlation of northern Colombia with global standard biostratigraphies. Unfortunately, Stone focused only on Bolli's (1957b) zonal markers and did not give a de- tailed stratigraphic distribution of the faunal elements, details which would have been useful for further analysis.
Duque-Caro (1968, 1972a, 1975) produced several biostrati- graphic schemes based on benthic and planktonic foraminifera assemblages, using samples collected during geologic mapping of northern Colombia. Duque-Caro's schemes were focused on stratigraphic unit definitions and citing characteristic taxa for geological mapping. However, his schemes do not specify oper- ational criteria for the recognition of zones (e.g. lowest or high- est occurrence events of taxa).
Martinez (1995), Jaramillo (1999), and Cuartas (2006) applied different quantitative correlation techniques to foraminiferal biostratigraphic data from discrete areas of northern Colombia.
Daniel A. Rincon et al: Eocene - Pliocene planktonic foraminifera biostratigraphy from the continental margin of Southwest Caribbean
TEXT-FIGURE 1
Tectonic and geomorphologic map of the study area. The image shows the main sedimentary provinces and tectonic features (from Pindell et al. 1988;
Case et al. 1990; Cediel et al. 2003) and the location of CONOP+Phi-analyzed (black circles) and Phi-analyzed wells (white circles).
They showed the potential that quantitative techniques have for dealing with large data sets and their application in a sequence stratigraphic sense.
Geological Setting
The study area (text-fig. 1) is located along the northwestern margin of South America. Its tectonic configuration results from the interactions between the Farallon (including Cocos, Nazca, and Caribbean plates) and the North and South Ameri- can plates since Mesozoic times (e.g. Burke 1988; Pindell et al.
1988; Case et al. 1990; Pindell and Barret 1990; Toto and Kellogg 1992; Coates et al. 2003; Coates et al. 2004; Corredor et al. 2003; James 2005; Kellogg et al. 2005). Relative eastward migration of the Caribbean plate along the northwestern South American margin forced the development of a series of major tectono-stratigraphic features, which include from east to west:
the Guajira Province, the Lower Magdalena Valley (LMV), the San Jacinto Folded Belt (SJFB), the Sinu Fold Belt (SFB), the Uraba Basin, and the Panama Arc (text-fig. 1).
The Guajira Sedimentary Province is located in the Guajira Peninsula, northeast of the Santa Marta Massif and north of the Oca fault (text-fig. 1). It is characterized by shallow to deep ma- rine Cenozoic deposits locally separated by an unconformity from either Upper Cretaceous sediments or Proterozoic, Paleo- zoic, and Mesozoic igneous and metamorphic rocks (e.g.
Kroonemberg 1982; Cardona 2003; Cordanii et al. 2005). It in- cludes the Lower and Upper Guajira basins, which are separated by the Cuiza Fault (Duque-Caro and Reyes 1999; text-fig. 1).
The former records Cenozoic sedimentation commencing in Early Miocene time, whereas the latter initiates in the early Middle Eocene (e.g. Duque-Caro and Reyes 1999).
The LMV Province is located south of the Santa Marta Massif;
it is bounded to the east by the Santa Marta-Bucaramanga Fault, to the west by the Romeral Fault System and to the southeast by the Central and Eastern Colombian Cordilleras foothills (text-fig. 1). It is subdivided into the San Jorge and Plato basins, which are separated by the Magangue Arch or Cicuco High
Is
I 1 .
cun_'^^I_'"^im
Scenario 1 Scenario 2
Knuliill'i Tnu-ttSJ
l*'i*m*IL, Him
Tij~ ii i ii
• 4 6"
,_'/'
/ /
y
# at • * «• pm Onlcr Sequence Scciuuiu I
E-.
r -I
S
i-
TEXT-FIGURE 2
Order of events from the constrained optimization scenarios. Scenario 1 uses only HO; Scenario 2 uses HO also, but compensates for edge effects. Hori- zontal lines connect events between scenarios. Metric bars on both sides of the figure indicate the position of the event. Correlation between the se- quences obtained in Scenario 1 and Scenario 2 is also shown. Non-concordant events are marked with the number of the position yielded in Scenario 1.
Daniel A. Rincon et al: Eocene - Pliocene planktonic foraminifera biostratigraphy from the continental margin of Southwest Caribbean
TABLE 1
Proposed sequence of events (HO) yielded by comparison between constrained optimization scenarios 1 and 2. In column A, events marked with "X" are those with the lower penalty levels (Z) and the higher Phi Index over those wells analyzed by constrained optimization scenario 2. In column B, events marked with "o" are those potential zonal markers, with a Phi index value higher than 0.77 calculated using 70 wells. Events are ordered from younger (68) to older (1).
Order Specks HO A B Order Species HO A B
68 Neogloboquadrina pachyderma \ 34 Globigerinoides drmirmia X 0
67 Globoturhorotuiitu decoraperta \ 33 CciHipsydt ax suiinfbrthi \ o
66 Globiget inella praecalida \ 32 Pat •agloborotalia nana X
65 Globigerina ju\ •en ilia 31 Globigerinoides primnrdia X 0
64 Neogioboqttadrina acostaensis X 30 Globorotahides sttteri
63 Globiget inoides ob lit] ua \ 0 29 Catapsydl a.\ dissinliiis X o
62 Sphaeroidinellopsis semimdina 28 Paragioborotalia ktigleri X 0
61 Orbulitui s it tu rails X 27 Dentogloblget ina tripartite! X 11
60 Gtobotltrborotalita nepen thes 26 Globotttrborolalihiotiacbitaensis X 0
59 Glohoq uadhna venezuelana \ 0 25 'Globotitrbtirolalikt angiistiumbilicakt' X 0
58 Orbulimi bilobata (i 24 Global tit -hot otallta ciperoensis X o
57 Globigerinoides trilo ba 23 Dentoglobigerina galavisi X
56 Sphaeroit line!lops is s it bdeh iscens \ 22 Globigeriiw angiitisiituralis X
55 Ghbiirotti/ia merarttmith \ 0 21 Twborotalkt euapermra X
54 Den toghbiget inagio bosa 2(» Pat aglobot •alalia opinia X o
S3 Gtobigeriiioities subqitudrata [9 Dentoglobigerina pseudovenezaelana X 52 Paragioborotalia mayeri X 0 IS Global in -boi •otaliia anguliofficinalis X
51 Globigerinita uvula 17 Snbbotitui gur km ii X
50 Menardetta piaemenardii \ 0 16 Tut •borolalla ampliaperlt ira X 0
4') Fohsella fobs i \ 0 15 Subbotina sentlis X
48 Fohsella peripheroronda \ 0 14 Sttbbolina yeguactisis X o
47 Fohsella praefohsi \ 0 13 Subbotina tinaperta X
46 Globomtaloides i wiabilis X 12 Dentoglobigerina kipuriensis X o
45 Globigerinoides bit 1 laideus \ 0 II Pat •aglobot olal ia griffinoides X ii
44 Menardeila aicfteoitieiitiidii \ 0 10 Clti viget •inella eoloinbiana X 0
43 Globigerina joliaia 9 Acaritiina bttllbrooki X 0
42 Hirsute-Ua praesi it it la \ 0 8 Tt t incarotaloides rohri X o
41 Globigerinoides in itixi X 0 7 Morozovella spiiiulosa X 0
40 Globigeriiw pseudocipeioens is X 6 Clavigerinella akersi \ 0
39 Globigerinoides b ispherica \ 0 5 Acarinina aspens is X o
38 Globigerinoides altiapenuni 4 Igorina broederiiiaiini X 0
37 PraeiirbuiiiHi sictiiut X 0 3 Acarinina es naensis X 0
36 Pnieorbulina trans itaria X 2 Acarinina pentacamerata X o
35 Praeorbttlimigiomerosa X 0 1 Chi vigerinella jarvisi X 0
(text-fig. 1). Its sedimentary record extends from the Oligocene through the Quaternary. Fades vary laterally from west to east and are strongly controlled by the tectonic evolution of this margin (Duque-Caro 1975; ICP-Ecopetrol 2000; Flinch 2003;
Kellogg et al. 2005).
The Sinu Province is a thick, deformed wedge of sediments, lo- cated east of the Romeral Fault System and west of the South Caribbean Marginal Fault (text-fig. 1). It is subdivided into the Sinu Folded Belt (SFB) and the San Jacinto Folded Belt (SJFB). The whole province was accreted to the South Ameri- can margin during the Cenozoic (Kellogg et al. 2005). The
SJFB is composed of Late Cretaceous pelagic rocks, a thick Ce- nozoic turbidite sequence, and Pleistocene-Holocene fluvial and lacustrine sediments (Duque-Caro 1975, 1979; ICP-Eco- petrol 2000; Flinch 2003). The SFB includes Oligocene-Mio- cene shales and extensive, fine-grained late Miocene and Pliocene turbidites overlain by shallow-water Pleistocene-Ho- locene carbonate facies composed of shales, reef limestones, sandstones, and conglomerates (Duque-Caro 1975, 1979). A very low topographic slope and abundant mud volcanism, domes, and diapirs, produced by mobilization of Oligocene- Miocene over pressured shales, characterize the SFB wedge (Duque-Caro 1975, 1979).
5.0
4J0
s
IJO
\ lnn«lion pnmi
Lower vutue
J-
_. | i JLI ILLILLJ
•'I | ' o.o 0.2 O.J Density ".a o.% i.o
OJW. 0.27
2.0
1.0
o
i
= OJ5 O IN 0.0
-0.65 *- -1.0
1 '- 42005I
Siranger events
0.06 027 mi
1~
0.2 0,4
I-Phi Index
i r
II V- +
-ti.bl-4
Lovret ^nliK
0.6
TEXT-FIGURE 3
Marginal plot of the average standardized penalty (Z) obtained in constrained optimization scenario 2 vs. cp value of the 68 LO events from Table 1. The square formed by the minimum values and the inflection points from the density curves of and the <p value contains the stronger LO events, with lower penalty and hence a high biostratigraphic significance. Events highly penalized are marked with numbers that correspond to the order of events presented in Table 1.
METHODS
Thousands of new and revisited biostratigraphic data, collected by Ecopetrol and partners over the last 35 years, were used in this study. A database that includes the lowest and highest ap- pearance depths of 190 species of planktonic foraminifera was built (Appendix 1). It excludes those species with open nomen- clature and those with the qualifiers affinis and confer. The study focused on the best quality data, which includes informa- tion from 1961 ditch-cutting samples and 26 wells, 19 located in the Sinu Province, five in the LMV, and two in onshore and offshore areas of the Guajira Province (text-fig. 1). The wells were selected on the basis of taxonomic consensus, sample den- sity, and geographic and stratigraphic coverage. Highest occur- rence events (HO) were used and lowest occurrence events
(LO) avoided, eliminating the bias introduced by caving in the LO data. Reworked occurrences were eliminated whenever there was enough evidence to recognize them (e.g. isolated and rare occurrences). Only HO events reported in more than three wells were analyzed.
The Constrained Optimization technique was used for the biostratigraphic analysis. The technique (Kemple et al. 1995) identifies a best-fit sequence of events that is optimal in the sense that all the field data may be fit to the sequence with a minimum of range extensions. Acceptable sequences are con- strained to include all observed coexistences of pairs of taxa.
The technique allows many taxa to be used, and quantifies the stability of the position of each event in the best sequence of
Daniel A. Rincon et ah: Eocene - Pliocene planktonic foraminifera biostratigraphy from the continental margin of Southwest Caribbean
TABLE 2
Average constrained optimization penalty levels (Z), Phi Index (<p), number of wells where the event is recorded (n) and estimated local ages of HO events from the proposed sequence. Average penalization level, cp( 1) and n( 1) correspond with the results of 68 proposed events from the analysis of 26 wells used in performing CONOP9. <p(2) and n(2) correspond with results from the regional analysis of 58 best events in 70 tested wells. Maximum and minimum values of the mean estimated age (95% confidence interval) and estimated error from the LOESS method are also presented.
Ill, 1,-1 >|WlK'h 7. •Mil •Ml) • Ol ffff) AEC (Ma) Mill Mm \.e.
68 NtogbyboqttadriiKt pacln 'derma -0.17555 0.68426 • 0.64551 S NA NA NA NA NA
67 Gtoboturboratatita divaraperfa -0.52406 0.86401 < 0.65001 12 NA \ \ NA NA NA
66 Gtahigerinetfa proecvUda -0.14285 0.56347 3 0.54218 1 NA NA NA NA NA
69 Glabigerina jtivendis 1.26032 0.40139 6 - l(. NA NA NA NA NA
64 Neagloboqttadriaa acostaemis -0.62641 0.77500 11 0 73426 34 NA NA NA NA NA
63 tilabi^L-riatdde\ ahliiftia -0.34394 0.72923 15 0.79623 50 0.84964 +/- 3.46684 -2.61721 4.31648 1,68621 63 Spbtwaidmethtpai.'i ftSHfrttttittd 1.18478 0.59965 10 - 19 1.62998 .1.21628 -1.58630 4.84626 1.56434
61 Gfbttlinti xtttumhs -0.166* 0.70292 N 0.72311 42 2.41569 2.97009 -0.55440 5.385 78 1.44460
60 GfoboturborotaltiatttpmtAa 1.05288 0.62966 5 - r i l->\4-> ••'- 7.7.1568 0.46281 5.93417 1.33058 5'i './..,%'.;.,,,,.'. ,„,: • n.,,: ,'.•.,.••• -0.15011 0.69560 :i 0.72952 64 3.97012 2.51715 1.45297 6.48727 1.22429
» Orbtdbia bdabala 0.00467 0.80270 3 0.22937 6 4.73597 -.. 2.3118! 2.42416 704778 1.12442
57 Qhbigwimtlda* tritnbv 1.49661 0.67861 ', - 22 5.50395 2.12330 3.38064 7.62725 1.03273
56 Spbacroidirictlapsixsiibdi.'hixct.'bi1 -0.27678 0.71946 5 0.72626 24 (, :t,'i5(, +/- 1.95858 4.31097 8.22814 0.95262
55 '.,'••,•'','..••,,,• fia mrrulttttuda 0.61198 0.81223 4 0,22938 9 7.02832 1.81548 5.21224 8.24379 0,28301
54 Di'MagtobiKt'rititi gtabona 0.96673 0.55987 3 - 6 7.79992 1.70660 6.09331 9.50652 0.83006
53 Gtobigtirinoidta; subquedrvfa 0.98071 0.64315 X 19 8.591 14 1.66139 6.92976 10.25253 0.80807
52 Paragbibaratafia mayrri -0.39376 0.7528.1 21 0.80696 55 9.37814 +/- 1.67328 7.70487 11.05142 0,81385
51 GtobiReriniftt uvula 0.52964 0.67470 (> - S 10.13707 1.69259 8.44448 11.82966 0.82325
511 \ ttmardeUa praetneiwrdii 0.28491 0.71729 13 0 77505 23 10 24409 1.66490 9 17919 12.50899 0.20978
49 Fahsetln fottsi -0.21995 0.73178 IS 0.79000 M 11.55342 1.66544 9.88797 13.21886 0.81004
4* tahxatla pcripbcrttrtardti 0.52590 0.76036 IB 0.23075 54 12.198.16 1.70868 i0.48968 13.90703 0.23107
47 Foliselta proclaim -0.17420 0.85970 5 0.24119 s 12.68142 +/- 1.75948 10.92195 14.44090 0.85578
46 Globarotalaides variabitis 0.36147 0.77259 9 0.69910 24 13.06225 +/. 1.79945 11.26280 14.86170 0.87522 4? Globigrrinakles bidloidem 0.02870 0.85468 - 0.80426 5 13.371.10 • - 1.83976 11.53154 15.21106 0.89482 44 Mciiardettaarthctitttrwrdii 0.03558 0.72906 7 0.85679 i: 13,63904 • - 1.9222,1 11.7168] 15.56127 0.93494
43 Hirntrtelta praext •ittila o.i3om 0.82434 11 0.23195 19 13.86255 2.01800 11.84455 15.88054 0.98152
42 Globignrinafaliata 0.41633 0.69527 5 - 19 14.03279 2.05554 11.97725 16.08834 0.99978
41 GhibigiTitiimk's mitnt -0.01453 0.79522 5 0.80152 5 14.17106 2.04347 12.12759 16.21453 0.99191
411 Glnbigerittv pwuffaciperaeitth -0.40235 0.753113 4 0.74509 5 14.29863 • - 1.99801 12.3006.1 16.29664 0,97179 39 Gtabigerinuides hssphariea 036063 OKI IK 1 10 0.82664 26 14.43680 • - 1.93357 12.50323 16.37037 0.94045 .is Globigeritjoith'x tdfMperlat'a 0.92960 0.68620 5 III 14.60684 -•• 1.85922 12.74762 16.46606 0.90429
,17 Praearbidifsa vicuna -0.18937 0.75172 12 (1.78197 24 14.83004 1.78119 13.04885 16.61124 0.86634
36 Prai'arbtdtiio Irmisitttria -0.3 i 180 0.85841 7 0.76168 20 15.0940(1 •••- 1.75592 13.33809 16.84992 0.25405
33 Pt'tieat'blilitla gbirneftjxu -030975 0.82921 7 0,83978 15 15.47007 • - 1.71222 13.75185 17.18229 0,23571
34 (itabigvriatndir* datuaaiu -0.40085 0.85683 13 0.84404 12 15,91681 •••- 1.62754 14.22927 17.60435 0,22079 33 Catapyydrax stainfarihi -0.09528 0.77667 15 0.83229 3S 16.45904 +/- 1.66246 14.79058 18.12750 0.81151 32 Paraghiboratatia tiatitt -0.12401 0.74375 14 0.72937 23 17.16303 1.63839 15.52468 18.80147 0.79688 31 Gtabigvriniddux prbnttrdiit -0.45454 0.83030 " 0.85.127 10 17,9152.1 • - 1.61135 16.30387 19.52658 0.78373
30 G/abttrtjrubjide.i- .1 uteri 1.02456 0.70019 6 - 11 18.69123 w- 1.61901 17.07282 20.31084 0.78746
29 Catapyyttrax dhximilis -035986 0.80323 17 0.21030 i2 19.46924 - - 1.69875 17.77049 21.16798 0.82624 28 Para^bibntutaHa kugteri -0.31543 0.83157 S 0.83162 Ml 20.2582(1 +/- 1.79709 12.46170 22.05589 0.87407 27 DeFifaxtahixi'ritjtl fripitrtita -0.06302 0.78153 9 0.77281 18 21.08061 t-1- 1.85031 19.23030 22.93092 0.89996 26 GtcbotttrbtnafahtaoitacbitaL'iisix -0.19669 0.82230 6 0.79926 8 31.92416 +/- 1.87734 20 04683 23.80150 091310 25 'Gtabottirltorutatita (irigtutifaabdiittla' 0.18624 0.7*386 7 0.23173 15 22,77893 +/- 1.90628 20.87264 24.68521 0,92718 24 Gtabalttrbttratalita eiprratrmia -0.55266 0.85821 N 0.79622 11 23.63438 +/- 1.96541 21.66897 25.59979 0.95594 23 Dt'tttaglobigeriiia gtdti vixi 0 88612 0.75418 -1 067447 :• 24.49121 -••• 2.04754 22.44368 26.53275 0.99528 22 Glabigtrrinu atixatixulttridix -0.35087 0.81997 6 0.73728 i: 35.36182 2.12373 23.2.1809 27.48556 1.03295
21 Turborotalia euaperamt 0.23026 0.92559 6 0.71946 9 26.25326 2.18913 24.06413 28.44239 1.06475
20 Pata%lubotittatia apimu -0.47162 0.85265 9 0.80076 17 27,17259 +/- 2.23654 24.93605 29.40913 1,08781
a Dcatogtobigerinapseudovi'iizzuL'kina 0.82265 0.75850 5 0.74953 5 28.12685 2.25552 25.87133 30.38237 1.09704 18 Globotttrboratatitawtgtttiofftcinalis -0.59497 0.80426 3 0.70059 5 29.12310 +/- 2.23345 26.88965 31.35655 1.08631
17 Sabbrtliim g/OfttBlH -0.59497 0.82410 4 0.72376 7 30,1684(1 2158,19 22.01001 32.32679 1,04920
16 Tttrbtirotatia timpliopcrtttra 0.24229 0.75495 '• 0.79373 Ml 3 1.26980 2.02466 29.24514 33.29446 0.98476
IF Subbatimi xepili\ -0.20261 0.77050 3 0.76096 3 32.39715 +/- 1.90556 30.49159 34.30270 0.92623
14 Sabbatiaa ycgttacnaiy -0.49616 0.85238 5 O.8OO48 6 33.51511 1.88296 .11.6.1215 35.39806 0.91583
1.1 Subbotiiia tittaperfa 0.05312 0.67426 s (1.65748 •1 34.62295 -- 1.92107 32.70188 36.54402 0.93437 12 Oratvgtabigerinu rapt/rit>rt\j.\ -0.5387t 0.94154 4 0.94295 J 35.71996 +/- 1.92521 33.79475 37.64516 0.93638 11 Paraxlvbtirtiltdiu xriffiatiittc* -0.52301 0.84951 10 0.84294 II 36.80540 +;- 1.81052 34.99488 38.61591 0.88060 III Ciavigeriaetta cahmibianu -0.57176 0.85723 4 0.85510 4 37.95840 H- 1.72741 36.17099 39.74581 0.86936 9 At-ariiiimi bltllbrtniki 0.45962 0.80997 3 0.80611 3 39.08062 +i- 1.78669 ,17.29393 40.86731 0.86901 8 Trttnt'firftltduidi's: rohri -0.38363 0.84872 i 0.84404 3 40.24350 1.68149 38.56201 41.92499 0.81784
7 Morxaevefla spimdastt -0.42429 0.83486 3 0.82731 3 41.48859 • •• 1.65210 39.83650 43.14069 0.20355
6 Oavigfrfnttla aker\i -0.12019 O.7S804 s 0.76856 9 42.58605 *-/- 1.64219 40.93786 44.23423 0.20165
5 Actirinma aspensis -0.18296 0.87757 3 0.87341 3 43.83407 -- 1.65210 42.18198 45.48617 0.80355
4 tgarina brtmdvrtMttmii 0 50015 0.82469 5 0.81965 i 44.99174 +/- 1.72783 43.26391 46.71957 024038
3 ricurmimj i'-vnatmai* -0.39972 0.81306 4 0.80849 4 46.00080 2.00805 43.99275 48.00885 0.97668
2 Acaradtia pentacmnarttta -0.43678 0.83773 6 0.22790 6 47.10636 +/- 2.46507 44.64129 49 57143 1.19896 1 ('Itn'tgiTirteltajarvixi -0.54987 0.85344 4 0.24262 J 48.14879 +/- 3.04098 45.10781 51.18977 1.47908
HO Species
>/' | In | fl« | Pr | flu | Cli | Aq | flH |£B| Se | r» |,Wtj Za|rt|c|
Eocene
Middle Late
Kttcene Early
Oligoccne - % 1:•_i• . !:• Miocene
.Middle Mincene
Late
Miocene Pliocene i't.K i i i i ! i i 1 i 1 t i l i 1 i l r i 1 i 1 i i 1 i 1 i 1 1 i i i 1 1 i [ i i 1 1 i i t 1 i i 1 i 1 t i 1 i
M,lllllllll,lllll,llllllrllpll.llllNl1llllllllllMI-tl III,,„!,.,,1,1,1 II II. ll lllllll.lllll.lllllll ll-lllllllll-tl.llllUlll.lllll.ll.lHlHIllrll.tl-lllll.lllllllll N-l 1 ill II ill 11,11 1 ill 1II1II1 ill 1, ll-l l-ll ,1 ill 11,11 •! Il 1II1,11 ill !• ll-1 l-ll II ill 11-11-1 'Il 1 ll
iW'ogfobtNftiitfMtnitfttt-iiitfermn CfhibfiiwhiimtuiUu iteriirapvria
t,\<
ft?
(tltj h ISL- li/r eiht jrra ei -a tida ftft LOESS Metliod Gtubiuerimta juveudis
fififo^laboifiiaaritta aroxtaetuiix Gfobigetitwides abfiauu Sfihaemitiim:Unfisix\t:iuiHufina Orhtdinu .iuittfulis
65 63
Span = 0.35
Polynomial decree = 1 / .
61
/ / S
Gtobvtttrbamtaiifa nepenthes f'!\:':>.;\\.-wln/\,l \;'\,:/„ j':Jriu w 59 t /* •
* / '
Orbtdinu Mttbtita 5K
/ / /
Glabigerinoides trfloba }-
/AS
Spbaewidinetfopsis subdehiseens 56
Gfobnmlafiti. i •./.•; 11 •.'.••: r, • 55 f /us
Drfitogtnktgatittti gfabttsti 54 ' / s
Giobtgen wu'di-i uibtjtiadrata tiinkigi'ivulu uvula
:v
' / '
52
* / '
51
/ y /
Mvtoifdcihi prt/t'Mfitaiilu Ftihseiltifohsi
50
*8 •
/7 >
'pi
Fuhsvtia inriiilicmwitda Fuhstriia punt'fah.vi
4A -17 (Jtobitfatatoitti'x varuthiifs 46
:'•[:
GtobigeritNridtv hidfoidens 45
\feiuirt}t?ihl archcttmeiumlii 44 Hirsuleila praexcittda JJ Gtobigerinti foliata 42 i.fi'ih/fn-ritjri/tii'-i t>uu;i 41 Giohiat'rintif?.\iuJttt-if3irriKnsis
<ilot>!y<ri/Jt!itt<:<- hi vfilterit a
40
I / '
Ghthigt't-itH titles, tttthtjwttttv M
Pracorbutma stcaria M ' g i
Praeurbutma frunsiniria M
,' /*>
Prtttttrbutinti gtumerosa 35
Gfobigerinaides dimituita •-i
* /•/
Ctttapsydmx sluiuf'orthi "••
/ y »
ParQglaktHiHaha MUM n
///
Giobigerlttoidex primordius Globorvttdaidea sutert
V M\
Cctiapxp&ux dinsintiffa ParavfafjanHalia kuglcri Detitugfohigcritta tripartite
:•>
**//%
2£
:•
Glnfmturbftmttttita ottadata&uis ^'
//>'
XiUttxHurhiiniKdHii mtgntstUmNlfcvlU' 25
GhrlHifurbumlutiia , •if?cnn-nsis Dentogfohigcrinti galavisi lA i:- s /' , j* t
GfabftturhiuvUitim auguiisuturatb) Tiirtvtnitutia ruaperiuru 2\ s S *
PitraghibufutuUti opium 20 * M '
DeNioalabiQeriMt/Keitdoxviiezuftiiija
Glttnttliirbunittililti tin^sdhfjietnults S: i •' <l •••.'.• i i. i gtjrumti 19 ^ L" * j£ '
/ / "
s' S ''Turbtinrtittui (irt\jt[it>piritttti Stihfwtimt vvEtiatntxis Subbotim stniiis If' [?
' Ss' ' /%'
Suhbolinu IrttufHtriu E-! / JTj,*
13
///
Dvtrtoglobigeritiit topwimsfs Ptiragtobftrntatiti gnfjrnaides f Yui •igfrfficUn colombiana
12
IL 10
, CXx^H
10
• , / ^
Acttrinirtu bittlbivoki <J
,1//
Thmeorotatoidn rohri &
^V^*«
Mwvzorelfa apimdoNt Chvi^frittfila uki-rxi Aiuft'ltirta tix/Kusix Igarina broedenaunni
7 6 3
4
3 ,*J**
Confidence fiMntilx (95%)Ateritttna emaensis 3 c.i. = X ±t,: s.dV(n'i = X± t,. s.c.
A curiiiitta prulaeamcrala
Chi vigeriitcUa jtirvi.ti 7 degree?: oT freedom = 25.5521
^,|,,|,||,|||.,|,;,,||l|,,|,,,,|,|,,|,,,,|||,,|l,|'||.|||,,,,|,,|,|,|',|,||||,,||||.,,.,||,|,,|,,,,| | | 1 ( ,l||l||H,|l!!l||l.|l||l'!|,l|!|ll||.lll|l„||l||l|ln|.l|l
55 50 45 40 35 30 25 20 15 It) 5 0
Time (Ma)
TEXT-FIGURE 4
Local experimental age model for the 68 LO events from Table 1 and its calibration against the absolute chronostratigraphic time scale of Berggren et al.
(1995). Regression surface (bold line) and confidence intervals of 95% (dotted lines) were defined by LOESS method. Age data (black dots) of some of the 40 stronger events are those from Appendix 4.
events. CONOP9 software (Sadler 2003) was used to perform the Constrained Optimization and was run under two scenarios.
The first scenario was performed with unpaired range-end events (only HOs were considered). The second scenario was also performed with HO events but took into account the edge effects (artificial range truncations) at the upper limit of the biostratigraphic information in each well analyzed.
Edge effects concentrate false HO events at the tops of sections and false LO events at the bases of sections (Foote 2000). Al- though CONOP disregards range ends that coincide with the top or base of a section, the edge effect may extend into the sec- tion to generate false range ends in samples near these limits, because many observed ranges include gaps. A piecewise re-
gression (e.g. Yeager and Ultsch 1989) was performed on the frequency of HO events as a function of position (depth) in the section in order to estimate the extent of edge effect near the up- per boundary of each section. Piecewise regression assumes that there are two different regression functions for the same data and attempts to perform a two-segment fit on the data, trying all possible positions of the intersection and choosing the one that produces the lowest residual sum of squares. The two linear re- gressions were chosen as the models to fit by the piecewise re- gression following the algorithm described in Duggleby and Ward (1991). The breakpoint is the intersection of the two fitted regression lines and can be used as an estimated threshold (depth), representing a significant difference in HO frequencies.
Those HO events located above the breakpoint were removed
Daniel A. Rincon et ah: Eocene - Pliocene planktonic foraminifera biostratigraphy from the continental margin of Southwest Caribbean
Cz
N
M
<>
K
MM
63 59 58 55 52 5(1 49
•:>
^^
44 43 II 30 37 35 34 33 31 2<>
28 27 .>
25 :;
20 16 14 12 II 10 9
s
- 6 5 3 : i
EiO Spa-civs \£v (Mit) Phi (Z)
n m
Globigerinoides obliqua 0,85 ± 3,47 0,79623 50 Globoquadrina verezuclann 3.97 ± 2,52 0,72952 64
Orbulina biiobara 4,74 ± 2,31 0,82937
0,82938 6
Globorotalia mcrotumida 7.03 ± 1,82 9
PyragloborOialia muycri 9,38 ± 1,67 0,80696 55 Menardellu prafiEQCnwdti 10,84 dfc 1.66 0,77505 23
Fohsclia lithsi ll,55± 1,67 0,79000 34
Fohsclia periplieroronda 12,20 ± 1,71 0,83075 54 Fohsella praefchsi 12,68 ± 1,76 0,84119 8 GlnhigeriTioides bulloideus 13.37± 1,84 0,80426 5 Menardclla archuomcnardii 13.64 ± 1.92 0,85679 12 Hirsute!la praise itula 13,86 ±2.02 0,83195 19 Glob t^rinoi tins rnhra 14,17 ±2,04 0,80152 5 Globigcrinoidcs bisphcrica 14,44 ± 1,93 0,82664 25 Praeorbulina sicana 14,83 db 1,78 0,78397 25 Praeorbidina glomerosa 15,47 ± 1,72 0.83978
0,84404 15
Globigcrinoides di minimi 15,92 ± 1,69 32
Calapsydrax stain forth i 16.46 ± 1.67 0.83229 35 Giobigerinoides primordlus 17,92± 1.61 0,85327 10 Catapsydrax dissimill's 19,47 ± 1.70 0,81030 32 Paragloborolalia kugleri 20,26 ± 1,80 0,83162
0,77281 10 Dentoglobigerina tripartite 21,08 ± 1,85 18 Gl obot u rboroial i I a miat: h i I acn s i s 21,92 ± 1,88 0,79986 8 'Globoturborotalila angusriumbilkata ' 22.78± 1,91 0.83173 15 G Uihti [ u rbomial i la c iperwnstt 23.63 ± i,97 0.79622 13 Paragfoboroialia opima 27.17 ±2.24 0.80076 17 Turborotalia ainpliaportura 31.27 ±2,02 0,79373 10 Subbotina yeguaensis 33,52 ± 1,88 0.80048 6 Dentoglobigerma tapuriensis 35,72 ± 1,93 0,94295 4 Paraiifoborolalia grifllnoidcs 36,81 ± 1,81 0,84294 11 Chi vi gunnel la cnliwibiana 37,96 ± 1,79 0,85510 4 Atarinina :*- ill ••.••• •:, 39.08 $ 1.79 0.KO6II 3 Tmncorotahiidcs tuhri 40,24 ± 1.68 0,84404 3 Morozo vel la splnuloaa 41,49 ± 1,65 0.82731 3 Clavigcrinella akersi 42,59 ± 1,65 0.76856
0,87341 9
Acarinina aspensis 43,83 ± 1,65 3
Igorina broudcmianni 44,99 ± 1,73 0.81965 5 Acarininausnacnsis 46.00 ± 2,01 0.80849 4 Aearbina puntacamcrata 47,11 ±2.47 0.82790 6 Ciavigcrindla jarvisi 48.15 ±3,04 0.84262 4 TEXT-FIGURE 5
Estimated local ages, cp values, and number of wells (n), where the potential zonal markers were found in a regional analysis of 70 wells. Their distribu- tion into geological epochs is shown in the left margin and selected zonal markers are emphasized with a gray bar.
from each section; the rest were retained in the Constrained Optimization analysis.
The optimum sequences of events produced by the two scenar- ios were compared using Kendall's Tau coefficient of concor- dance (e.g. Gibbons and Chakraborti 1992). In order to obtain a unique sequence, events that were not concordant between the two scenarios were removed and the remaining events were an- alyzed by their relative position and their 5% relaxed fit inter- vals in the CONOP composite sequences of both scenarios.
This is because CONOP calculates, for each event, the position it gets if the misfit was increased in 5% in relation to the opti-
mal sequence (Sadler 2003). Discordant events, those events whose 5% relaxed fit intervals of one scenario did not permit or- ganizing them in the order obtained in the other scenario, were removed. Then, the sequence of events that maintained the same position in both scenarios was used for further biostratigraphic analysis and to build the zonation proposed in this study.
Taking into account that the resolution of biostratigraphic zonations must be given by the data (robust events), and not by the biostratigrapher, we used two methods to assess the quality of each event of the optimum sequence of events as a
Datum Events Planktonic Zones
Globigerinoides obliqua
Pli-1
[
Globoquadrina venezueiana
*|3.87
Globigerinoides obliqua zone Mir-6
Globorotatia merotumida Mir-5
Paragloborotalia mayeri I
Mir-4
Fohsella s.l.
Fohsella peripheroronda Mir-3
Globoquadrina venezueiana zone
Globorotatia merotumida zone
Paragloborotalia mayeri zone Fohsi
zone
m c
Ulr-3.1 FohssKa 73 U perifjlwfcronda siibrorn? r Q
Globigerinoides diminuta I
Catapsydrax stainforthi Mir-2 Gtob/ger/no/des primordius zone
Catapsydrax dissimilis
Mir-1 Giobo turboFotalfta ouachitaensts zone
Par&gfaborotaiia kugteri
Mtr-l.zFohstttMtoIisfs.I.
TIME
late early
0) C
« 8
*ftr-77 eJoWfffcrfnCJ'tfM
Mif-2.1 Catapsydrax
stainforthi ...-.\ •-•••• flj
^5
Mlr-1.2 Catapsydrax CO Q dissimilis subzone O -—
.'.In-:.} Paragtaborotatia kuqlert subione
Globoturbomtalita ciperoensis
Oca-3 I
Paragloborotalia opima
Globoturbomtalita ciperoensis zone
- a>
c
CD O
— en
I
Turborotalia amptiapertura Oca-1
Oca-2 Paragloborotalia opima zone Turborotalia amptiapertura zone
>, a> c CO O O en
Subbotina yeguaensis
Eco-3
Paragloborotalia griffinoides
I
Clawgerinella akersi
I
Acarinina pentacamerata
Eco-2
Subbotina yeguaensis zone
Paragloborotalia griffinoides
zone
CO o
— o 111
EC0-2.2 C';:-;(;: ;:;<:i-..•
Colombians s ubzon*
0) CD r u ni
u u
Eco-2,1 ClavlgarinBtta akwst subzgne
E o C LU
Acarinina
pentacamerata zone -^ £ ?
CO u ^ LU
M5
PI I
PIS
M 12_
4P= Hft
M7
M4 M3 M2
K 1
P22
P20
P13
B17
P16
P15
P14
P12
P11
P10
P9 P7 Morozovella aequa
oe
05 04 03 P19 0 2 01 E1'6 E15 E14
E13
Ell E10 E9
E8
E 7 E5
r 11.0
- 13.0 - 14.0
- 10.0 - 17 0
- 10.0 -20.0 -21.0
- no
-24.0
~:^o
it g
;- 28.0 -28.0 - 30.0 :n :)
-33.0 -34 0
-3E.0 - 37.0 -3BJJ -38.0 -40.0 - 41.0.
-41.0 - 43.0
r-45.0
:s ..
HJJJ
! 510
•-•jt>
TEXT-FIGURE 6
Zones and datum events of the proposed local zonation. Time scale is fromBerggren et al. (1995) andBerggren and Pearson (2005). Ages for zonal datum events are discussed in the main text.
Daniel A. Rincon et al: Eocene - Pliocene planktonic foraminifera biostratigraphy from the continental margin of Southwest Caribbean
TEXT-FIGURE 7
Distribution of planktonic HO events and their confidence intervals. Time scale is from Berggren et al. (1995) and Berggren and Pearson (2005). Age (bold lines) and confidence intervals of 95% (dashed lines) for HO events are those defined by LOESS method (see also text-fig. 4).
biostratigraphic marker: (1) the average standardized penalty (Z), obtained for each event in Scenario 2 of Constrained Opti- mization, and (2) the Phi index - tp (see Supplement for a de- tailed explanation of the index). One advantage of the Phi index is that it could be applied to wells that were not used in the Con- strained Optimization analysis. Use of the average standardized CONOP penalties (Z) assumes that LO events whose observed range-end events need relatively large adjustments (penalty) to fit the optimal sequence are the least consistent in position among the locally observed sequences. The necessary adjust- ments are partly a reflection of the biostratigraphic quality of the taxa and may also reflect the sampling and preservation fac- tors that vary from well to well. Accordingly, the local penalties obtained for each HO event "z" in the well "/' were standard- ized using the following equations:
where V,is the penalty increment for species "i" in the well"/' and Mj is the mean penalty value for well "j", Sj is the penalty standard deviation for well "/', and "I" the number of wells where the event was observed.
In general, events with low values were assumed to have higher biostratigraphic value. CONOP offers several options for the penalty that measures misfit between hypothetical sequences of events and the field observations. The "level" penalty measures range adjustments in terms of event levels. It was chosen be- cause it favors successions seen in the most richly fossiliferous and intensely sampled sections (Cooper et al. 2001). Measures that use rock thickness can be biased by differences in accumu- lation rates (Sadler 2003), and we assume that accumulation rate varies with fades within the study area.
z.=%z^
• i
The second method, the Phi index (see Supplement), was also (1) applied to find out the more stable events among the sequence by testing the relative position of each event in each analyzed well (for detailed explanation of the index see Supplement). The value of tp oscillates between 0 and 1, the higher the value the (2) lower the divergence between the observed relative position of an event into the field sequence and its relative position in the optimum sequence of events.
i
KflkWI', 1'nU - l.HO T 1 1 1 1 1 r>
I I I I J 1 *
vl* i I i - I
i)nkr ofeicnK fhi^ work
- - - ' -
b
o
1 - e
-1 c
t: - a
.1 - a
e
0
-
0f
-
0i •
a KflMbiriTki' 0.T5 1 1 1 1 lllllllll 1 1
Order mftitmM. Ihii *nrt
L l-.|l \'.'.|M,I,L\\
Pfilffl
Order pf (iwd. Ail yntt.
*1
„ *
J)- (1 0 o
C3'-
^ ^~ %
~ JT-
s
— i i -
/
£ 17-
i
B ar
'S li- % -
te *~ n
<f
>- / Keniinll'kTjiu -HI.H7 i — inn M 1 1 1 1 1 II 1 1 1 1
^a^ 5*Li ^ri 1 -s (Inter vF dents ihis. wurk
an-f
:< —
:•• -
,,-
'•'-
' - -
• -
lvrt'iLiiul SLTqucnu.-*
4,
%
f
lii'ruljll\ luu ' 11.73
IIIIIMIIHUIIIII
[liilitllilllJii
OnJer nfeiemv (hit »wri
b i i
Gnl« of fniiu, (his work
s „ KLT|IDN"»T*U-O.W
rn—i—i—i—i—i—i—i—r
IH-HUJt
Order«f cvcnls, Itin nil
TEXT-FIGURE 8
Comparison of the local proposed bioevents with: (a) the last occurrences from the planktonic zonal scheme of Stone (1968); (b) the events proposed by Martinez (1995); (c,d) the planktonic zonations of Blow (1969, 1979) and Postuma (1971); (e) the Neogene planktonic - phylogenetic framework of Kennett & Srinivasan (1983); (f) the planktonic scheme of Bolli et al. (1985); and (g) the tropical planktonic global scheme of Berggren et al. (1995).
Daniel A. Rincon et ah: Eocene - Pliocene planktonic foraminifera biostratigraphy from the continental margin of Southwest Caribbean
lion
11000
l«WI 11 "i
T
"J Dwm ' Ita Sanifilinu j I Ck'iinwnn- in tusein
FC
" --^ ^^ ~jj
"''. ••I'liMni
/£iS
jy
T—, • ~-^|
j^ \J F$
*«i 4 jfiI
^VwaB 1 , &
1
nakffil /^^'
• lb* H11 I 1 II ma
1* • -
1 • ' i-.i,*.
1 wr
• . .-. • ...._.
0»J UA^frVta^MVH
«-H*-*f-
1 u>i
< L»!
- M Wt >l.ij *
h*l
mm wm
-MM) HOB 6D00 TOO
WOO
)
IXH'I i aunt IWUU HINli
' I MOO
TEXT-FIGURE 9
Correlation of Cenozoic sedimentary successions in 13 northern Colombian wells. Depth values (ft) per well are those reported in the biostratigraphic distribution charts, using the proposed planktonic foraminifera zonation. Main tectonic and sedimentary features are indicated: LMV-SJB (Lower Magdalena Valley, San Jorge Basin), LMV-MA (Lower Magdalena Valley, Magangue Arch), SJFB (San Jacinto Folded Belt), Sinu Folded Belt (SFB), Lower Guajira Basin (LGB) ad Upper Guajira Basin (UGB). Vertical single bars at both ends of the wells indicate the vertical extension (ft) of the perfo- ration, where there is not biostratigraphic data.
Events with both low and high cp values were judged to possess high biostratigraphic significance. The Phi index (cp) was ap- plied then to those key events in 70 wells, including wells used in Constrained Optimization analysis. This analysis was done to further improve the measure of the quality of each event as a biostratigraphic marker.
In the absence of paleomagnetic polarity, stable isotope, and fission-track data, an experimental age model was constructed to date the optimum sequence of events. This biochronology was built by performing a nonparametric local regression, LOESS, interpolating numerical age information from several authors and the order of events in the optimal sequence, using the R 2.1.0 statistical package (R Development Core Team, 2005). Finally, we selected zonal event markers for each epoch, based on the best Phi index, their regional presence, and their taxonomic complexity.
RESULTS
The analysis yielded a sequence of 97 HO events in scenario 1, whereas scenario 2 retained 87 events (text-fig. 2). After ac- counting for the edge effects in scenario 2 (as described above), some of the events remained in fewer than three sections, and therefore were removed. The excluded events were the HO of the following taxa: Neogloboquadrina humerosa, Globi- gerinella siphonifera, Globigerinoides immatura, Globigerinita incrusta, Menardella limbata, Globigerina falconensis, Globoquadrina dehiscens, Globoquadrina praedehiscens, Turborotalia pomeroli, and Subbotina eocaena (for synonymies and species authors see Taxonomic Notes section).
Text-figure 2 compares scenarios 1 and 2. Overall concordance between both scenarios was high (Kendall's Tau coefficient = 0.85). Exceptions were the positions of the HO of Globigerina praebulloides, Orbulina universa, Globigerina bulloides,
B
SE
xtv XV VI VII XV]
XVIIB'
NW
LMV-PB SJFB SFB
3
] Barren / Poor Sampling
I3 F'l-.-l Gbt%pW&; ithiiifiia i: Mirj GkttwqmKttjita reiKveknv
n
Mil i Glokuvudia mertftufrntlti 10 Mir4 Paragloborototia maycn9 Mir-J Fohadta fohsi
1
Mir-2 Git>higtrinoides primtid'un 7 Mii-1 Ghrfwlurbomlatilammliilurnsi*i
OcavS Gltsboiurborvtalim dpmvxstt 5 Oci-2 Pawvltihimltitifi opiina 4 Oa-1 Turfvwltiliii muplkipcrtruii?
La i Siihhatim) yiguattutt2
Ero-2 PvrQglatxmitiiliu griffinaidts 1 Ero-I Auirimi [KtiltitrvHwrulP0 I 1000
2000 I 3000 4000
51 n lit
^6000 r 7000 i 3000 9000 10000 11000 12000 13000
TEXT-FIGURE 10
Correlation of Cenozoic sedimentary successions in northern Colombian wells. Transect B - B' includes wells VI and VII, also shown in text-fig. 9.
Depth values (ft) per well are those reported in the biostratigraphic distribution charts, using the proposed planktonic foraminifera zonation. Main tec- tonic and sedimentary features are indicated: LMV-PB (Lower Magdalena Valley, Plato Basin), SJFB (San Jacinto Folded Belt), and Sinii Folded Belt (SFB). Vertical single bars at both ends of the wells indicate the vertical extension (ft) of the perforation, where there is not biostratigraphic data.
Daniel A. Rincon et ah: Eocene - Pliocene planktonic foraminifera biostratigraphy from the continental margin of Southwest Caribbean
XVIII
SE
0 1000^
2000 3000 4000 I
sow
6000- 7000 8000 -.
9000 -_
10000 "
11000
12(1(1(1].i(l(l(l
14000 15000
12
11
10
VIII
_L_
IX
12 II
12
Plauklanif Zones 13 \li--" (.• •liiiiiii.Yi
12 Mir-G G vttnczuclaw 11 Mir-5 G. meivtumidsi 10 Mir-4 P. maym
9 Mir-3 F.fchsi 8 Mir-2 G primordius 7 Mir-] G attachifaciBi.1 6 Oca-S G dperoensis 5 0ca-2 P. upiaici 4 Oca-1 T. umptiaperlimi J FICO-J S. ycgauensis 2 Eco-2 P- grifjinoitles 1 Eco-I
A, pestpcaaersta
XIX ODP999A
C
NW
LMV»PB SFB
(Vilnmhian Basin1 n
• 5CF°
c e Jj c
r1 b s- — if 8
- 'J i PC
z_
13
|-250 13
12 : 500 i 12
^ 11 1 750
9 10
a
b hioooj
'r> I
9
8 'l
a
- J250J
\ 1 \
J L7h
1
1500"
1.1
1000 : 2000 : 3000 : 4000 5000 -6000 7000
rSOOO
r%oo
11)111 III
j-11000 12000 13000
=-14000 15000
TEXT-FIGURE 11
Correlation of Cenozoic sedimentary successions in northern Colombian wells. Transect C - C includes wells VIII and IX, also shown in text-fig. 9.
Depth values (ft) per well are those reported in the biostratigraphic distribution charts, using the proposed planktonic foraminifera zonation. Illustration of ODP site - 999 A was rescaled with a magnification of ten times. Main tectonic and sedimentary features are indicated: LMV-PB (Lower Magdalena Valley, Plato Basin), Sinii Folded Belt (SFB) and Colombian Basin. Vertical single bars at both ends of the wells indicate the vertical extension (ft) of the perforation, where there is not biostratigraphic data.
SW
n
_l_ _1_
V
_1_
Mil
J
\
Itt
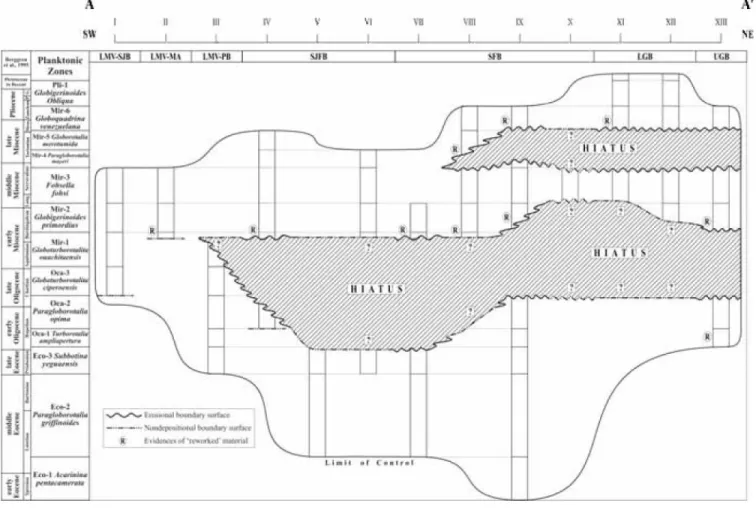
TEXT-FIGURE 12
Chronostratigraphic chart (Wheeler diagram) of Transect A - A'. Main tectonic and sedimentary features are indicated: LMV-SJB (Lower Magdalena Valley, San Jorge Basin), LMV-MA (Lower Magdalena Valley, Magangue Arch), SJFB (San Jacinto Folded Belt), Sinn Folded Belt (SFB), Lower Guajira Basin (LGB) ad Upper Guajira Basin (UGB).
Cassigerinella chipolensis, Globigerinoides rubra, Menardella menardii, Hirsutella scitula, and Globigerinoides sacculifera, which were lowered to older positions in scenario 2; positions of the HO of Paragloborotalia siakensis, Globigerinella obesa, and Globoquadrina advena, on the other hand, were located in younger positions relative to the positions yielded by scenario 1. Inconsistencies, from one scenario to another, in the relative extinction levels could be attributed to the sensitivity of some events to edge effects in one or several wells.
After removing those non-concordant, edge effect-sensitive events, HOs were organized in a unique sequence, according to their relative position and their 5% relaxed fit intervals in each scenario (Appendix 2). HO events like those of Subbotina gortanii, Subbotina senilis, Subbotina yeguaensis, and Turborotalia ampliapertura, whose 5% relaxed fit intervals overlapped each other, were organized in the final sequence by their potential maximum position (Appendix 2). Finally, a list of 68 events composed the resulting final sequence (Table 1).
A marginal-plot of the average standardized penalty (from sce- nario 2) vs. Phi index (tp) of the 68 proposed events from Table 1 (text-fig. 3) showed that a high percentage (88.9%) of HO events presented low penalty levels (< 0.35) and high (p values (tp > 0.73), thus identifying them as robust biostratigraphic
events in the sequence (Tables 1 and 2). Other events, such as the HOs of Globorotalia merotumida, Dentoglobigerina galavisi, Dentoglobigerina pseudovenezuelana, and Igorina broedermanni, were highly penalized by CONOP9 but they have high tp values (text-fig. 3; Table 2). The opposite is charac- teristic of the HOs of Neogloboquadrina pachyderma, Globigerinella praecalida, Orbulina suturalis, Globoquadrina venezuelana, Sphaeroidinellopsis subdehiscens, Menardella praemenardii, and Subbotina linaperta, which have good
CONOP9 penalties, but poor tp values (text-fig. 3; Table 2).
Fifty-eight robust biostratigraphic events, which remained after removing those 10 events highly penalized by CONOP and Phi index, were used to recalculate (p in 70 wells (Appendix 3). Re- gionally, 40 events were found with low departure from the pro- posed sequence (tp > 0.77) and they were classified as potential zonal markers (Tables 1 and 2).
The literature age assignment for 33 of the potential zonal mark- ers is shown in Appendix 4. Age assignments of the other seven HO events were not found. In order of precedence we prefer to use the age estimates of Chaisson and D'Hondt (2000) and Pearson and Chaisson (1997) to build our own age model, due to the geographic proximity of those OOP sites to our study area. Other ages were taken from Pearson et al. (2006),