DOI: 10.24034/j25485024.y2023.v7.i3.5750
394
GOOD CORPORATE GOVERNANCE, AUDITOR QUALITY AND AUDITOR OPINION ON EARNING PERSISTENCY
Arfan Ikhsan [email protected] Putri Kemala Dewi Lubis
Universitas Negeri Medan Tiolina Evi Perbanas Institute Syahrijal Hidayat
Sekolah Tinggi Ilmu Ekonomi Muhammadiyah Kisaran Ratih Kumala
Institut Ilmu Sosial dan Manajemen STIAMI
ABSTRAK
Penelitian ini mencoba menguji pengaruh good corporate governance (GCG), kualitas auditor (AQ), dan opini audit (AO) terhadap persistensi laba (EP). Laba yang berkualitas adalah laba yang persisten, dalam hal ini laba yang dimiliki permanen dan tidak bersifat transitory atau sementara. Persistensi laba adalah laba yang mempunyai kemampuan indikator laba periode mendatang yang dihasilkan oleh perusahaan secara berulang- ulang. Penelitian menggunakan GCG, AQ, dan AO sebagai variabel independen dan EP sebagai variabel dependen. Populasi penelitian adalah seluruh perusahaan terbuka dengan menggunakan purposive sampling sebagai teknik pengambilan sampel. Sampel penelitian adalah 989 perusahaan publik yang terdaftar di Bursa Efek Indonesia (BEI) tahun 2017-2021. Penelitian ini juga menguji beberapa variabel kontrol antara lain nilai akrual absolut, volatilitas arus kas (CFV) dan volatilitas penjualan (SV). Hasilnya adalah: (1) Independensi dewan komisaris, kepemilikan institusional, opini auditor, dan kualitas auditor berpengaruh positif terhadap persistensi laba. (2) Rapat komite audit tidak mempengaruhi persistensi laba. (3) Untuk variabel kontrol: Leverage, Cash Flow Volatilitas (CFV), dan Sales Volatilitas (SV) tidak berpengaruh terhadap Persistensi Laba (EP).
Kata kunci: presistensi laba, kualitas auditor, opini audit.
ABSTRACT
Research tries to test good corporate governance (GCG), auditor quality (AQ), and audit opinion (AO) on earning persistence (EP). Earning quality are earning persistent, in this case the earning owned are permanent and not transitory or temporary. Eanring persistence is profit that has the ability to be an indicator of profit for the future period that is generated by the company repeatedly. Research uses GCG, AQ, and AO as independent variables and EP is dependent variable. Research population all publicly traded companies using purposive sampling technique. Research sample is 989 public enterprise registered on Indonesia Stock Exchage (ISX) 2017-2021. This research also test some variables control include absolute accrual value, cash flow volatility (CFV) and sales volatility (SV). The results are: (1) Board commissioner’s independence, institutional ownership, auditor opinion, and auditor quality have a positive effect on earnings persistence. (2) Audit committee meetings don’t affect earnings persistence. (3) For control variables: leverage, cash flow volatility (CFV), and sales volatility (SV) don’t affect earnings persistence (EP).
Key words: earning persistence, auditor quality, auditor opinion.
INTRODUCTION
Profit information is a component of financial statements that is generally the main concern of users of financial statements in assessing the performance of a company.
SFAC (Statement of Accounting Concepts) No. 1 states that profit information is provi- ded to assess management performance, esti- mate representative profit capabilities over the long term, predict returns, and assess risks in investment and credit. Assessment of management performance through profit in- formation motivates management to achieve specified profit targets. If under certain conditions management does not succeed in achieving the profit target, management tends to take advantage of the flexibility al- lowed by accounting standards in preparing financial statements to regulate reported profit information. The practice is known as profit management. Profit information is needed to assess changes in potential econo- mic resources that may be controlled in the future, generate cash flows from existing resources, and for the formulation of consi- derations about the effectiveness of the com- pany in utilizing additional resources (IAI, 2016). Shareholders and/or investors can view that profit is an increase in economic value that will be received, through dividend distribution. Profit is also used as a tool to measure the performance of a company's management over a certain period. The achievement of management performance is generally a concern of certain parties, espe- cially in assessing the performance of mana- gement accountability in managing the resources entrusted to them. On the other hand, profit is also often used as an indicator to estimate the company's prospects in the future. Given the strategic role of this profit information, the quality of profit is very important for economic decision makers (Khafid, 2012).
The earnings quality (EQ) enterprise is often correlation with earnings persistence (EP) (Musa and Latiff, 2017). Earnings that are not too fluctuating are characteristics of EP and the EQ earnings reported by the
enterprise is good (Suwandika and Astika, 2013). Persistent accounting profit is ear- nings that can reflect the sustainable ear- nings (SE) in the future which is determined by the accrual component and its cash flow.
EP is a revision of expected future earnings caused by current earnings innovation (Yahya and Butar-Butar, 2019; Hsu and Hu, 2016). The EP is determined by accrual and cash flow (CF) components contained in current earnings (Neag and Masca, 2015;
Suwandika and Astika, 2013; Alfiarini, 2015).
EP are profits that have little or no interference and can reflect the enterprise true financial performance. Interference in accounting profit are caused by temporary events or the application accrual concept in accounting. The greater accrual, the lower EP (Prasetyo and Rafitaningsih 2015;
Suwandika and Astika, 2013). Earnings in- formation as part of the financial statements does not present facts about the economic condition of a enterprise. Profits are expected to prepare information to support decision making are of doubtful quality. Earnings that do not show correct information about ma- nagement performance can mislead the users of the report. According to Hamdan (2020) and Adiputra et al. (2017) this view is closely related to the enterprise performance which is manifested in the enterprise profit earned in current year. EP if current year earnings can be a good indicator of a enterprise earnings in the future (Devi et al., 2019;
Chrisyanti, 2015) or are strongly associated with CF future operations (Irfan, 2013).
EQ is thought influenced by the cor- porate governance mechanism. Azila- Gbettor et al. (2018) define corporate gover- nance (CG) as a system that directs and con- trols the enterprise intending to achieve a balance among the enterprise and its stake- holders. Bhagat and Bolton (2019); Buallay et al. (2017); Bhatt and Bhatt (2017) define CG as the intercouse among participants in determining direction and performance. Bae et al. (2018) stated CG a mechanism used to ensure that the enterprise 's shareholders and lenders receive a return from the activities
carried out by managers with the funds they have invested/lent, or in other words, how the enterprise financial suppliers doing con- trol up on managers appears agency theory related to the phenomenon of the separation enterprise ownership (principal) and enter- prise manager (agent), especially in modern companies (Jensen and Meckling, 1976).
Agency problems occur because of gaps in- formation among the agent and the princi- pal. In fact, this agency problem cannot be eliminated but can be minimized by the existence of GCG.
Management as an agent has informa- tion about the enterprise operating perfor- mance in real terms, while shareholders as principals have limited access to internal enterprise information. This kind of conflict causes investors in making investment deci- sions not only to pay attention to high profits but also to pay attention to persistent profits.
Efforts that can to overcome conflicts of interest in financial statements by conduc- ting audits of financial statements by third parties professionally and independently.
Audit Financial statement are expected to minimize information risk and fix decision- making (Arisudhana, 2017). The final stage of the audit process is the provision of an opinion that aims to provide conclusions and assessments of the quality financial state- ments enterprise that have been audited.
Giving audit opinion in the audit report is final step in the whole series of audit processes (Hati and Rosini, 2017). Thus, the opinion expressed by the auditor is the result of professional analysis and judgment by his work standards. An audit report is a form of formal communication used by the auditor to convey matters of concern during the audit process to all interested parties. The audit opinion is stated by the auditor as the fairness auditor conclusion of the enterprise contents financial statements and their con- formity with applicable principles and regu- lations. Thus, the AO can be a source of infor- mation that can be used as a measuring tool for the quality and fairness of a enterprise
financial statements as well as additional information in the decision-making process.
THEORETICAL REVIEW Agency Problem (AP)
Jensen and Meckling (1976) stated the agency relationship as a contract among the manager (agent) and the owner (principal) of the enterprise. One or more principals give authority to agents to carry out interests of the principals. According to Anwar and Amrizal (2019) and Awasthi (2017) in agency theory, the principal oversees the agent to carry out efficient performancen. This theory assumes that efficient performance and organizational performance are determined by effort and the influence of environmental conditions. The management of the enter- prise as the party who is authorized over the activities of the enterprise and is obliged to provide financial reports as a form of accountability will tend to report something that maximizes its utility without maximi- zing the welfare of the principal. This is what triggers an agency conflict among the prin- cipal and the agent. Investors expect that ma- nagers will generate returns from the funds they have invested in the enterprise. There- fore, a good contract among investors and managers is a contract that can explain what are the duties and responsibilities that must be carried out by managers in managing investors funds that have been invested in the enterprise and also specifications regar- ding the distribution of returns among ma- nagers and investors. Instead, they should sign a complete contract, which spells out exactly what the manager should do in any event, and how the enterprise 's profits will be allocated. However, there are still factors that are difficult to predict, so a complete contract is difficult to appreciate. Thus, in- vestors are compulsory to give residual control rights to managers, namely the right to make decisions in certain conditions that have not previously been included in the contract. Thus, a higher proportion of inde- pendent commissioners can lead to more persistent earnings, because a higher propor-
tion of independent commissioners provides better supervisory control. Previous studies such as Kusuma and Sadjiarto (2014), Khafid (2012), and Shiri et al. (2012) also provide empirical evidence such as the results of this study, namely independence of the board commissioners (IBC) effect on earning persistence (EP).
Auditor Quality (AQ)
According to Sumantri (2018), audit quality is seen as one of several factors that can affect the credibility of financial informa- tion. Audit quality is the likelihood that an auditor will: 1) find violations in the client's accounting system and 2) Report the viola- tion. General Accounting Office-GAO (2004) said that audit quality refers to the ability of auditors conducting audits and their confor- mity to generally accepted auditing stan- dards (GAAS) in providing adequate assu- rance and assurance that the audited finan- cial statements have been reported in accor- dance with the Statement of Financial Accounting Standards and do not contain material errors, both those that arise by accident and fraud. The higher the quality of the audit is assumed, the more accurate the results of the information. The ability to provide high-quality audit services is an important focus that must be considered by auditors, because a good audit is one that is able to improve the quality of information and its context. The ability to provide high- quality audit services is an important focus that must be considered by auditors, because a good audit is one that is able to improve the quality of information and its context. Mana- gement wants high-quality audits so that investors and users of financial statements have more confidence about the reliability of accounting figures in financial statements.
Likewise, parties involved in the capital market also prioritize audit quality because the independence and competence of the auditor affect the credibility, reliability and quality of the auditor's report.
Earning Persistence (EP)
EP is a profit that can be indicator of earnings future generated by the enterprise repeatedly in the long term. According to Suwandika and Astika (2013), EP is a condi- tion current profit period is a reflection of the future period or the current period. EP is a revision of expected earnings in the future as reflected in current year earnings (Yahya and Butar-Butar, 2019). According to Neag and Masca (2015); Asma (2013) EP is a revision of expected future earnings that is implied by profit for the year (current earnings) asso- ciated with changes in stock prices. The more permanent earnings over time, the higher earnings response coefficient. This indicates that the profit earned by the enterprise is increasing continuously. Meanwhile, accor- ding to Febiyanto and Cahyonowati (2014) EP are profits that have small or no distur- bance (noise) and can reflect the enterprise actual financial performance value (Pratiwi and Zulaikha, 2014). Persistence is measured by using the coefficient of the regression among accounting earnings for the current period and the future period (Febiyanto and Cahyonowati, 2014).
Good Corporate Governance (GCG) on Earning Persistence (PP)
The term Good Corporate Governance was first introduced by the Cadbury Com- mittee in 1992 known as the Cadbury Report.
This report is seen as a decisive turning point for Corporate Governance practices around the world. Good Corporate Governance (GCG) is a good system and structure in ma- naging a company by increasing shareholder value accommodating various stakeholders of the company, such as: creditors, suppliers, business associations, consumers, workers, government, and the wider community. The Company believes that GCG implementa- tion is another form of enforcement of busi- ness ethics and work ethics that has long been the company's commitment, and GCG implementation is related to increasing com- pany value. Companies that practice GCG
will experience improvements in the image and value of the company.
OECD (2004) formulated that CG is a set of relationships among management, the board of directors, the enterprise sharehol- ders, and other stakeholders. CG also requi- res a structural device to get goals that are in the interests of the enterprise and sharehol- ders must facilitate effective supervision to encourage companies to use resources more efficiently. Putri and Andayani (2017) found that companies that have good governance will minimize opportunistic financial state- ments. GCG is applied for the realization of transparent corporate management for all users of financial statements. The first GCG mechanism that affects EP is the independen- ce of the board commissioners. The second is the existence of an independent audit com- mittee within the enterprise.
Empirical evidence obtained from re- search results shows that public companies in Indonesia are still weak in managing com- panies compared to Southeast Asian coun- tries, this is shown by weak accounting stan- dards, accountability to shareholders, disclo- sure standards and transparency and com- pany management processes (Zhuang et al., 2000). This indirectly shows that companies in Indonesia are still weak in good manage- ment in satisfying company stakeholders. In an effort to overcome these weaknesses, bu- siness people in Indonesia agree on the im- plementation of good corporate governance (GCG) as a good corporate management system (Sulistyanto and Nugrahanti, 2013).
The independent board of commissio- ners is one of the most important parts of the implementation of Good Corporate Gover- nance (GCG). Independent commissioners are more effective in monitoring manage- ment. This means that the existence of an independent commissioner will provide oversight to the company's management to achieve the company's goal of obtaining per- sistent profits. Al-Gamrh and Al-Dhamari (2016) stated that the composition of the independent board of commissioners in the company proved to have a significant effect
on earnings persistence. The hypotheses pro- posed in this research are:
H1: Independence board commissioners af- fects earnings persistence.
The audit committee whose members consist of external parties is believed to have independence in the supervision and control of the financial reporting process. The third is institutional ownership which is shared ownership by financial or non-financial ins- titutions or other legal entities. Institutional ownership influences earnings persistence.
Investors who come from outside (foreign investors) are better able to control the enter- prise management because they have suffi- cient knowledge and resources. Institutional shareholders can also influence the enter- prise in different ways, for example by put- ting pressure on certain issues and activities to control the internal decision process through membership of the enterprise board directors. The hypotheses proposed in this research are:
H2: Number of audit committee meetings affects earnings persistence.
In institutional ownership, investors outside the company are considered capable of controlling the company's management.
Institutional investors usually have sufficient and broader knowledge and resources com- pared to individual investors. Institutional investors can also influence companies by controlling the pressure on certain issues and activities during the internal decision-ma- king process through management. There- fore, institutional investors are the ones who can monitor agents with ownership that tends to be large, so that managers are more motivated and the desire to manage profits is reduced or improve managers' performance to generate profits rather than manipulating profits. So it can be concluded that the grea- ter the amount of institutional ownership, the more persistent the company's profits will be (Dewata et al., 2016). The hypotheses proposed in this research are:
H3: Institutional Ownership affects earnings persistence.
Auditor Quality (AQ) Affects Earnings Persistence (EP)
In audit, the auditor must act as an expert in the field of accounting and audit- ing. Achievement of expertise start from for- mal education, followed by experience and practice in auditing. Watts and Zimmerman (1986) and DeAngelo (1981) state that AQ depends on the relevance of the auditor report in testing contractual relationships and reporting violations. According to Oktapiani and Ruhiyat (2019), it is stated that qualified auditors prefer to report mistake and irregularities, and are not willing to accept questionable accounting practices.
AQ cannot be observed directly. Perceptions AQ are usually related to the name of the auditor, including industry experience and ability to disclose management errors. In this study, we are proxy auditor quality with the big four auditors by Imar and Effendi (2019).
Big four auditors are auditors who work at a Public Accounting Firm (KAP) which is included in the big 4 groups. Auditors big four have a better reputation than auditors non-big four. AQ is a measure level that indicates competence and independence of the KAP in auditing and examines the financial statements so that it can assure the opinions issued and can provide a guarantee for the reliability and quality of the account- ing numbers in the financial statements. AQ measured by whether the auditor auditing the enterprise join with a Big 4 KAP or a non- Big 4 KAP (Christiantie and Christiawan, 2013; Juliardi, 2013). The hypotheses propo- sed in this research are:
H4: Auditor quality affects earnings persistence.
Auditor Opinion (AO) Affects Earnings Persistence (EP)
AO expressed in opinion and is not a statement of absolute facts or guarantees.
Auditors are required to express opinion as a whole on the financial statements, including
conclusion that the enterprise has followed generally accepted accounting principles (PABU) in Indonesia. Accordance with the Statement of Auditing Standards No. 29 states that there are five types of auditor opinion, namely unqualified opinion, un- qualified opinion with explanatory language added in the standard form of the auditor report, qualified opinion, unqualified opini- on, and the auditor not giving an opinion (Putri and Asyik, 2015). According to Suryanto and Pahala (2016), audit opinion is the opinion of a public accountant or inde- pendent auditor on the annual financial report of the enterprise that has been audi- ted. The auditor as an independent party in auditing the financial statements of a public enterprise provides an opinion on the audi- ted financial statements. An audit opinion is an auditor statement of his opinion regar- ding the fairness of the audited financial statements, in all material respects, which is based on the conformity of the preparation financial statements with generally accepted accounting principles (Prasath, 2017). The provision AO is based on whether the con- tents financial statements are to the Financial Accounting Standards issued by IAI. Accor- ding to IAI (2016), complete financial state- ments include statements of financial positi- on, income statements, statements of equity, cash flow, and notes to financial statements.
There are five types opinion by the auditor, namely: fair opinion without an un- qualified opinion, unqualified opinion with explanatory language, fair opinion with qualified opinion, adverse opinion, and dis- claimer opinion. Arens et al. (2017) stated unqualified or unqualified opinion with ex- planatory language on the annual financial statements is indicated as good news which tends to be published more quickly. There- fore, companies that receive audit opinions other than unqualified and unqualified with explanatory language will tend to take longer to publish their financial statements to the public. The hypotheses proposed in this research are:
H5: Auditor's opinion affects earnings persistence.
RESEARCH METHODS Types of Research
The sample in this study were all pu- blicly traded companies listed on IDX in 2017-2021 with the sampling technique used was purposive sampling. The type of data used in this research is secondary data.
Secondary data in this study is the annual report of publicly listed companies on IDX in 2017-2021. The criteria for this research sam- ple are 1) Go public companies listed on the IDX in 2017-2021. 2) Have consecutive annu- al financial reports for the previous 5-year period. 3) has data on the number of audit committee meetings and institutional ownership. 4) Financial reports use rupiah currency.
Data Collection Techniques
Research data is collected using docu- mentation methods by recording various data such as magazines, books or other sources. This research data was collected from the annual financial statements of companies listed on IDX for 2017-2021.
Variables and Operational Definitions of Variables
Earning Persistency
Profit persistence can simply be inter- preted as the possibility that a company's profit level will repeat itself in the future (sustainable earnings). Therefore, the higher the level of profit persistence, the more it will reflect the company's performance forecast in the coming period. In this study, profit persistence is measured using the coefficient of regression of this year's pretax profit against the previous year's pretax profit contained in the income statement.
Regression equation:
𝐿𝑆𝑃𝑡 = 𝛼 + 𝛽 𝐿𝑆𝑃𝑡−1 + e Information:
LSPt = Earning before tax year t α = constant
β = Profit persistence regression coefficient
LSPt-1 = Earning before tax year t-1 e = error
Good Corporate Governance
Good Corporate Governance (GCG) is a system that regulates and controls compa- nies that create added value for Stakehol- ders. Every company must ensure that GCG principles are applied to every aspect of the business and at all levels of the company.
GCG principles, namely transparency, ac- countability, responsibility, independence and fairness are needed to achieve business sustainability, the company by paying atten- tion to stakeholders. GCG is measured using the proportion of independent board of com- missioners, institutional ownership, mana- gerial ownership, and audit committee.
Auditor Quality
The quality of auditors is an auditor who is considered reputable because they are included in the Big-4 Public Accounting Firm and have the highest number of clients which indicates the high trust of issuers in the audit services of the four KAPs. In this study the quality of auditors was measured using dummy variables, namely the value of 1 for a sample of companies audited by Big - 4 and 0 for a sample of companies not audited by Big - 4.
Auditor Opinion
The auditor's opinion is fair without exception and stable from time to time shows the good performance of the company includeing the company's profit. While the auditor's opinion is unreasonable, it is the opposite of an unqualified opinion. In this study, auditors' opinions were measured using dummy variables, namely the value of 1 for unqualified opinions and 0 for other opinions (Vichitsarawong and Pornupatham, 2015).
Control Variables Leverage
When the company's leverage level is high, management will better maintain the
company's performance by providing qua- lity profit information. However, a high level of leverage can also be a consideration for management to manage company profits which will reduce the quality of company profits and affect the level of profit persis- tence. Therefore, the level of leverage has an influence on profit persistence. In this study, leverage is measured using the proportion of total liabilities from the company's total assets.
LEV = total liabilities total assets Cash Flow Volatility
Cash flow volatility is a condition of uncertainty in the company's operating activities. High cash flow volatility indicates unstable cash flow conditions so that current cash flow information cannot be used as a basis for predicting future cash flows, thus indicating low profit persistence. Conver- sely, low cash flow volatility indicates stable cash flow conditions so that current cash flow information can be used as a basis for predicting future cash flows so as to indicate high profit persistence. Thus, cash flow vola- tility has an influence on profit persistence.
In this study, cash flow volatility is measured by comparing the standard deviation of operating cash flows with total assets.
CFV=
δ (Operating Cash Flow of the Company Period t − 5 up to period t) Total Company Assets Year t Sales Volatility
Sales volatility indicates uncertainty of the company's sales information. High sales volatility makes the profit information obtai- ned cannot be used as a basis for predicting the amount of profit that will be earned in the future and indicates low profit persistence (Kusuma and Sadjiarto, 2014). Conversely, low sales volatility means that profit infor- mation can be used as a basis for predicting the amount of profit that will be earned in the future and indicating high profit persistence.
Thus, sales volatility has an influence on pro- fit persistence. In this study sales volatility is
measured using comparing the standard deviation of sales to total assets.
VP= δ (Company sales period t − 5 up to period t) Total Company Assets Year t
Classic Assumption Test
Before testing the hypothesis in this study, the model must be tested first whether it meets the classical assumptions or not. A classical assumption test should be perfor- med in this study, to test whether the data meets the classical assumptions. This is done to avoid biased estimates, considering that not all data can be regressed. The tests car- ried out are normality tests, multicollinearity tests, heteroscedasticity tests, and autocorre- lation tests.
Normality Test
The normality test aims to test whether in a regression model, confounding or resi- dual variables have a normal distribution. A good regression model is to have a normal distribution of data. The normality test was performed with Kolmogorov-Smirnov statis- tics against unstandardized residual regres- sion results. The data is said to be normal if the probability value (sig) of Kolmogorov- Smirnov is greater than α=0,05. The follow- ing table 1 is the result of the Research Data Normality test.
Table 1 Normality Test
One-Sample Kolmogorov-Smirnov Test Unstandardize d Residual
N 989
Normal
Parametersa,b Mean ,0000000
Std. Deviation 9,635451981 Most
Extreme Differences
Absolute ,064
Positive ,060
Negative -,064
Kolmogorov-Smirnov Z ,667
Asymp. Sig. (2-tailed) ,843
a. Test distribution is Normal.
b. Calculated from data.
Source: Processed secondary data (2022)
Based on the table 1, it can be seen that the Kolmogorov-Smirnov (K-S) value ob- tained by Earning Persistence is 0.667 and the significance level at 0.843 which is greater than the significance level of 0.05. Thus, it can be concluded that the data in the regression model has been distributed normally.
Heteroscedasticity Test
The heteroscedasticity test aims to test whether in the regression model there is an inequality of variance from the residual of one observation to another. If the variance from the residual of one observation to another observation is fixed, then it is called homoscedasticity and if it is difference it is called heteroscedasticity. A good regression model is one in which homoscedasticity or heteroscedasticity does not occur. Testing is carried out with the Glejser test, which is by progressing the absolute value of unstandar- dized residual regression results with inde- pendent variables used in the regression equation. Data are said to be free of hetero- scedasticity if the probability (sig) regression coefficient (β) of each independent variable is greater than α=0,05 (Ghozali, 2016). The
following table 2 is the result of the Hetero- scedasticity test of research data.
Based on Table 2, all independent and control variables each give a significance value of > 0.05 so that it can be concluded that all independent and control variables are free from heteroscedasticity.
Multicollinearity Test
The multicollinearity test aims to test whether in the regression model there is a correlation between independent variables.
A good regression model should not have correlations among independent variables. If the independent variables correlate with each other, then these variables are not orthogonal. 54 Orthogonal variables are independent variables whose correlation value between variables among independent variables is equal to zero. Variability is free from multicholinerality if the tolerance value is >0.1 or equal to the < value of 10 VIFs.
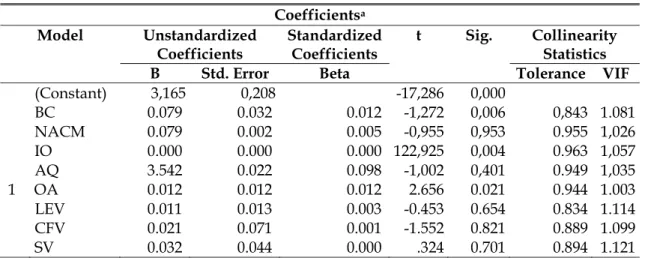
Based on Table 3, all independent and control variables respectively give a toleran- ce value of > 0.1 and a VIF value of < 10 so that it can be concluded that all independent and control variables have been free from the problem of multicollinearity.
Table 2
Heteroscedasticity Test Coefficientsa
Model Unstandardized Coefficients Standardized Coefficients t Sig.
B Std. Error Beta
1 (Constant) 0,027 0.211 0,140 0.799
BC 0,132 0.111 0.076 1,998 0.091
NACM 0,001 0.021 0.001 0.066 0.612
IO 0,007 0.052 0.000 0.531 0.731
AQ -0,041 0.015 -0.042 -0.878 0.331
OA -0,029 0.199 -0.069 2.176 0.064
LEV 0,411 0.001 0.030 0.653 0.512
CFV 0,005 0.066 0.046 -1.140 0.421
SV -0,033 0.081 -0.013 -0,666 0.511
a. Dependent Variable: EP
Source: Processed secondary data (2022)
Table 3
Multicollinearity Test Coefficientsa Model Unstandardized
Coefficients Standardized
Coefficients t Sig. Collinearity Statistics
B Std. Error Beta Tolerance VIF
(Constant) 3,165 0,208 -17,286 0,000
BC 0.079 0.032 0.012 -1,272 0,006 0,843 1.081
NACM 0.079 0.002 0.005 -0,955 0,953 0.955 1,026 IO 0.000 0.000 0.000 122,925 0,004 0.963 1,057
AQ 3.542 0.022 0.098 -1,002 0,401 0.949 1,035
1 OA 0.012 0.012 0.012 2.656 0.021 0.944 1.003 LEV 0.011 0.013 0.003 -0.453 0.654 0.834 1.114 CFV 0.021 0.071 0.001 -1.552 0.821 0.889 1.099
SV 0.032 0.044 0.000 .324 0.701 0.894 1.121
a. Dependent Variable: EP
Source: Processed secondary data (2022)
Table 4 Autocorrelation Test
Model Summaryb
Model R R Square Adjusted R Square Std. Error of the Estimate Durbin-Watson
1 0.878a 0.891 0.922 0.283190 2,044
a. Predictors: (Constant), BC, NACM, IQ, AQ, OA, LEV, CFV, SV b. Dependent Variable: EP
Source: Processed secondary data (2022)
Autocorrelation Test
Autocorrelation test Aims to test whe- ther in a regression model there is a correla- tion between confounding errors in period t with errors in period t-1 (previous). If there is a correlation, then there is an autocorre- lation problem. Autocorrelation arises be- cause successive observations over time are related to each other. A good regression mo- del is one that is free from autocorrelation.
The test was carried out by comparing the Durbin-Watson (DW) value of the regression
result with the value in the Durbin-Watson (DW) table with criteria (Ghozali, 2016) (tabel 4).
Based on the regression results as shown in table 4, it shows a Durbin Waston (DW) value of 2.044 with a DW value between dU and 4 – dU (1.77 77 < DW < 2.2863), meaning that the regeneration model is free from autocorrelation. The following decision making on whether or not there is autocor- relation is explained in figure 1.
Figure 1
Result Autocorrelation Test
Source: Processed secondary data (2022)
Multiple Regression Analysis
The analytical model used to test the hypothesis is a multiple regression model.
The test was conducted to determine whe- ther there is an effect of good corporate governance, audit quality, an auditor's opini- on on earnings persistence. The regression equations used in this study are:
PL = β0 + β1 IDK + β2 JPKA + β3 KI + β4 KA + β5 OA + β6 LEV + β7 VAK + β8 VP + e EP : Earning Persistence
β0 : Intersep β1-β9 : Koefisien
IBC : Independence of Board Commissioners
NACM : Number of Audit Committee Meetings
IO : Institutional Ownership AQ : Auditor Quality
AO : Auditor Opinion LEV : Leverage
CFV : Cash Flow Volatility SV : Sales Volatility e : Error
To test the effect of the independent variable (X) on the dependent variable (Y) either partially or jointly, the determinant coefficient (R2), individual parameter signifi- cance test (t-test), and simultaneous signifi- cance test (F statistic test) were carried out.
ANALYSIS AND DISCUSSIONS Descriptive Statistical Analysis
Descriptive statistics are used to provide an overview or description of the variables contained in this study. The descriptive tests used include the average (mean), standard deviation, maximum, and minimum (Ghozali, 2016). The maximum value is used to determine the smallest amount of data used. The maximum value is used to determine the smallest amount of data used.
The mean is used to determine the average data used. The standard deviation is used to find out how much the relevant data varies from the average and to identify the standard size of each variable. Based on test of results, research is independent from the classical assumption. SPSS results test of the descriptive statistics can be show in Table 5.
Based on Table 5, the variable persis- tence of profit has a minimum value of -1.846 and a maximum value of 2.334. This shows that the minimum profit persistence value range is -1.846 and the maximum is 2.334.
The average earnings persistence value is 0.352 and the standard deviation is 0.602.
This means that the average coefficient of regression of this year's pretax profit to the previous year's pretax profit contained in the income statement is 35%. Profit persistence is a measure of profit quality based on the view that a more sustainable profit is a profit that has better quality. Getting closer to 100%
indicates that the predictive power of profit is getting better.
Autocorrelation
Positive Autocorrelation
Negative
No desicison No desicison
No autocorrelation positive or
negative
0 Dl 4
1,6038
4-dL 2,3962 Du
1,7777
4-dU 2,2863 DW
2,044
Table 5
Descriptive Statistics Test Results Descriptive Statistics
N Minimum Maximum Mean Std. Deviation
EP 989 -1.846 2.334 0.352 0.602
IBC 989 0.210 989 0.420 0.117
NACM 989 1 69 6.54 6.942
IO 989 0.109 0.943 0.576 0.176
LEV 989 0.100 0.972 0.562 0.243
CFV 989 0.091 0.771 0.062 0.064
SV 989 0.082 0.905 0.113 0.142
Valid N (listwise) 989
Source: Processed secondary data (2022)
The variable independence of the board of commissioners has a minimum value of 0.210 and a maximum value of 0.989. This shows that the range of the value of inde- pendence of the board of commissioners in the minimum sample company is 0.210 and the maximum is 0.989. The average indepen- dence value of the board of commissioners is 0.420 and the standard deviation is 0.117.
This means that the average percentage of the number of independent board of com- missioners to the total number of com- missioners in the composition of the board of commissioners of the sample company is 42%. The average independence of the board of commissioners from all members of the board of commissioners in the composition of the board of commissioners of the sample company is in accordance with the Financial Services Authority Regulation Number 33/
POJK.04/2014concerningtheBoardofDirec- tors and Board of Commissioners of Issuers or Public Companies which states that the number of independent commissioners must be at least 42% (forty-two percent) of the total members of the board of commissioners.
This means that the average independence of the board of commissioners is good because it has exceeded existing provisions.
The variable number of audit committee meetings has a minimum value of 1.00 and a maximum value of 69.00. This shows that the range of values for the minimum number of audit committee meetings is 1.00 and the
maximum is 69.00. The average value of the number of audit committee meetings is 6.54 and the standard deviation is 6.942. This means that the average number of audit committee meetings each year is 8x a year.
The average number of audit committee meetings is in accordance with the Decree of the Chairman of the Capital Market and Financial Institution Supervisory Agency Number: Kep-643 / BL / 2012 concerning the Establishment and Work Guidelines of the Audit Committee which states that the audit committee holds meetings at least 2x a year.
This means that the average number of audit committee meetings is good because it has exceeded existing provisions.
The institutional ownership variable has a minimum value of 0.109 and a maximum value of 0.943. This shows that the range of institutional ownership values is 0.109 and the maximum is 0.943. The mean value of institutional ownership was 0.57.6and the standard deviation was 0.176. This means that the average percentage of the number of shares owned by institutions (domestic and foreign) to the total outstanding shares is 57%. The higher the percentage of institu- tional ownership, the more monitoring is carried out by institutional investors (domes- tic and foreign). This means that on average the sample of companies in this study are owned by institutional investors.
The variable leverage (LEV) has a mini- mum value of 0.100 and a maximum value of
0.972. This shows that the minimum leverage range is 0.100 and the maximum is 0.972. The average leverage value is 0.562 and the standard deviation is 0.243. This means that the average proportion of total debt from the company's total assets is 24%. When the com- pany's leverage level is high, management will better maintain the company's perfor- mance by providing quality profit informa- tion. However, a high level of leverage can also be a consideration for management to manage company profits which will reduce the quality of company profits and affect the level of profit persistence.
The variable leverage (LEV) has a mini- mum value of 0.100 and a maximum value of 0.972. This shows that the minimum leverage range is 0.100 and the maximum is 0.972. The average leverage value is 0.562 and the standard deviation is 0.243. This means that the average proportion of total debt from the company's total assets is 24%. When the company's leverage level is high, manage- ment will better maintain the company's per- formance by providing quality profit infor- mation. However, a high level of leverage can also be a consideration for management to manage company profits which will reduce the quality of company profits and affect the level of profit persistence.
Conversely, low cash flow volatility indicates stable cash flow conditions so that current cash flow information can be used as a basis for predicting future cash flows so as to indicate high profit persistence. The sales volatility (VP) variable has a minimum value of 0.083 and a maximum value of 0.905. This shows that the minimum range of sales volatility is 0.083 and the maximum is 0.905.
The average value of selling volatility is 0.1.13 and the standard deviation is 0.142.
This means that the average ratio of standard deviation of sales to total assets is 1.4%. Sales volatility indicates uncertainty of the com- pany's sales information. In unstable opera- ting environments, companies tend to use estimates and estimates so that the possi- bility of misestimation in sales and profit information is greater. High sales volatility makes the profit information obtained can- not be used as a basis for predicting the amount of profit that will be earned in the future and indicates low profit persistence.
Conversely, low sales volatility means that profit information can be used as a basis for predicting the amount of profit that will be earned in the future and indicating high profit persistence.
Auditor quality is measured by assign- ing a value of 1 to the sample of companies audited by the Big-4 and 0 to the sample of companies that are not audited by the Big-4.
Based on Table 6, of the 989 sample compani- es, 557 companies are not audited by the Big- 4, and432companiesareauditedbytheBig-4.
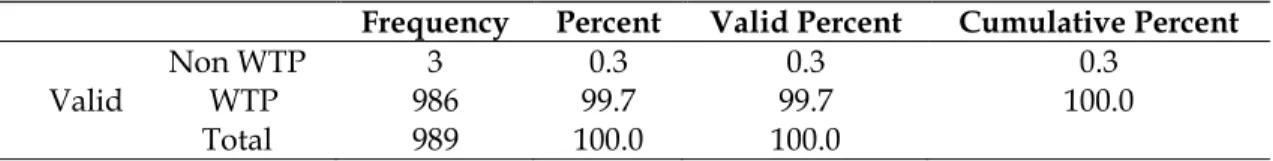
The auditor's opinion in this study is measured by giving a value of 1 for an unqualified opinion and 0 for other opinions.
Based on Table 7, of the 989 sample com- panies, 3 companies have an auditor opinion other than the WTP, and 986 companies have an auditor's opinion WTP.
Furthermore, based on the results of the classical assumption test, it can be stated that the data in this study are normal, free from heteroscedasticity, multicollinearity, and autocorrelation.
Table 6 Auditor Quality
Frequency Percent Valid Percent Cumulative Percent
Non Big-4 557 56.3 56.3 56.3
Valid Big-4 432 43.7 43.7 100.0
Total 989 100.0 100.0
Source: Processed secondary data (2022)
Table 7 Auditor Opinion
Frequency Percent Valid Percent Cumulative Percent
Non WTP 3 0.3 0.3 0.3
Valid WTP 986 99.7 99.7 100.0
Total 989 100.0 100.0
Source: Processed secondary data (2022)
Table 8
Descriptive Statistics Test Results Coefficientsa
Model Unstandardized
Coefficients Standardized
Coefficients t Sig Sig/2 HA
B Std. Error Beta
1 (constant) IBC NACM IO AQ OA LEV CFV SV
-1.956 0.079 0.000 3.243 -0.009 0.159 -0.008 -0.117 -0.006
0.077 0.038 0.001 0.022 0.007 0.072 0.018 0.065 0.030
0.015 -0.001 0.965 -0.007 0.013 -0.003 -0.012 -0.002
-22.992 1.901 -0.673 123.225 -1.192 2.133 -0.432 -1.678 -0.333
0.000 0.042 0.511 0.002 0.032 0.000 0.602 0.771 0.741
0.021 0.255 0.001 0.016 0.000
accepted rejected accepted accepted accepted
a. Dependent Variable: PL
Source: Processed secondary data (2022)
Multiple Regression Analysis
Multiple regression analysis was used to determine the effect of the independent variable on the dependent variable. This test is used to determine the effect of CSR disclosure, auditor quality (KA), an auditor opinion (OA) on earnings persistence (PL).
The regression equation model from the results of this study are:
Y= -1,956 + 0,079 IBC + 0,000 NACM + 3,243 IO - 0,009 AQ + 0,159 OA - 0,008 LEV - 0,117 CFV - 0,006 SV
Table 8 is the result of multiple regres- sion tests. From table 8 can be explained effect of each independent variable (IBC, NACM, IO, AQ, and OA) and control variables (LEV, CFV, and SV) on EP namely:
1) IBC has a significance value / 2 of 0.021 <
0.05 and a regression coefficient of 0.079 > 0 indicating statistically significant positive.
This means that the independence of the board of commissioners has a positive effect on earnings persistence. Thus, H1 which states that the independence of the board of commissioners has a positive effect on earnings persistence is accepted. 2) NACM has a significance value (number of audit committee meetings) has a significance level value/2 of 0.255 <0.05, indicating that it is not statistically significant. This means that the number of audit committee meetings does not affect earnings persistence. Thus, H2 which states that the number of audit committee meetings has a positive effect on earnings persistence is rejected. 3) IO has a significant value (institutional ownership) has a significant level of 0.001 < 0.05 and a
regression coefficient of 3.243 > 0 which is statistically significant. This means that institutional ownership has a positive effect on earnings persistence. Thus, H3 which states that institutional ownership has a positive effect on earnings persistence is accepted. 4) AQ has a significance value (auditor quality) has a significance level value of 0.016 < 0.05, indicating that it is not statistically significant. This means that the quality of the auditor does not affect earnings persistence. Thus, H4 which states that auditor quality has a positive effect on earnings persistence is accepted.5) Variable OA has a significance value (auditor's opinion) has a significance level value / 2 of 0.000 < 0.05 and a regression coefficient of 0.159 > 0 indicating statistically significant positive. This means that the auditor's opinion has a positive effect on earnings persistence. Thus, H5 which states that the auditor's opinion has a positive effect on earnings persistence is accepted. 6) The LEV (leverage) variable has a significant level of
0.602 > 0.05, indicating that it is not statist- ically significant. This means that leverage as a control variable does not affect earnings persistence. 7) LEV (cash flow volatility) variable has a significant level of 0.771 > 0.05, which is not statistically significant. This means that cash flow volatility as a control variable does not affect earnings persistence.
8) The VP variable (sales volatility) has a significant level of 0.741 > 0.05, which is statistically not significant. This means that sales volatility as a control variable does not affect earnings persistence.
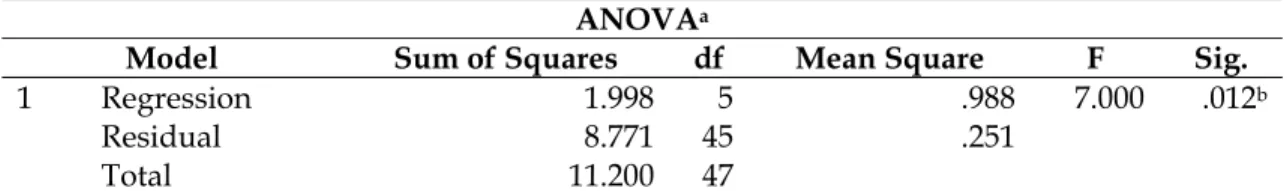
Based on ANOVA test in table 9, it show that the Fcount is 7,000 with a significance level 0.006. This shows that the IBC, NACM, IO, AQ, and AO variables have a simulta- neous effect on EP.
Based on the adjusted R2 value in table 10, it is found that the adjusted R2 value is 0.698. This means that 69.8% of EP is influenced by IBC, NACM, IO, AQ and AO.
While the remaining 30.2% is influenced by other factors outside the model.
Table 9 Anova Test Result
ANOVAa
Model Sum of Squares df Mean Square F Sig.
1 Regression Residual Total
1.998 8.771 11.200
5 45 47
.988
.251 7.000 .012b
a. Dependent Variable: EP
b. Predictors : (Constant): IBC, NACM, IO, AQ, AO Source: Processed secondary data (2022)
Table 10
Coefficient of Determination Analysis (R2) Test Model Summaryb
Model R R Square Adjusted R Square Std. Error of the Estimate
1 .512a .715 .698 .51108
a. Predictors: (Constant), IBC, NACM, IO, AQ, AO b. Dependent Variable: EP
Source: Processed secondary data (2022)
DISCUSSION
The Independence of Board Commissioners Affects Earnings Persistence
Based on t-test (table 8), it can be concluded that IBC has a positive effect on EP in traded companies registered on the IDX during 2017-2021 period. The results of the t-test show that IBC has a positive and significant effect on EP. Thus, hypothesis 1 which states that IBC affects EP is accepted.
This means that the higher the IBC, the higher the EP. The results of this study are in line with the results of research conducted by Khafid (2012); Farida (2013); Kusuma and Sadjiarto (2014) and Marisatusholekha and Budiono (2015) who found that IBC affected EP. The IBC protects the interests of share- holders through monitoring and control. The greater the proportion of independent com- missioners, the more effective it is in monitoring management behavior. Indepen- dent commissioners influence various decisi- ons, including increasing firm value by protecting the interests of shareholders against managerial opportunism so that it has a positive effect on EP.
Number of Audit Committee Meetings Affects Earnings Persistence
Based on t-test (table 8), it can be concluded NACM does not have a positive effect on EP in traded companies registered on the IDX during 2017-2021 period. The results of the t-test show that NACM does not affect EP. Thus, hypothesis 2 which states that NACM affects EP is rejected. This means that the NACM does not affect EP. The results of this study do not support Hamdan et al. (2013); Hsu and Hu (2016) who found that NACM affected EP. There is a regulation that requires audit commitee to hold a meet- ing based on the Decree of the Chairman BAPEPAM Number: Kep-643/Bl/2012 con- cerning the Establishment and Guidelines for the Work Implementation of the Audit Committee.
Institutional Ownership Affects Profit Persistence
Based on t-test (table 8), it can be con- cluded that IO has a positive effect on EP in trade companies registered on the IDX du- ring 2017-2021 period. The results of the t- test show that IO has a positive and significant effect on EP. Thus, hypothesis 3 which states that IO affects EP is accepted.
This means that the higher institutional ownership, the higher the EP. The results research are in line with Junawatiningsih and Harto (2014), Al-Dhamari and Ismail (2013) also found that IO had a positive effect on EP. IO is share ownership by financial or non-financial institutions or other legal entities. IO influences EP. Investors who come from outside (foreign investors) are better able to control the enterprise mana- gement because they have sufficient know- ledge and resources. Institutional sharehold- ers can also influence the enterprise in different ways, for example by putting pres- sure on certain issues and activities to control the internal decision process through mem- bership of the enterprise board of directors.
Auditor Quality Affects Earnings Persistence
Based on t-test (table 8), it can be con- cluded that AQ has an effect on EP in traded companies registered on the IDX during the 2017-2021 period. The results of the t-test show that AQ affects EP. Thus, hypothesis 4 which states that AQ affects EP is accepted.
This means that auditor quality affects EP.
The results of this study contradict with by Juliardi (2013), Prajitno (2019) which found that AQ did not affect EP. Auditing is a process to minimiza the imbalance (balance) of information that exists on both sides among managers and shareholders with the help of using an external intermediary to provide validity to the financial statements so that the discrepancy can be corrected.
Users of financial statements, especially shareholders, will make decisions based on reports made by auditors regarding the financial statements of a enterprise. This
means that the quality of the auditor is important in the auditing process. AQ is measured by companies audited by Big-4 and non-Big-4. This does not mean that non- Big-4 KAPs have poor AQ so auditor quality does not affect EP because both Big-4 KAPs and non-Big-4 KAPs both have standards in auditor recruitment and have operating standards in auditing. In addition, in terms of economic effects, the quality of auditors has nothing to do with macroeconomic conditions that can affect the amount of profit generated by the enterprise.
Auditor Opinion Affects Earnings Persistence
Based on t-test (table 8) it can be concluded that OA has a positive effect on EP in traded companies registered on the IDX during 2017-2021 period. The results t-test, show OA has a positive and significant effect on EP. Thus, hypothesis 5 which states that OA affects EP is accepted. This means that the better auditor opinion, the higher persistence of earnings. The results research are different from Vichitsarawong and Pornupatham (2015), and Santana and Wirakusuma (2016) which found that OA did not affect EP. The auditor opinion is unqualified and stable from time to time, indicating the good performance of the enterprise, including the enterprise profit.
Profits are reported as is and free from manipulative actions because of the unqua- lified opinion that can only be given by the auditor if there are no restrictions on the scope of the audit. This means that earnings have a high level of persistence and can be used as a basis for predicting future earnings.
CONCLUSION AND SUGGESTION Conclusion
This study concludes that the indepen- dence of the board of commissioners, institu- tional ownership and auditor opinion have a positive effect on earnings persistence. While the number of audit committee meetings, auditor quality has no positive effect on earnings persistence. As for the control
variables, namely leverage, cash flow vola- tility and sales volatility proved to have no effect on earnings persistence.
Suggestion
This study has limitations that can be used as a consideration for the next research- er to get better research results. The limita- tion of this study lies in data management techniques that still use multiple linear regression, preferably for panel data, using panel data regression. So suggestions for future research can use panel data regression in data management.
The suggest research for further research is to add other independent variables such as managerial ownership. The ownership of shares from the enterprise internal parties (managers or directors) means that they also own the enterprise and minimize the act of playing a profit that affects the earning persistence.
REFERENCES
Adiputra, I. M. S., N. K. Sinarwati, and I. G.
A. Purnamawati. 2017. Pengaruh Pemahaman Akuntansi Berbasis SAK ETAP, Kualitas Pelatihan, dan Sistem Pengendalian Internal Terhadap Kualitas Laporan Keuangan Koperasi (Studi Empiris Pada Koperasi Simpan Pinjam Di Kecamatan Karangasem).
JIMAT (Jurnal Ilmiah Mahasiswa Akuntansi) Undiksha 8(2). https://
doi.org/10.23887/jimat.v8i2.12269.
Al-Dhamari, R. and K. N. Ismail. 2013.
Governance Structure, Ownership Structure and Earning Predictability:
Malaysian Evidence. Asian Academy of Management Journal of Accounting and Finance 9(1): 1-23. https://ssrn.com/
abstract=2945299.
Alfiarini, A. 2015. Pengaruh Book Tax Differences terhadap Earnings Persis- tence dengan Komponen Akrual seba- gai Variabel Moderasi pada Perusa- haan Jasa di Indonesia. Skripsi.
Universitas Diponegoro. Semarang.
Al-Gamrh, B. and R. A. Al-Dhamari. 2016.
Firm Characteristics and Corporate Social Responsibility Disclosure. Inter- national Business Management 10(18):
4283-4291. https://dx.doi.org/10.
2139/ssrn.2907396.
Anwar, A. and A. Amrizal. 2019. Pengaruh Opini Audit, Ukuran Perusahaan, dan PergantianManajementerhadapAudi- tor Switching pada Perusahan Manu- faktur Subsektor Makanan dan Mi- numan. Indonesian Journal of Economics Application (IJEA) 1(2): 81-90. https:
//doi.org/10.32546/ijea.v1i2.224.
Arisudhana, D. 2017. Pengaruh Audit Delay, Ukuran Klien, Opini Audit Tahun Sebelumnya, Reputasi Kantor Akun- tan Publik, Dan Return on Assets (Roa) Terhadap Pergantian Auditor Sukarela (Studi Empiris pada Perusa-haan Sub Sektor Property Dan Real Estate Yang Terdaftar Pada Bursa Efek Indonesia Periode 2011-2015). Jurnal Akuntansi dan Keuangan 6(1): 100- 120. http://
dx.doi.org/10.36080/jak.v6i1.353.
Arens, A. A., R. J. Elder, M. S. Beasley, and C.
Hogan. 2017. Auditing and Assurance Services an Integrated Approach. Pearson Education Limited. England.
Asma, T. N. 2013. Pengaruh Aliran Kas dan Perbedaan antara Laba Akuntansi de- ngan Laba Fiskal terhadap Persistensi Laba. Jurnal Akuntansi 1(1): 1-16.
https://ejournal.unp.ac.id/students/i ndex.php/akt/article/view/95.
Awasthi, K. 2017. Taking Stock of the Principal-Principal Agency Perspec- tive: a Review and the Way Ahead.
International Business Strategy: 17–42.
https://doi.org/10.1057/978-1-137- 54468-1_2.
Azila-Gbettor, E. M., B. Q. Honyenuga, M.
M. Berent-Braun, and A. Kil. 2018.
Structural Aspects of Corporate Gover- nance and Family Firm Performance: a Systematic Review. Journal of Family Business Management 8(3): 306-330.
https://doi.org/10.1108/JFBM-12- 2017-0045.
Bae, S. M., M. A. K. Masud, and J. D. Kim.
2018. A Cross-Country Investigation of Corporate Governance and Corporate Sustainability Disclosure: a Signaling Theory Perspective. Sustainability 10(8): 2611. https://doi.org/10.3390/
su10082611.
Bhagat, S. and B. Bolton. 2019. Corporate Governance and Firm Performance:
the Sequel. Journal of Corporate Finan- ce 58: 142–168. https://doi.org/10.
1016/j.jcorpfin.2019.04.006.
Bhatt, P. R. and R. R. Bhatt. 2017. Corporate Governance and Firm Performance in Malaysia. Corporate Governance: The International Journal of Business in Society 17(5): 896–912. https://doi.
org/10.1108/CG-03-2016-0054.
Buallay, A., A. Hamdan, and Q. Zureigat.
2017. Corporate Governance and Firm Performance: Evidence from Saudi Arabia. Australasian Accounting, Busi- ness and Finance Journal 11(1): 78-98.
http://dx.doi.org/10.14453/aabfj.v11i 1.6.
Christiantie, J. dan Y. J. Christiawan. 2013.
Analisis Pengaruh Mekanisme Cor- porate Governance dan Reputasi KAP Terhadap Aktivitas Manajemen Laba.
Business Accounting Review 1(2): 1-11.
https://publication.petra.ac.id/index.
php/akuntansi-bisnis/article/view/
1041.
Chrisyanti, F. 2015. Analisis Faktor-Faktor yang Mempengaruhi Book-Tax Diffe- rences dan Pengaruhnya terhadap Per- sistensi Laba. Jurnal Calyptra: Jurnal Ilmiah Mahasiswa Universitas Surabaya 4(1): 1-20. https://journal.ubaya.ac.id/
index.php/jimus/article/view/1011.
DeAngelo, L. E. 1981. Auditor Independence,
“Low Balling”, and Disclosure Regula- tion. Journal of Accounting and Econo- mics 3(2): 113-127. https://doi.org/10.
1016/0165-4101(81)90009-4.
Devi, N. M. S. U., N. P. Y. Mendra, and N. L.
G. Novitasari. 2019. Faktor-Faktor yang Mempengaruhi Price Earning Ratio. Jurnal Ilmiah Manajemen & Akun-
tansi 25(1): 14-26. http://
triatmamulya.ejurnal.info/index.php/
triatmamulya/article/view/121.
Dewata, E., Y. Sari, and E. J. Fithri. 2016.
Kepemilikan Manajerial dan Kepemi- likan Institusional sebagai Determinan Struktur Modal dan Persistensi Laba.
Jurnal Riset dan Aplikasi: Akuntansi dan Manajemen 1(3): 223-235. http://jurnal.
polinema.ac.id/index.php/JRAAM/a rticle/view/1818.
Farida, U. 2013. Manajemen Sumber Daya Manusia II. Pusat Penerbitan Fakultas Ekonomi Universitas Muhammadiyah.
Ponorogo.
Febiyanto, P. and N. Cahyonowati. 2014.
Pengaruh Perbedaan Laba Akuntansi dan Laba Fiskal (Book-Tax Differences) terhadap Pertumbuhan Laba (Studi Empiris pada Perusahaan Manufaktur yang Terdaftar di Bursa Efek Indonesia Tahun 2009-2011). Diponegoro Journal of Accounting 3(3): 696–706. https://
ejournal3.undip.ac.id/index.php/acco unting/article/view/6212.
Ghozali, I. 2016. Application of Multivariete Analysis with IBM SPSS 23 Program.
Diponegoro University Publishing Board. Semarang.
Hamdan, A. 2020. The Role of the Audit Committee in Improving Earnings Quality: The Case of Industrial Com- panies in GCC. Journal of International Studies 13(2): 127–138. https://www.
ceeol.com/search/article- detail?id=979984.
Hamdan, A. M., S. Mushtaha, and A. Musleh Al-Sartawi. 2013. The Audit Commit- tee Characteristics and Earnings Quality: Evidence from Jordan. Austra- lasian Accounting, Business and Finance Journal 7(4): 51-80. https://dx.doi.
org/10.2139/ssrn.2839158.
Hati, I. P. and I. Rosini. 2017. Pengaruh Opini Audit Tahun Sebelumnya dan Kondisi Keuangan terhadap Opini Audit Going Concern. Journal of Applied Accounting and Taxation 2(2): 123-133.
https://doi.org/10.5281/zenodo.1306 138.
Hsu, P. H. dan X. Hu. 2016. Advisory Board and Earnings Persistence. Journal of Accounting, Auditing & Finance 31(1):
134-157. https://doi.org/10.1177/
0148558X15571733.
Ikatan Akuntan Indonesia (IAI). 2016.
Standar Akuntansi Keuangan revisi 2016.
Salemba Empat. Jakarta.
Imar, M. V. and D. Effendi. 2019. Pengaruh Kualitas Auditor dan Opini Audit Terhadap Kualitas Laporan Keuangan.
Jurnal Ilmu dan Riset Akuntansi, 2.
Irfan, F. H. 2013. Pengaruh Perbedaan Laba Akuntansi dan Laba Fiskal terhadap Persistensi Laba dengan Komponen Akrual dan Aliran Kas Sebagai Variabel Moderasi. Diponegoro Journal of Accounting 2(2): 1- 13.
Jensen, M. C. and W. H. Meckling. 1976.
Theory of the Firm: Managerial Beha- vior, Agency Costs and Ownership Structure. Journal of Accounting and Economics 3(4): 305-360.
Suryanto, J. and I. Pahala. 2016. Analisa Faktor–faktor yang Berpengaruh terhadap Ketepatan Waktu Pelaporan Keuangan (Studi Empiris pada Perusahaan Otomotif dan Komponen dan Telekomunikasi yang Terdaftar di Bursa Efek Indonesia). Jurnal Wahana Akuntansi 11(2).
Juliardi, D. 2013. Pengaruh Leverage, Konsentrasi Kepemilikan dan Kualitas Audit terhadap Nilai Perusahaan Serta Laba Persistensi (Studi Perban-dingan antara Perusahaan-perusahaan Manu- faktur yang Diaudit KAP 4 Besar dan KAP Non 4 Besar). Jurnal Akun-tansi Aktual 2(2): 113–122. http://journal.
um.ac.id/index.php/jaa/article/view /8316.
Junawatiningsih, T. dan P. Harto. 2014.
Analisis Pengaruh Mekanisme Internal dan Eksternal Corporate Governance terhadap Persistensi Laba. Diponegoro Journal of Accounting: 338-348.
https://ejournal3.undip.ac.id/index.p hp/accounting/article/view/10269.
Khafid, M. 2012. Pengaruh Tata Kelola Perusahaan (Corporate Governance) Dan Struktur Kepemilikan Terhadap Persistensi Laba. Jurnal Dinamika Akuntansi 4(2): 139-148. https://doi.
org/10.15294/jda.v4i2.2172.
Kusuma, B. and R. A. Sadjiarto. 2014. Analisa Pengaruh Volatilitas Arus Kas, Volati- litas Penjualan, Tingkat Hutang, Book Tax Gap dan Tata Kelola Perusahaan Terhadap Persistensi Laba. Tax &
Accounting Review 4(1). https://
publication.petra.ac.id/index.php/ak untansi-pajak/article/view/3098.
Marisatusholekha dan E. Budiono. 2015.
Pengaruh Komisaris Independen, Reputasi KAP, Persistensi Laba, dan Struktur Modal Terhadap Kualitas Laba (studi pada perusahaan teleko- munikasi yang terdaftar di BEI tahun 2009- 2013). eProceedings of Management 1(3). https://openlibrarypublications.
telkomuniversity.ac.id/index.php/ma nagement/article/view/3719.
Musa, L. B. And R. A. Latiff. 2017. The Influence of Innate Factors on Earnings Quality in Malaysia: Before and After Global Financial Crisis. Journal of Business and Economics 8(8): 666– 671.
DOI:10.15341/jbe(2155- 7950)/08.08.2017/004.
Neag, R. and E. Masca. 2015. Identifying Accounting Conservatism–a Literature Review. Procedia Economics and Finance 32(2015): 1114-1121. https://doi.org/
10.1016/S2212-5671(15)01576-2.
Oktapiani, K. and E. Ruhiyat. 2019. Kualitas Laba: Investment Opportunity Set dan Komite Audit. Jurnal Ilmiah Akuntansi Univesitas Pamulang 7(2): 173–188.
https://core.ac.uk/download/pdf/33 7609194.pdf.
Pratiwi, I. R. and Zulaikha. 2014. Analisis Pengaruh Book-Tax Differences terha- dap Persistensi Laba. Diponegoro Jour- nal of Accounting: 443-451.
https://ejournal3.undip.ac.id/index.p hp/accounting/article/view/6189.
Prasath, S. 2017. Cost Accounting and Financial Management: a Practical Guide. Wolters Kluwer Publishing. India.
Prasetyo, B. H. dan Rafitaningsih. 2015.
Analisis Book Tax Differences ter- hadap Persistensi Laba, Akrual dan Aliran Kas pada Perusahaan Jasa Tele- komunikasi. JIAFE (Jurnal Ilmiah Akun- tansi Fakultas Ekonomi) 1(1): 27-32.
https://doi.org/10.34204/jiafe.v1i1.293.
Prajitno, I. P. 2019. Pengaruh Good Corporate Governance, Kualitas Auditor Dan Opini Auditor Terhadap Persistensi Laba. Thesis. Unika Soegijapranata Semarang.
Putri, K. P. dan N. F. Asyik. 2015. Pengaruh Profitabilitas, Solvabilitas, Opini Auditor, Ukuran Perusahaan, dan Reputasi Auditor Terhadap Audit Delay. Jurnal Ilmu & Riset Akuntansi 4(9). http://
jurnalmahasiswa.stiesia.ac.id/index.p hp/jira/article/view/3179.
Putri, A. R. and Andayani. 2017. Pengaruh Kebijakan Hutang, Profitabilitas, Likuiditas, dan Kesempatan Investasi terhadap Kebijakan Dividen. Jurnal Ilmu Dan Riset Akuntansi 6(6): 1–15.
http://jurnalmahasiswa.stiesia.ac.id/i ndex.php/jira/article/view/1213.
Santana, D. K. W. and G. M. Wirakusuma.
2016. Pengaruh Perencanaan Pajak, Kepemilikan Manajerial dan Ukuran Perusahaan terhadap Praktek Manaje- men Laba. E-Jurnal Akuntansi Univer- sitas Udayana 14(3).
Shiri, N., D. Mohammadi, and S. M.
Hosseini. 2012. Entrepreneurial Inten- tion of Agricultural Students: Effects of Role Model, Social Support, Social Norms and Perceived Desirability.
Archives of Applied Science Research 4(2):
892-897.
Sulistyanto, H. R. and Y. W. Nugrahanti.
2013. Analisis Perbedaan Ketepatan Waktu Internet Financial Reporting pada Perusahaan Manufaktur yang Terdaftar di BEI. Jurnal Dinamika
Akuntansi 5(2): 146-156. https://doi.
org/10.15294/jda.v5i2.2995.
Sumantri, F. A. 2018. Pengaruh Opini Audit dan Corporate Governance Terhadap Kualitas Laporan Keuangan. Primano- mics: Jurnal Ekonomi & Bisnis 16(1): 41–
69. https://doi.org/10.31253/pe.
v16i1.56.
Suwandika, I. M. A. and I. B. P. Astika. 2013.
Pengaruh Perbedaan Laba Akuntansi, Laba Fiskal, Tingkat Hutang pada Persistensi Laba. E-Jurnal Akuntansi Universitas Udayana 5(1): 196-214.
Vichitsarawong, T. and S. Pornupatham.
2015. Do Audit Opinions Reflect Ear- nings Persistence? Managerial Auditing Journal 30(3): 244-276. https://doi.
org/10.1108/MAJ-12-2013-0973.
Watts, R. L. dan J. L. Zimmerman. 1986.
Positive Accounting Theory. Prentice- Hall. USA.
Yahya, A. dan B. Butar-Butar. 2019. Penga- ruh Arus Kas Operasi, Arus Kas Inves- tasi dan Arus Kas Pendanaan terhadap Return Saham. Jurnal Akuntansi Bisnis Pelita Bangsa 4(01): 12-31. https://
www.journal.lppmpelitabangsa.id/in dex.php/akubis/article/view/98.
Zhuang, J., D. Edwards, D. C. Webb, and M.
V. Capulong. 2000. Corporate Gover- nance and Finance in East Asia: a Study of Indonesia, Republic of Korea, Malaysia, Philippines, and Thailand (Vol. 1). Asian Development Bank. Manila.