Taylor has published more than 80 articles in journals such as Operations Research, Management Science, Decision Sciences, IIE Transactions, Journal of the Operational Research Society, Computers and Operations Research, Omega and International Journal of Production Research, among others. He is a past president, vice president, and program manager of the Southeast Decision Sciences Institute and a recipient of their Distinguished Service Award.
Processes and Technology 226
Capacity and Facilities Design 257
Human Resources 315
SUPPLEMENT 7
SUPPLY CHAIN MANAGEMENT 420 10. Supply Chain Management Strategy
- SUPPLEMENT 8
- SUPPLEMENT 11
- SUPPLEMENT 13
- Sales and Operations Planning 607
- Inventory Management 553
- SUPPLEMENT 14
The Role of Inventory in Supply Chain Management 555 The Effects of Information Technology on Inventory. Order quantity for a periodic inventory system 577 Order quantity with variable demand 578 Determination of the order quantity for the fixed period.
CHANGES IN THE SEVENTH EDITION
MAJOR TEXT THEMES
OPERATIONS STRATEGY: CREATING VALUE ALONG THE SUPPLY CHAIN
Preface
One way companies can gain a competitive advantage is by deploying core operations management functions more effectively than their rivals, eg, building a better supply chain. Throughout the supply chain” boxes describe how successful companies have gained a competitive advantage through operations.
GLOBAL OPERATIONS
That's why we provide literally dozens of examples that explain how companies deploy specific operations along their supply chain to provide value and make them successful.
SUSTAINABILITY
SERVICES AND MANUFACTURING
QUALITATIVE AND QUANTITATIVE PROCESSES
TEACHING AND LEARNING SUPPORT FEATURES
PEDAGOGY IN THE TEXTBOOK
No other innovation has impacted business operations as strongly in recent years as computer technology and the Internet, and this is no less true in education. Selected tours are accompanied by a series of questions directly related to the concepts discussed in the chapter.
EXCEL FILES OF EXHIBITS
Therefore, we make full use of this technology as a learning and teaching tool in the courses we teach and in our text. These various resources and learning tools are organized by chapter and marked in the textbook with an online icon.
ONLINE RESOURCES FOR INSTRUCTORS
PowerPoint slides can be accessed on the instructor's section of the 7thedition website, and lecture notes accompany each slide. Answers to questions about Virtual Tours are available to professors on the instructor website.
Acknowledgments
We will look at large and small businesses, specialty products, mass-produced products and services. We cover design and quality, processes and technology, planning and control, supply chains and much more.
Introduction to Operations and
THROUGHOUT THIS TEXT we will use chocolate to introduce the topics to be covered in each chapter. At each stage we will illustrate how the principles of operations and supply chain management can be applied.
Management
The cocoa bean, from which chocolate is made, is the third most traded commodity in the world. We will trace the path of cocoa beans through the supply chain from South America and Ivory Coast in Africa through roasters, brokers and importers, to global factories and regional distribution centers, to local shops and other outlets that sell the myriad types of chocolate products.
Operations and Supply Chain Management FOR CHOCOLATE
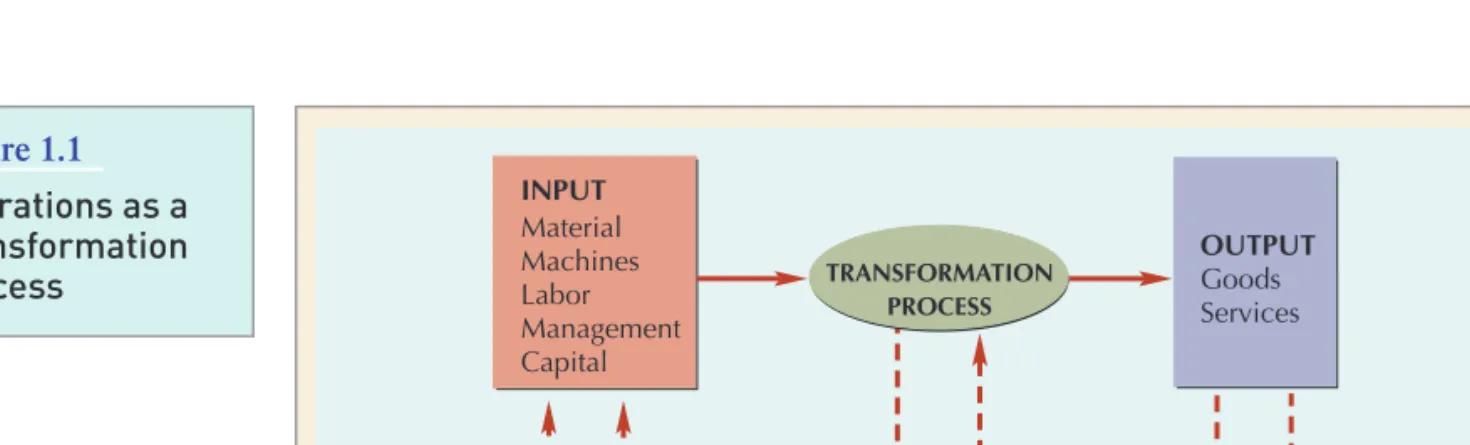
Whether it's superior quality, rapid time to market, customization or low cost, excellence in business operations is critical to a company's success. In operations management, we try to ensure that the transformation process is efficient and that the outputs are more valuable than the sum of the inputs.
THE OPERATIONS FUNCTION
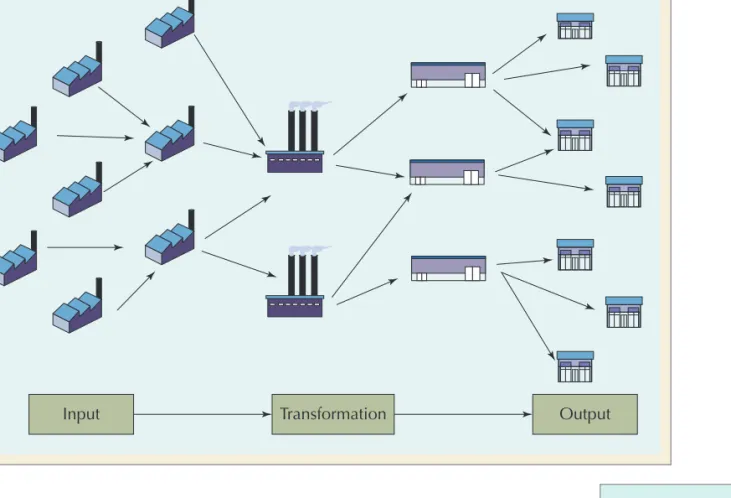
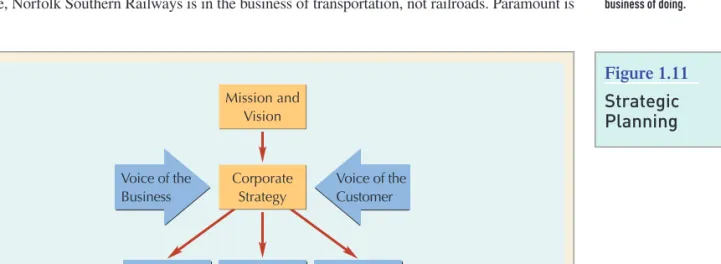
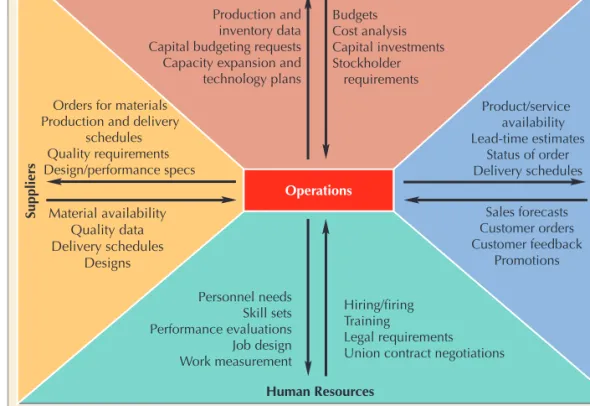
As Figure 1.1 shows, inputs (such as materials, machines, labour, management and capital) are converted into outputs (goods and services). Chief Operating Officers (COOs) run large companies as shown in Figure 1-3, Vice Presidents of Operations and Supply Chain Management oversee numerous departments, facilities, and employees.
THE EVOLUTION OF OPERATIONS AND SUPPLY CHAIN MANAGEMENT
The human relations movement of the 1930s, led by Elton Mayo and the Hawthorne studies, introduced the idea that worker motivation, as well as technical aspects of work, affected productivity. Others have continued to stagnate, temporarily buoyed by the booming economies of the Internet age and globalization.
GLOBALIZATION
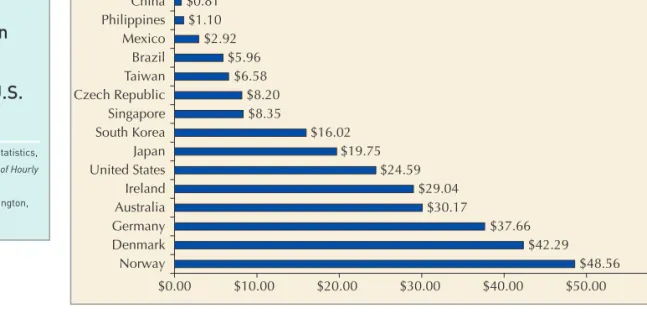
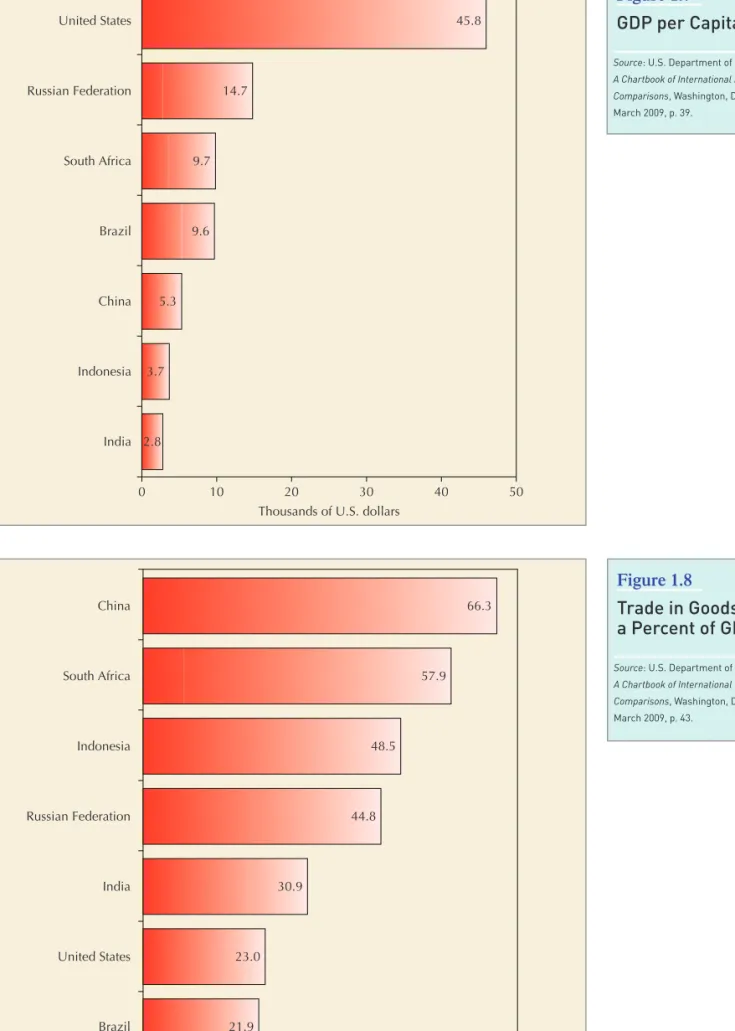
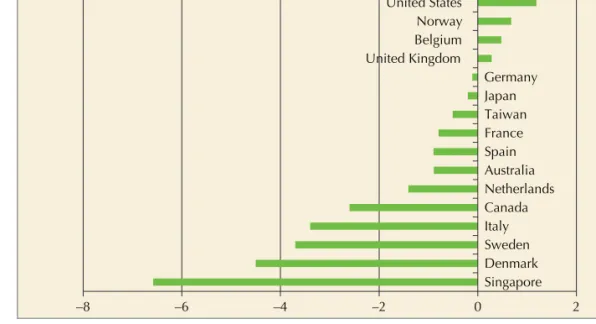
The next era in OM's evolution is likely to be the Green Revolution, which some companies and industries are warmly embracing, while others are hesitant to accept. Pay rates in Norway are the highest at $48.56 per hour, with similar rates in Denmark.
THE CHINA FACTOR
New Balance's “Along the Supply Chain” framework shows how one company tackled this challenge. New Balance currently has five factories in the United States, the last manufacturers of sneakers of this type.
INDIA, THE WORLD’S SERVICE PROVIDER
In addition, many companies are bringing their supply chain closer to home, a concept known as proximate sourcing. Operations and supply chain managers are an important part of this fight, whether it's maintaining overseas operations, coordinating supply chains, negotiating contracts or monitoring quality.
PRODUCTIVITY AND COMPETITIVENESS
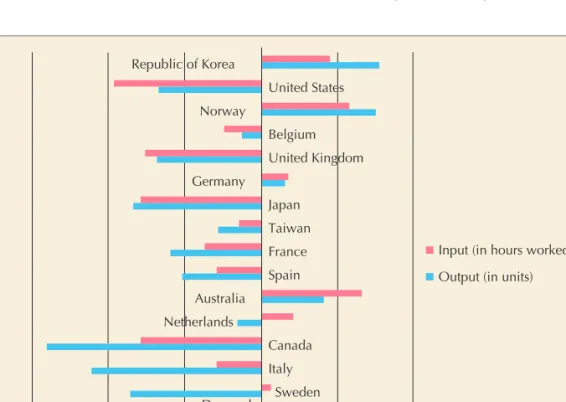
Only five countries showed positive growth rates, led by Korea and the United States with increases of 1.2%. Examining the outputs and inputs more closely in Figure 1.10, we find that Korea and the United States achieved those increases in very different ways.
STRATEGY AND OPERATIONS
The recession in the United States caused a decline in both output and input; however, the cut in inputs (ie, labor hours) was more severe, resulting in a small increase in productivity. How a company chooses to compete in the market is the subject of the next section: Strategy and operations.
PRIMARY TASK
As business becomes more competitive, companies must find their own path to sustainable competitive advantage. Mission statements spell out what business a company is in - for Levi Strauss it's "branded casual apparel"; for Intel, it provides the "building blocks for the Internet economy"; for Binney.
CORE COMPETENCIES
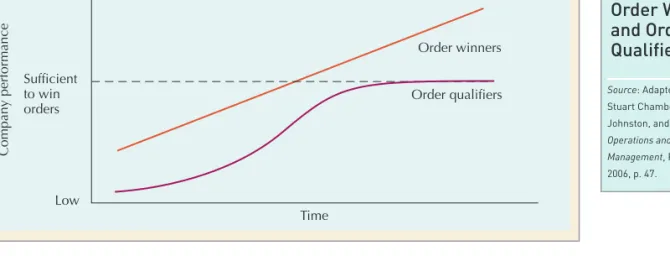
ORDER WINNERS AND ORDER QUALIFIERS
Often, these characteristics are in the area of operations and supply chain management, such as cost, speed to market, speed of delivery, or customization. Other features such as product or service design are supported by operations and supply chain management, but are not fully under their control.
POSITIONING THE FIRM
Behind this strategy is a network of operations and supply chain that is cost conscious and efficient. The entire service system is designed to understand the individual expectations of more than 500,000 customers and "move heaven and earth" to satisfy them.
STRATEGY DEPLOYMENT
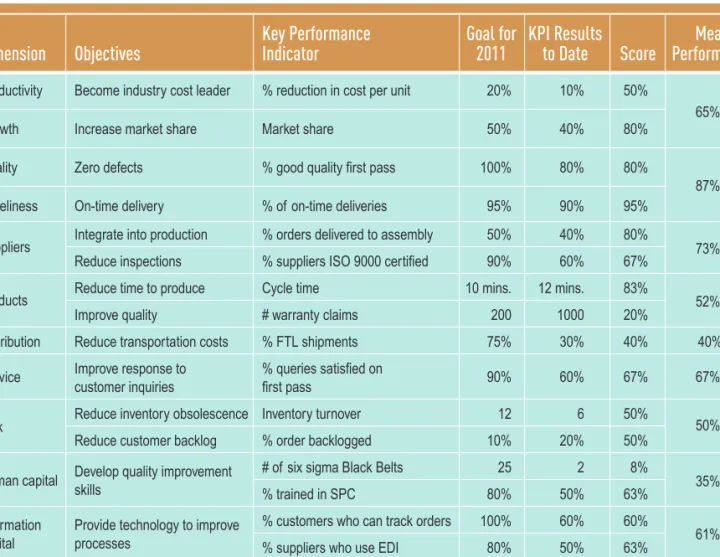
How effectively a company's assets are managed, products produced and services provided affect the financial health of the company. The worksheet selects areas of the strategy map to be incorporated into the annual goals for the company.

OPERATIONS STRATEGY
ORGANIZATION OF THIS TEXT
This text teaches students how to analyze processes, ensure quality, create value and manage the flow of information, products and services across a network of customers, enterprises and supply chain partners. The balanced scorecard reinforces a company's strategy by providing customer-oriented and process-oriented measures of performance, in addition to traditional financial measures.
LEARNING OBJECTIVES OF THIS COURSE
To gain an appreciation of the strategic importance of operations and supply chain manage- ment in a global business environment and to understand how operations relates to other
Operations can be viewed as a transformation process that converts inputs into outputs of greater value. While today's managers need to understand how to effectively manage operations within their own company, they also need to develop skills in coordinating operations across a global supply chain.
To develop a working knowledge of the concepts and methods related to designing and managing operations and to create value along the supply chain. In this course, you will
Find an interesting website related to the operations function in a firm you are familiar with. List the core skills you will need to compete successfully in the job market.
PROBLEMS
Given the cost and capacity data below, calculate the "productivity" (i.e., the cubic feet of freezer space per dollar) for each freezer alternative. 3. How can Trice reconcile his goals for the organization with the needs of the market.
Operational
How these tools are used in the decision-making process is an important and necessary part of the study of operations management. In this appendix and others in this book, we examine several different aspects of operational decision-making using these tools.
Decision-Making Tools: Decision
Decision-making is analogous to a grand play or opera, in which all the actors, the costumes, the props, the music, the orchestra and the script must be choreographed and performed by the director, stage managers, author and conductor so that everything comes together for the performance. Some techniques are specific to a particular aspect of operations management; others are more general and can be applied to a variety of decision-making categories.
Supplement to
Some techniques simply provide information that the operations manager could use to help make a decision; other techniques recommend a decision to the manager. Just having these tools doesn't make someone an effective operations manager any more than owning a saw and hammer doesn't make someone a carpenter.
DECISION ANALYSIS WITH AND WITHOUT PROBABILITIES
Decision analysis is a set of quantitative decision-making techniques to assist the decision maker in dealing with a decision situation in which there is uncertainty. Decision analysis represents not only a collection of decision-making techniques, but also an analysis of decision-making logic.
DECISION MAKING WITHOUT PROBABILITIES
With the maximin criterion, the decision maker selects the decision that reflects the maximum of the minimum payouts. The decision maker is neither totally optimistic (as the maximax criterion presupposes) nor totally pessimistic (as the maximin criterion presupposes).
DECISION ANALYSIS WITH EXCEL
With the Hurwicz criterion, the decision yield is weighted by an optimism coefficient, a measure of the decision maker's optimism. The decision to expand the facility was most frequently identified by four of the five decision criteria.
DECISION ANALYSIS WITH OM TOOLS
MAX(C6:D6), is embedded in cell E6 and also appears in the toolbar at the top of the worksheet. Note that the difference between this spreadsheet and the one in Appendix S1.1 is that the spreadsheet is already set up with all the Excel formulas for the various decision criteria in the cells.
DECISION MAKING WITH PROBABILITIES
Thus, all you have to do to solve the problem is to type the problem data.
EXPECTED VALUE OF PERFECT INFORMATION
To calculate the expected value of complete information, first look at the decisions for each natural state. Quantity is the expected value of a decision given perfect information, not the expected value of perfect information.
SEQUENTIAL DECISION TREES
S1-17. The manager of the greeting card section of Harvey's store is reviewing her order for a special line of holiday cards. S1-20. Extron Oil Company is considering making a bid for an oil shale development contract to be awarded by the federal government.
Quality
Quality Management AT MARS
Mars QMP continues to lead the way in quality management practices by benchmarking against the highest quality and food safety standards and best practices across the food industry. In this chapter, we discuss how other quality-conscious companies like Mars are developing effective quality management (QM) programs.
WHAT IS QUALITY?
Asked "What is quality?" one of our students replied "getting what you pay for". Another student added that for her, quality was "getting more than you paid for!" The Oxford American Dictionary defines quality as "a degree or level of perfection." The Mars Quality Management Process (QMP) is applied to all aspects of its supply chain, from the procurement of high-quality ingredients, to their manufacturing processes, to the distribution of products and to the measurement of customer satisfaction.
QUALITY FROM THE CUSTOMER’S PERSPECTIVE
DIMENSIONS OF QUALITY FOR MANUFACTURED PRODUCTS
DIMENSIONS OF QUALITY FOR SERVICES
Responsiveness: How well does the company respond to unusual situations, which can often occur in a service company.
QUALITY FROM THE PRODUCER’S PERSPECTIVE
A FINAL PERSPECTIVE ON QUALITY
THE EVOLUTION OF QUALITY MANAGEMENT
QUALITY MANAGEMENT SYSTEM
E. Deming’s 14 Points
All staff members participate in the goal-setting process in the district and incorporate the PDCA cycle into their plans to achieve these goals. When student performance falls short of targets in a school, the gap is addressed using the PDCA cycle to develop and implement improvements, which are then shared with other schools in the district.
QUALITY TOOLS
BHI), which includes hospitals in Pensacola and Gulf Breeze, Florida with 2,270 employees, received the 2003 Malcolm Baldrige Award. The quick fix was to get urgent care out of the emergency room, which required a capital outlay.
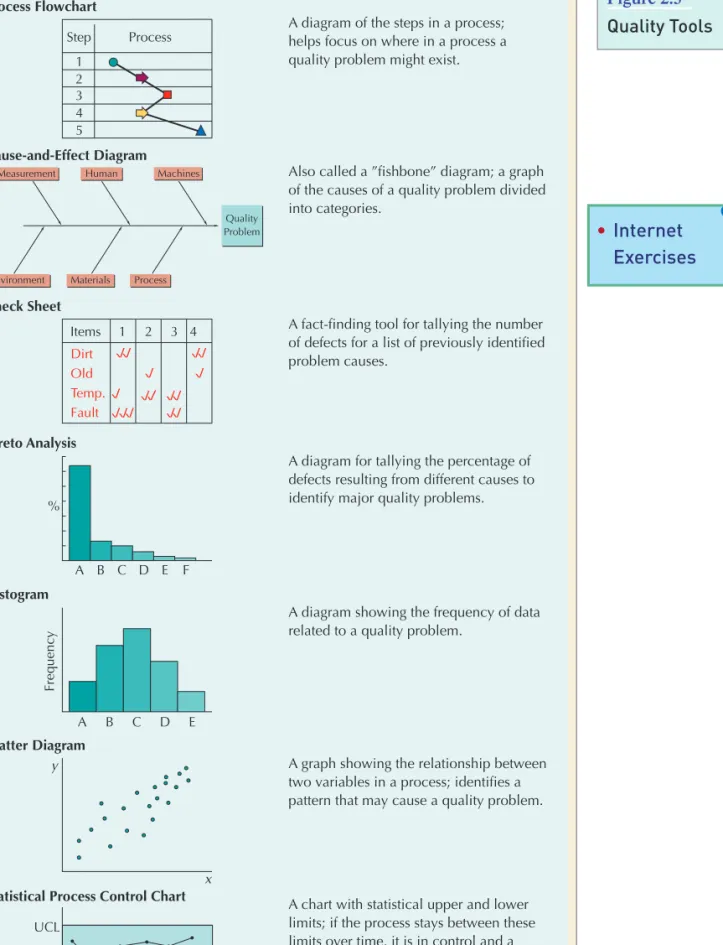
PROCESS FLOWCHARTS
CAUSE-AND-EFFECT DIAGRAMS
CTQCs are what customers expect from a product, so they have a significant impact on their satisfaction. The input (or X ) variables that could affect the outcome of the process (ie, the possible causes of the outcome) are listed on the left side of the matrix (or grid).
CHECKSHEETS AND HISTOGRAMS
A complementary tool to the fishbone diagram is the cause-and-effect matrix, which is used to prioritize the potential causes of quality problems in a process that can be initially identified using a cause-and-effect diagram. The highest-scoring causes should be addressed first in improvement efforts because they will have the greatest impact on customer satisfaction.
PARETO ANALYSIS
Note that staff communication has the highest score, and thus, the greatest impact on how satisfied customers are with the overall process. The Pareto chart simply identifies the quality problems that will result in the greatest immediate impact on quality improvement.
SCATTER DIAGRAMS
The quality problem for the hospital bed preparation time described in the previous section on cause and effect diagrams (Figure 2.4) in this case is an error whenever the preparation time exceeds 150 minutes for a patient in the sample of 195 patients. This Pareto chart finds that the main cause of poor quality is poor staff communication.
PROCESS CONTROL CHARTS AND STATISTICAL QUALITY CONTROL
TQM AND QMS
Research conducted by companies has shown that there is a direct correlation between customer satisfaction and attrition, indicating that happy customers are less likely to defect than unhappy customers. Only about five percent of customers who are unable to purchase a product because it is out of stock return to make the originally planned purchase.
THE FOCUS OF QUALITY MANAGEMENT—CUSTOMERS
Regardless of the term a company uses to identify its approach to achieving quality improvement, and the possible differences between TQM and a QMS or other approaches, there are certain common characteristics of company-wide approaches to quality improvement, such as customer satisfaction and employee involvement, topics we will discuss next time. The main focus of Deming's 14 points, TQM and all QMSs is to achieve customer satisfaction.
QUALITY MANAGEMENT IN THE SUPPLY CHAIN
An important component of any QMS is the company's ability to measure customer satisfaction; "hear" what the customer wants. A QMS requires that there be some form of measurement system that answers these questions and provides data on the level of customer satisfaction.
MEASURING CUSTOMER SATISFACTION
ARDEC's VoC program includes a 400-person conference with soldiers recently returned from the war zone who talk about what worked (and didn't work) for them in the field. Other web-based survey tools generate over 60 pages of comments each quarter that are immediately available to everyone in the organization.
THE ROLE OF EMPLOYEES IN QUALITY IMPROVEMENT
In one case, customer input was incorporated into the planning and construction of the newest hospital, the Medical Center of the Rockies, including emergency room layout, views from patient rooms (most of which face the mountains), medicinal gardens, and family facilities such as showers and kitchens. When employees are directly involved in the quality management process, it is called participatory problem solving.
KAIZEN AND CONTINUOUS IMPROVEMENT
We will look at some of these programs to involve employees in quality management, including kaizen, quality circles and process improvement teams. On average, each employee submits three suggestions for improvement per month, and nearly 80 percent of these ideas are implemented.
QUALITY CIRCLES
Employees at Dana Corporation's Spicer Driveshaft Division, North America's largest independent driveshaft manufacturer and a 2000 Malcolm Baldrige National Quality Award winner, participate in a kaizen-type program.
PROCESS IMPROVEMENT TEAMS
A key ingredient to Coral Springs' success has been an empowered, motivated and high-performing workforce. Compare quality programs in the city you're from (or where your university is) with a quality program in Coral Springs.
QUALITY IN SERVICES
A manufacturer's customer tends to communicate only at the end of the manufacturing process. Human contact and its consequences are thus an important part of the process of producing services.
QUALITY ATTRIBUTES IN SERVICES
The Ritz-Carlton hotel company is the only two-time recipient of the Malcolm Baldrige National Quality Award in the service category, namely in 1992 and 1999. As a result, Six Sigma is currently one of the most popular quality management systems in the world.
THE SIX SIGMA GOAL—3.4 DPMO
SIX SIGMA
Motorola's Six Sigma has since become a benchmark that many other companies have adopted. What do you think might be some of the obstacles for a smaller company to implement a Six Sigma program?

THE SIX SIGMA PROCESS
IMPROVEMENT PROJECTS
THE BREAKTHROUGH STRATEGY: DMAIC
BLACK BELTS AND GREEN BELTS
DESIGN FOR SIX SIGMA
LEAN SIX SIGMA
By focusing on reducing and controlling variation in targeted processes in an organization (through projects), Six Sigma improves organizational performance. Six Sigma identifies the key factors in the performance of a process and puts them at the best level.
THE BOTTOM LINE—PROFITABILITY
Now let's assume the company implements a successful Six Sigma improvement project and achieves a defect level of 3.4 DPMO, or virtually zero defects. Interest rates aside, this represents a return of approximately 33% on the company's investment in the Six Sigma project:.
THE COST OF QUALITY
A reduction in variable costs of approximately 10% through Six Sigma has resulted in a profit increase of 120%. And the company has actually increased its capacity to 1,111 units without spending more on plant and equipment.
THE COST OF ACHIEVING GOOD QUALITY
THE COST OF POOR QUALITY
Product Return Cost: The cost of processing and replacing poor quality products returned by the customer. Lost Cost of Sales: The cost incurred due to customers being dissatisfied with poor quality products and not making additional purchases.
MEASURING AND REPORTING QUALITY COSTS
Internal failure costs are usually low for a service, while external failure costs can be quite high. A typical response to high cost of defects is to increase monitoring and product inspections to eliminate poor quality products, resulting in high evaluation costs.
THE QUALITY–COST RELATIONSHIP
THE EFFECT OF QUALITY MANAGEMENT ON PRODUCTIVITY
PRODUCTIVITY
MEASURING PRODUCT YIELD AND PRODUCTIVITY
Importing items into the production process that will result in finished products of good quality, work-in-process products at stage i. To achieve output of 100 cars of good quality, the production process must start with about 127 cars.
THE QUALITY–PRODUCTIVITY RATIO
In addition, he wants to know how many input units he should start with each day in order to achieve a final daily yield of 100 units of good quality. The largest increase in QPR is due to cost reduction and an increase in initial good product quality with improved quality.
QUALITY AWARDS
An increase in production capacity alone has no effect on QPR; it remains the same as the base case.
THE MALCOLM BALDRIGE AWARD
Canada Awards for Excellence National Quality Institute Quality Award and Healthy Workplace Award European Quality Awards European Foundation for Quality European organizations that demonstrate excellence. Companies that have won the Baldrige Quality Award and become known as leaders in quality include Motorola, Xerox, Cadillac, Milliken, Federal Express, Ritz Carlton, and IBM.
OTHER AWARDS FOR QUALITY
STANDARDS
ISO 9000
CERTIFICATION
IMPLICATIONS OF ISO 9000 FOR U.S. COMPANIES
Companies within the United States are also being pressured to comply with ISO 9000 by more and more customers. The CE mark must be on any product exported from the United States that is ISO 9000 regulated.
ISO REGISTRARS
PRODUCT YIELD
Determine the weekly product yield and the product yield if the good product quality is increased to 92%.
QUALITY—PRODUCTIVITY RATIO
QUESTIONS
Give examples of poor quality costs (internal and external failure costs) and quality assurance costs (prevention and assessment). Is it possible to judge the effectiveness of the company's quality management program based on these index values?
Statistical
Hershey Company produces more than 80 million kisses every day, and each must meet strict standards for taste, appearance, weight, and packaging (with its signature foil wrap and paper plume), within very tight product design tolerances. Samples are taken on an ongoing basis to measure these various product features and characteristics to ensure they do not deviate from what they should be; that is, each kiss tastes exactly the way it was originally designed to taste in 1907, weighs what it's supposed to taste like, and is the exact shape to fit into its signature foil wrapper so it looks like it's supposed to.
Process Control
Statistical Process Control AT MARS AND HERSHEY’S
Quality management processes (QMP) are both based on Total Quality Management (TQM) principles and thus use different statistical process control (SPC) techniques. In this way, statistical process control is used to prevent poor quality before it occurs.
THE BASICS OF STATISTICAL PROCESS CONTROL
Statistical Process Control (SPC) is a statistical procedure that uses control charts to see if any part of a manufacturing process is not working properly and may be causing poor quality. In this chapter, we will learn about the basic principles of statistical process control (SPC), which companies such as Mars and Hershey's that are committed to quality use as an important part of their quality management programs.
SPC IN QUALITY MANAGEMENT
QUALITY MEASURES: ATTRIBUTES AND VARIABLES
Or the time it takes to serve a customer at McDonald's can be measured to see if it is fast enough. Since a variable evaluation is the result of some form of measurement, it is sometimes referred to as a quantitative classification method.
SPC APPLIED TO SERVICES
An attribute evaluation is sometimes referred to as a qualitative classification since the response is not measured. Because it is a measurement, a variable rating typically provides more information about the product - the weight of a product is more informative than simply saying that the product is good or bad.
WHERE TO USE CONTROL CHARTS
CONTROL CHARTS
However, it is not known whether the process is in control or not until the control chart is first constructed. A sample point can be within the control limits and the process is still out of control.
CONTROL CHARTS FOR ATTRIBUTES
Most points are close to the process mean (i.e., the center line), without being too close to the control limits. Samples are taken periodically, and the observations are checked on the control chart to see if the process is in control.
CONTROL CHARTS FOR VARIABLES
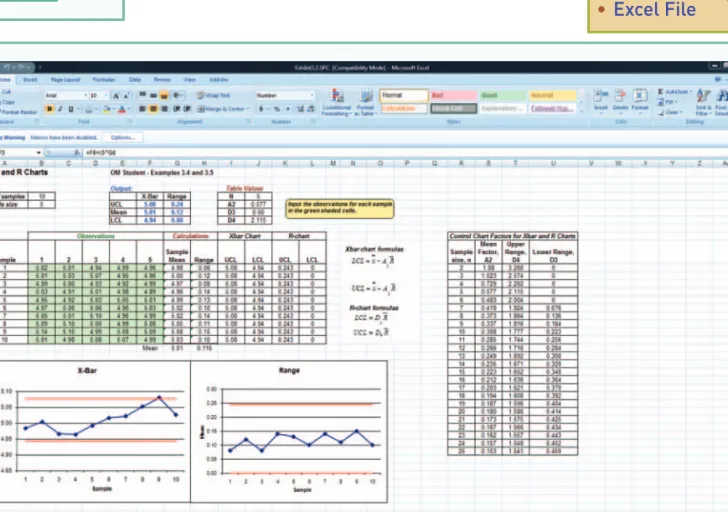
At an early stage in the manufacturing process for a particular plain bearing, the outside diameter of the bearing is measured. Employees took 10 samples (over a 10-day period) of 5 plain bearings and measured the diameter of the bearings.
MEAN ( -) CHART
The company wants to develop a control chart with 3-sigma limits to monitor this process in the future. None of the sample means ( ) fall outside these control limits, indicating that the process is in control and this is an accurate control chart.
RANGE (R-) CHART
D3 and D4 are tabulated values, like A2, for determining control limits that have been developed based on range values rather than standard deviations.
USING - AND R-CHARTS TOGETHER
This indicates that the process appears to be in control; any variability observed is the result of natural random events. Although this event does not indicate that the process is out of control, it does indicate that some non-random cause is reducing process variation.
CONTROL CHART PATTERNS
One type of pattern is a sequence of observations above or below the center line. Four out of five consecutive points in the A or B zone on one side of the center line.
SAMPLE SIZE DETERMINATION
Another type of pattern is a sequence of sample values that continuously increase or decrease within control limits. Two of three consecutive points in area A (on one side of the center line) 5.
SPC WITH EXCEL AND OM TOOLS
We will demonstrate how to develop a statistical process control chart on the computer using Excel and OM Tools. This will provide the data points to construct UCL and LCL lines on the control chart.
PROCESS CAPABILITY
If the natural variability in the process exceeds the tolerances, the process cannot meet design specifications. exceeds design specifications; the process cannot meet specifications all the time. The process is capable of meeting specifications but not because the process is not in control.
PROCESS CAPABILITY MEASURES
If the Cpkindex is greater than 1.00, the process is capable of meeting design specifications. When Cpkeenako is Cp, it means that the process average is centered on the design (nominal) target.
PROCESS CAPABILITY WITH EXCEL AND OM TOOLS
PATTERN TESTS
Construct a p-chart for this process using 3 limits and indicate whether the process was out of control. This makes it possible to make statistical inferences about the population—the lot—as a whole.
Decision-Making Tools: Acceptance
If a sample contains an acceptable number or percentage of defective items, the lot will be accepted, but if it has an unacceptable number of defects, it will be rejected. Acceptance sampling is a historical approach to quality control based on the assumption that an acceptable number of defective items will result from the manufacturing process.
SINGLE-SAMPLE ATTRIBUTE PLAN
When a sample is taken and inspected for quality, the items in the sample are checked to see if they meet a predetermined specification. A sampling plan establishes the guidelines for taking a sample and the criteria for making a decision about the quality of the batch from which the sample was taken.
PRODUCER’S AND CONSUMER’S RISKS
The OC curve measures the probability of accepting a lot for different quality levels (proportion defective) given a specific sample size (n) and acceptance level (c). In Figure S3.1, the percentage of defects in a lot is shown along the horizontal axis, whereas the probability of accepting a lot is measured along the vertical axis.
THE OPERATING CHARACTERISTIC CURVE
If management is willing to accept lots with a defective percentage of up to 15% (ie LTPD), this corresponds to a probability that the lot will be accepted () of 0.10. This results in the calculation of the producer's actual risk and the consumer's risk shown in cells B23 and B24, and the OC curve for this sampling plan is shown.
DEVELOPING A SAMPLING PLAN WITH OM TOOLS
For example, notice in the table that the actual consumer risk () is 0.0844 instead of 0.10 as stated. The probability that a lot will be accepted given that it has more than 5% defects (LTPD) is 0.085, which is the consumer's actual risk.
AVERAGE OUTGOING QUALITY
DOUBLE- AND MULTIPLE-SAMPLING PLANS
Determine a sampling plan that will approximately achieve these quality performance criteria and the operating characteristic. Hackettstown, New Jersey, is the company's headquarters, home of M&Ms and the place where flavanols were discovered.
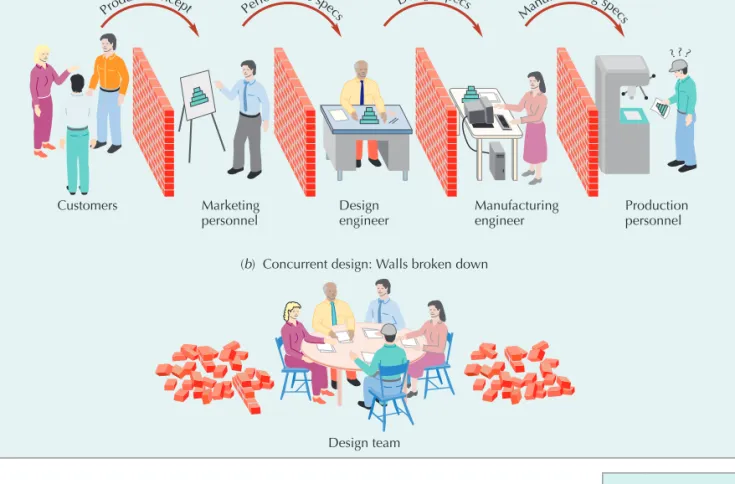
THE DESIGN PROCESS
If the process continues successfully, prototypes are produced in the pilot laboratory and, if approved, the product is launched to a test market. In this chapter, we learn about the product development process and talk about techniques to improve both the quality and speed of design.
IDEA GENERATION
Rice Krispies, on the other hand, tried to challenge Cocoa Puffs in the "more savory" market quadrant with marshmallow and fruit-flavored versions. Read more about Pixar's creative design process in the "Along the Supply Chain" box on the next page.
FEASIBILITY STUDY
They describe the function of the product - that is, what the product must do to satisfy the needs of the customer. Even when a director gets into trouble, management will add additional members with the skills to help the team, but they will not take control of the process.
RAPID PROTOTYPING AND CONCURRENT DESIGN
Risk assessments of new product ventures and the company's attitude to risk are also taken into account. Design decisions overlap and early design changes are less disruptive than those made late in the process.
FUNCTIONAL DESIGN
RELIABILITY
If the original component fails (a 5% chance.), the backup component will automatically step in to take its place—but only 90% of the time. Reliability can be improved by simplifying product design, improving the reliability of individual components, or adding redundant components.
MAINTAINABILITY
Reliability can also be expressed as the length of time a product or service is in operation before it fails, which is called the mean time between failures (MTBF). In this case, we are concerned with the distribution of failures over time, or the failure rate.
USABILITY
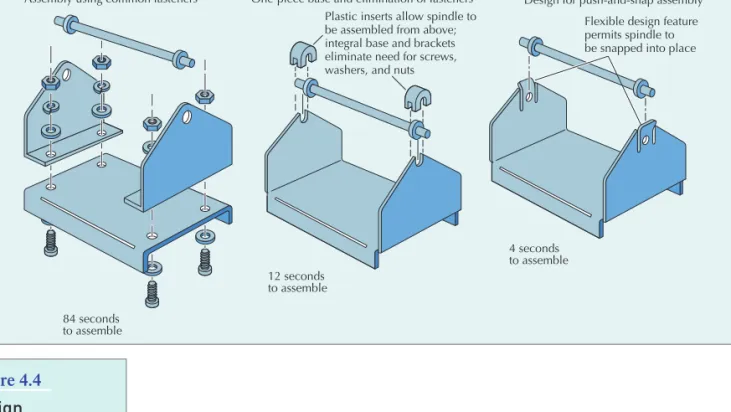
PRODUCTION DESIGN
The number of parts has been reduced to four, and the assembly time has been reduced to 12 seconds. Designed for push-and-snap assembly Flexible design feature allows spindle to click into place.
FINAL DESIGN AND PROCESS PLANS
Design for Manufacturing (DFM) is the process of designing a product so that it can be easily and economically manufactured. Specific DFM software can recommend materials and processes suitable for a design and provide manufacturing cost estimates throughout the design process.
TECHNOLOGY IN DESIGN
When successful, DFM not only improves the quality of product design, but also reduces the time and cost of product design and manufacturing. CAD improves every stage of product design and is particularly useful as a means of integrating design and manufacturing.
COLLABORATIVE PRODUCT DESIGN SYSTEMS
To facilitate discussion or design clarification, CAD data can be sent electronically between the designer and supplier, or viewed simultaneously on computer screens by different designers in physically separate locations. The problem of brittle chips can be mitigated by more moisture or less edges or by adjusting the frying process.
DESIGN QUALITY REVIEWS
Analysis of failure mode and effects for Potato Chips Failure mode Cause of failure Consequence of failure Corrective action. Three such techniques are failure mode and effect analysis, fault tree analysis, and value analysis.
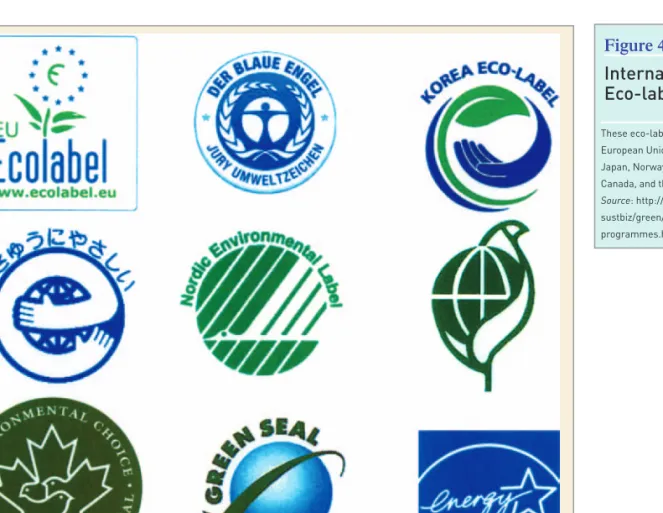
DESIGN FOR ENVIRONMENT
Norwegian legislation requires manufacturers and importers of electronic equipment to recycle or reuse 80% of the product. The European Union requires that 80% of the weight of discarded cars be reused or recycled.
GREEN SOURCING
Spurred on by these successes, Walmart began forcing its suppliers to meet certain environmental (and cost-saving) standards such as reduced packaging, condensed liquids, green product formulations and sustainable design. For companies that supply Walmart and other large corporations, it has become clear that the place to start meeting environmental requirements is green product design, or what is known around the world as design for the environment (DFE).
GREEN MANUFACTURE
Installing auxiliary power sources in the truck fleet (instead of idling the engine while the drivers sleep) saved $26 million in fuel costs. Design for the Environment (DFE) includes many aspects of design, such as designing products from recycled materials, reducing hazardous chemicals, using materials or components that can be recycled after use, designing a product to be easier to repair than throw away, and reducing unnecessary packaging.
GREEN CONSUMPTION
RECYCLING AND RE-USE
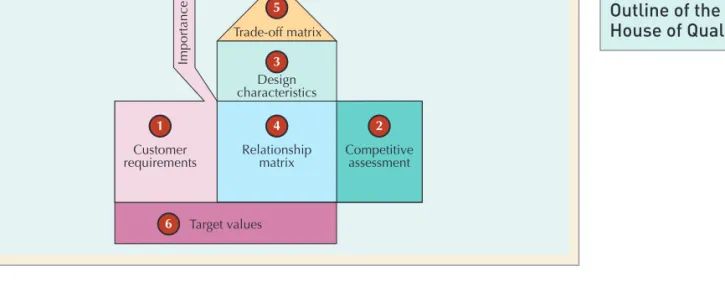
QUALITY FUNCTION DEPLOYMENT
In the center of the line was a walking boot made with brown hemp fibers, called the "Air Hobbit" by opponents. Similar communication is necessary to translate the voice of the customer into technical design requirements.