CRISIS PREVENTION STRENGTHENING EFFORTS
Arlyana Abubakar1, Rieska Indah Astuti2, Rini Oktapiani3
1. Senior Economic Researcher, Macroprudential Policy Department, Bank Indonesia;
email: [email protected]
2. Economic Researcher, Macroprudential Policy Department, Bank Indonesia; email:
3. Research Fellow, Macroprudential Policy Department, Bank Indonesia; email : rini.
Opinions in the present paper are those of the authors and do not officially represent the opinions of DKMP or Bank Indonesia.
This study aims to develop an Early Warning Indicator (EWI) that can provide early signals in the presence of pressure on the financial condition of the corporate sector. Thus, efforts to prevent deeper deterioration can be anticipated earlier in order to maintain the stability of the financial system. In the first stage, based on the company’s financial reports, the probable indicators are grouped into four categories i.e. liquidity indicator, solvency indicator, profitability indicator, and activity indicator.
The indicators, selected as EWI, are the indicators that can predict the occurrence of corporate distress events, in the Q1 of 2009, with the minimum statistical error. The results of the statistical evaluation showed that in terms of aggregate, the indicators of Debt to Equity Ratio (DER), Current Ratio (CR), Quick Ratio (QR), Debt to Asset Ratio (DAR), Solvability Ratio (SR), and Debt Service Ratio (DSR) signal within a year before a distress event occurs in the Q1 of 2009. Thus, these indicators can be considered as EWI in the presence of corporate financial distress.
Keywords: early warning indicator, financial distress JEL Classification: G01, C15
ABSTRACT
I. INTRODUCTION 1.1. Background
Several episodes of economic and financial crisis provided lessons on the importance of measuring the systemic risk of the financial system. The increased connectivity between economic agents is followed by an increase in risks of interconnection through the common exposure between agents. This is shown in the analysis of National Financial Account & Balance Sheet (FABS) until the Q2 of 2015 (Appendix), where there was a high interconnection between the Non- Financial Corporate Sector (NFC) and the financial sector, particularly banking.
On the other hand, the corporation is also highly interconnected with the external sector so as to be exposed to external risks, which, among others, is caused by high corporate foreign debt. Therefore, an early warning indicator is needed as a signal of the existence of financial pressure in the corporate sector so that efforts to prevent the occurrence of systemic risks arising from the corporate sector can be anticipated earlier.
Early Warning Indicator (EWI) is a tool that can be used in the implementation of macroprudential assessment and surveillance. The EWI is useful for early identification of potential risks so that the authorities can take preventive steps to reduce the increasing systemic risks. Therefore, the EWI must meet several requirements, such as statistical forecasting ability, providing crisis or pressure signals as early as possible, in order for the authority to have sufficient time in preparing the necessary policy (Drehmann, 2013).
Financial distress is a condition where a company has difficulty paying off, its financial obligations to its third parties (Andrade and Kaplan, 1998). Pranowo et al.
(2010) stated that the indication of the occurrence of financial distress, nationally, is a phenomenon where there are delistings of some public companies in Indonesia Stock Exchange (IDX) due to liquidity difficulties as the Asian financial crisis in 1998/1999 and the global financial crisis in 2008/2009. Another phenomenon, that indicates the financial distress, is the increasing number of companies that can not fulfill the obligation to the bank as reflected by the increase of Non-Performing Loan (NPL) in 2005 and 2009. The historical data showed, in 2006, there was an increase in NPL, which was equal to 11.5% (from 61 trillion rupiahs to 68 trillion rupiahs), compared to the previous year. In March 2009, there was an increase of 9.4% in the NPL, from 55.4 trillion rupiahs (in September 2008) to 60.6 trillion rupiahs. Based on the above phenomena and the data availability, corporate financial distress in Indonesia is assumed to occur in early 2009.
II. THEORY
Vulnerability, in the corporate sector, could be defined as a risk of the declining corporate financial condition and it will continue to deteriorate until it reaches a threshold that can trigger an increase in systemic risk (Gray, 2009). A corporation is said to be in financial distress if the corporation can not fulfill its financial obligations to a third party (Andrade and Kaplan, 1998).
Several studies have been conducted to predict corporate financial distresses.
Altman (2000) built a new model to predict corporate financial distress which was the development of previous models, namely Z-Score model (1968) and
Zeta (1977) credit risk model. The information, that was used, was in the form of corporate finance ratios that were analyzed through a linear regression model. The financial ratios used as the explanatory variables in the model were as follows:
working capital/total assets, retained earnings/total assets, earnings before interest and tax/total assets, market value equity/book value of total liabilities, and sales/
total assets.
Platt and Platt (2002) explained that the most dominant financial ratios to predict the existence of financial distress are EBITDA/sales, current assets/
current liabilities, and cash flow growth rate that have a negative relationship to the possibility of corporations will experience financial distress. The bigger the ratio, the less likely the corporation is experiencing financial distress. In addition, other financial ratios include net fixed assets/total assets, long-term debt/equity, and payable notes/total assets, which are positively related to the possibility of corporations experiencing financial distress. The greater this ratio, the more likely the corporation will experience financial distress.
Fitzpatrick (2004) used three main variables to predict financial distress: the size of the firm’s assets, the magnitude of leverage, and the standard deviation of assets. While Asquith et al. (1994) used the interest coverage ratio to define the financial distress.
The research conducted by the Bank of Japan (BoJ), in Ito et al. (2014), identified 10 leading indicators that can provide information regarding the conditions of imbalances that occur in the activities of the financial sector in Japan. Two out of the ten indicators are corporate sector indicators, namely business fixed investment to GDP ratio and corporate credit to GDP ratio.
In Indonesia, Luciana (2006) found that the financial ratios, derived from the income statement, balance sheet, and corporate cash flow statements, are significant variables in determining the corporate financial distress. The study was conducted on corporations listed in the Stock Exchange in 2000-2001, consisting of 43 corporations with net income and positive equity book value, 14 corporations with negative net income and still listed, and 24 corporations with net income and negative equity book value but still listed. The analysis used was a multinomial logit regression to test the significance of financial ratios derived from the three financial statements to the financial distress.
Pranowo et.al. (2010) conducted a study related to financial distress on 220 corporations listed in the BEI and found that there were 4 indicators that were most significant in influencing the financial distress i.e. current ratio (current assets to current liabilities), efficiency (EBITDA to total assets), leverage (due date account payable to fund availability), and equity (paid in capital). In addition, the research results showed that the mining sector was the most affected by the global financial crisis, while the agricultural sector was the most resilience and the best in overcoming the problems caused by the global crisis.
III. METHODOLOGY
This chapter discusses, in depth, the methodology used to determine the EWI of corporate financial distress in Indonesia. The methodology used, in this research, is a replication of a research methodology conducted by the Bank of Japan in Ito,
et al. (2014) to determine the leading indicators of the imbalances of the financial sector activities in Japan.
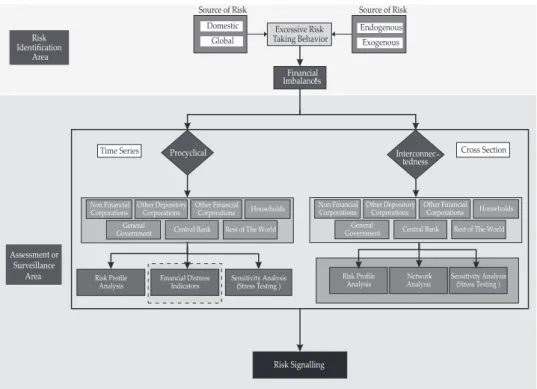
3.1. Analytical Framework of Financial Imbalances
This research is part of the framework of the preparation of financial imbalances indicator that begins with the EWI preparational study for corporate financial distress in accordance with the available data. This EWI compilation analysis is also part of the macroprudential assessment and surveillance in analyzing corporate behavior that can lead to imbalances in the financial system.
Excessive Risk Taking Behavior Financial Imbalances*
Assessment or Surveillance
Area
Procyclical
* Ketidakseimbangan dalam Sistem Keuangan (Financial Imbalances) adalah suatu kondisi denganindikasi peningkatan potensi Risiko Sistemik akibat dari perilaku yang berlebihan dari pelaku pada Sistem Keuangan (Draft PDG Kebijakan Makroprudensial, Bank Indonesia)
Endogenous Exogenous
Financial Distress
Indicators Sensitivity Analysis (Stress Testing ) Risk
Identification Area
Risk Signalling
Interconnec- tedness
Central Bank General
Government Rest of The World
Households Other Financial
Corporations Other Depository
Corporations Non Financial Corporations
Time Series Cross Section
Global Domestic
Source of Risk Source of Risk
Central Bank General
Government Rest of The World
Households Other Financial
Corporations Other Depository
Corporations Non Financial Corporations
Risk Profile
Analysis Risk Profile
Analysis Network
Analysis Sensitivity Analysis (Stress Testing )
Figure 1. Analytical framework of Financial Imbalances
3.2. Research Data and Distress Event Determination
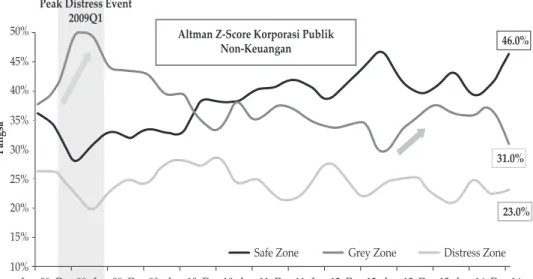
The present study uses individual data of corporations listed on the BEI from the Q4 of 2004 until the Q1 of 2015. The determination of the distress event refers to Pranowo, et.al. (2010) who stated that the period of distress is marked by an increase in the bank NPLs as well as the significant number of corporations delisting. The results of Pranowo, et.al. (2010) also showed that corporations in Indonesia experienced financial distress in the Q1 of 2009, which was also supported by the Altman Z-Score number that increased significantly and peaked in the same period.
Figure 2 shows that the Q1 of 2009 was the period with the highest share of corporate distress, which was 49.5% of the total listed corporations. The increase in the share of corporate distress is due to the depreciation of the rupiah and the economic slowdown.
The economic slowdown was influenced by the slowdown in export growth as a result of the 2008 global financial crisis, where there was a decline in demand for exported goods from importing countries. That condition affected the corporate earnings in Indonesia, especially for export-oriented corporations. In addition, the exchange rate depreciation, from the Q4 of 2008 until the Q2 of 2009 caused increments in production costs, resulting in a decrease in corporate performance.
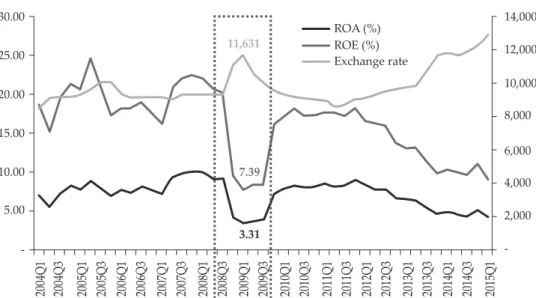
Overall, increased production costs, reduced export demand and weakening public purchasing power as a result of the economic slowdown and the depreciation of the exchange rate caused the corporation to experience a decline in performance as reflected in the decline in Return on Assets (ROA) and Return on Equity (ROE) by 0.71% and 1.86%, respectively compared to the previous period. Figure 3 shows the development of exchange rates as well as the development of corporate performance projected by Return on Assets (ROA) and Return on Equity (ROE).
Peak Distress Event 2009Q1
Altman Z-Score Korporasi Publik Non-Keuangan
Pangsa
50%
45%
40%
35%
30%
25%
20%
15%
10%
Jun-08 Dec-08 Jun-09 Dec-09 Jun-10 Dec-10 Jun-11 Dec-11 Jun-12 Dec-12 Jun-13 Dec-13 Jun-14 Dec-14 Safe Zone
31.0%
Grey Zone Distress Zone 23.0%
46.0%
Source: Bank Indonesia (2014)
Figure 2. Distress Event based on Altman Z-Score
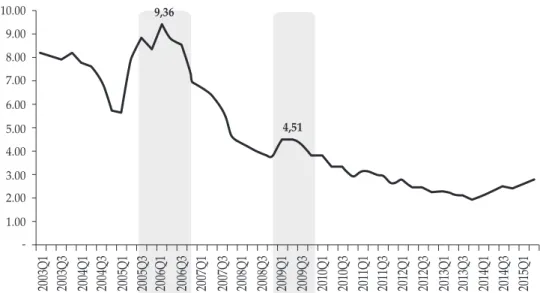
Another phenomenon, that revealed the Q1 of 2009 period was a distress period for corporates, was the increase in NPL and the number of corporation delisting as presented in Figure 4.
Figure 3. The evolution of the Rupiah Exchange Rate and Corporate Performance in Indonesia
30.00 14,000
12,000 10,000 8,000 6,000 4,000 ROA (%)
2,000
2004Q1 2004Q3 2005Q1 2005Q3 2006Q1 2006Q3 2007Q1 2007Q3 2008Q1 2008Q3 2009Q1 2009Q3 2010Q1 2010Q3 2011Q1 2011Q3 2012Q1 2012Q3 2013Q1 2013Q3 2014Q1 2015Q12014Q3
- 25.00
20.00 15.00 10.00 5.00
Source: Bloomberg
3.31 7.39 11,631
-
ROE (%) Exchange rate
NPL growth ratio (%)
Source: LBU –BI 10.00
9.00 8.00 7.00 6.00 5.00 4.00 3.00 2.00 1.00 -
9,36
4,51
2004Q1 2004Q3
2003Q1 2003Q3 2005Q1 2005Q3 2006Q1 2006Q3 2007Q1 2007Q3 2008Q1 2008Q3 2009Q1 2009Q3 2010Q1 2010Q3 2011Q1 2011Q3 2012Q1 2012Q3 2013Q1 2013Q3 2014Q1 2015Q12014Q3
Figure 4. NPL growth ratio (%) and Delisting Corporations
The decrease in corporate performance, in the Q1 of 2009, resulted in an increase in credit risk projected by the NPL of 0.76% compared to the previous period. In addition, the number of delisting corporations also experienced a relatively significant increase compared to the previous period, of which, there were 12 delisting corporations throughout 2009.
3.3. EWI determination for Financial Distress corporations
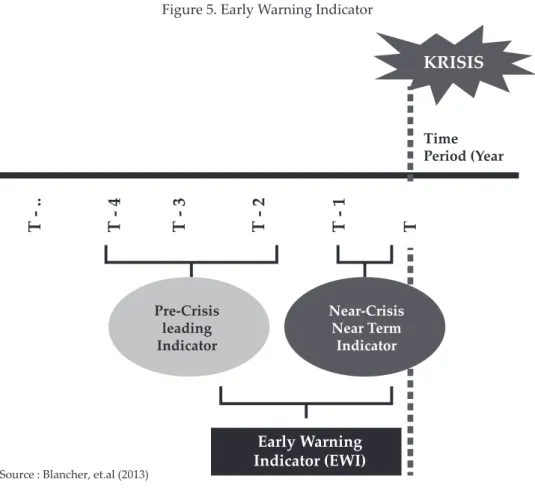
To determine whether an indicator can be used as an EWI or not, the indicator must meet certain requirements. According to Blancher, et. al (2013), an indicator can be grouped as EWI if it can provide signals before the crisis. Furthermore, EWI can be distinguished as a leading indicator or near-term indicator, based on the period in which the indicator begins to signal. An indicator is called a leading indicator if it is able to signal more than a year before a crisis. While the indicator is categorized into a near-term indicator if it is able to provide a signal within the span of one year before the crisis.
12 10 8 6 4 2 0
Triwulan Delisting
Event Analysis of Delisting Corporations
1990 - 2000 2000 - 2005 1999 2004
Asian Financial Crisis
Subprime Mortage Crisis 20 Korporasi
delisting sepanjang
tahun 1999 12 Korporasi
delisting sepanjang tahun 2009
2009 2005 - 2014
Some criteria that must be met by an indicator to be categorized as EWI for corporate financial distress are:
1. Indicators can detect the presence of imbalances in corporations less than 1 year before the peak period of distress i.e. the Q1 of 2009.
2. The used indicators can minimize various statistical errors when predicting the corporate distress event in the Q1 of 2009.
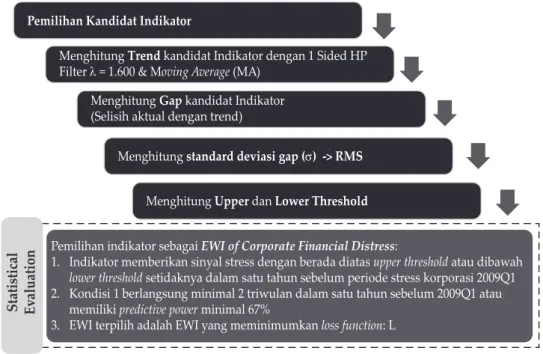
Figure 6 presents some of the steps used to determine the EWI financial distress of corporations.
Figure 5. Early Warning Indicator
T - ..
Source : Blancher, et.al (2013)
T - 4 T - 3 T - 2 T - 1 T
Pre-Crisis leading Indicator
Near-Crisis Near Term
Indicator
TimePeriod (Year
Early Warning Indicator (EWI)
KRISIS
Figure 6. EWI Financial Distress Determination Framework for Corporations
Pemilihan Kandidat Indikator
Menghitung Trend kandidat Indikator dengan 1 Sided HP Filter λ = 1.600 & Moving Average (MA)
Menghitung Gap kandidat Indikator (Selisih aktual dengan trend)
Menghitung standard deviasi gap (σ) -> RMS Menghitung Upper dan Lower Threshold Pemilihan indikator sebagai EWI of Corporate Financial Distress:
1. Indikator memberikan sinyal stress dengan berada diatas upper threshold atau dibawah lower threshold setidaknya dalam satu tahun sebelum periode stress korporasi 2009Q1 2. Kondisi 1 berlangsung minimal 2 triwulan dalam satu tahun sebelum 2009Q1 atau memiliki predictive power minimal 67%
3. EWI terpilih adalah EWI yang meminimumkan loss function: L Statistical Evaluation
3.3.1. Potential EWI determination for Corporate Financial Distress
The first step taken to determine the EWI for corporate financial distress is the determination of potential indicators that can provide an overview of the financial condition of the corporation. The potential indicator is derived from the corporate financial report, consisting of the balance sheet, income statement, and cash flow.
The category of potential indicators, used in the present study, included the liquidity indicators, solvency indicators, profitability indicators, activity indicators and cash flow indicators. The following is an explanation of the potential indicators used (Wiehle, et al. (2005) and Jakubík & Teplý (2011)):
a. Liquidity Indicator
This indicator represents the ability of a corporation to meet its short-term liabilities as well as its long-term liabilities with short-term assets. The higher the level of corporate liquidity, the lower the potential of distress occurrence. Some of the indicators included in the liquidity indicator group are:
1. Current Ratio (CR)
This ratio is a short-term liquidity measure that describes the comparison between short-term assets and short-term liabilities. In general, a well- performing corporation has a current ratio value greater than or equal to 1. A corporation with a current value ratio lower than 1 implies that the value of the networking capital held is negative so that the corporation will face financial distress. The current ratio value is determined by the following equation:
2. Quick Ratio (QR)
This ratio is a measure of the short-term liquidity that describes the liquidity status of a corporation. Mathematically, the ratio is calculated by the following equation:
The main focus of this ratio is the value of a liquid asset (cash plus a short-term receivable account) owned by a corporation. The low value of the liquid assets of a corporation indicates that the corporation will face liquidity problems in the short-term. In addition, the low value of liquid assets also represents the size of the corporation’s inventory where, in general, almost more than 50%
of the inventory is financed by liquid assets. The magnitude of the inventory value held by a corporation represents the ownership of a large liquid asset value which can be a source of vulnerability to the corporation because it is exposed to liquidity risk.
b. Solvency Indicator
This indicator explains the ability of a corporation to meet its long-term liabilities.
The high value of debt ratio and duration of debt repayment period will lead to a high potency of corporate distress. Some indicators that are parts of the solveny indicator groups are:
1. Debt to Equity Ratio (DER)
This ratio measures the proportion of corporate financing derived from debt and equity in its capital structure. In addition, this ratio is also a measure of corporate financial leverage where high leverage value not accompanied by a sustainable increase in profit will lead to the corporation facing financial distress.
2. Debt to Asset Ratio (DAR)
In addition to the Debt to Equity Ratio (DER), other ratios that can be used as corporate financial leverage indicators is Debt to Asset Ratio (DAR). This ratio measures how many assets, owned by corporations, are able to cover financing derived from both short-term and future debt obligations. The higher DAR value implies that the value of the assets held is insufficient to cover the obligation so that the company faces solvency problems.
3. Interest Coverage Ratio (ICR)
The ICR describes the long-term solvency of the corporation and measures the efficiency of a corporation in covering interest expenses derived from long- term and short-term liabilities. Mathematically, the ICR can be calculated by the following equation:
In general, the low value of the ICR implies that a corporation has solvability problems because the incomes are not sufficient to cover the lending rate burden.
4. Solvability Ratio (SR)
This ratio measures the ability of a corporation to fulfill all of its short-term and long-term liabilities. The capability is measured from asset ownership, especially liquid assets. The low value of the solvability ratio reflects the corporation facing solvability problems because of insufficient asset ownership to cover all its obligations. The SR can be calculated by the following equation:
5. Debt Service Ratio (DSR)
This ratio measures the ability of corporations to meet the obligations at risk including debt repayments and interest installments. The capability is measured based on earnings of the corporation before substracting the interest payments, taxes, depreciation, and amortization. The DSR can be calculated as follows:
A higher DSR value reflects that the corporation does not have enough gross earnings to cover the risk debt either short-term liabilities or debt installments or interest installments. This condition leads the corporations to face solvency problems.
c. Profitability Indicator
This indicator explains how corporations maximize profits by using the existing inputs. The higher the profitability of the company, the lower the potential for corporate distress. Some indicators that fall into the profitability indicator group are:1. Gross Profit Margin (GPM)
This ratio measures the amount of gross profit earned by the corporation from the sale results in the current period. The gross profit margin can be determined by the following equation:
A lower ratio implies that the cost incurred for the sale is relatively greater than the sales revenue received by the corporation. This reflects that a corporation is experiencing a decline in profit or performance.
2. Return on Asset (ROA)
A common profitability indicator used to assess a corporation’s performance is Return on Assets (ROA). This ratio measures the ratio between the net income of a corporation and its total assets. A higher ROA value reflects the high net income value obtained by maximizing the fixed asset efficiently.
3. Return on Equity (ROE)
In addition to ROA, another important indicator used to measure a corporation’s performance is Return on Equity (ROE). This indicator measures the ratio of the net income earned by a corporation to shareholder’s equity. The higher the value of ROE, the higher the return to be obtained by shareholder will be.
d. Activity Indicator
This indicator measures the efficiency of the corporation through the use of various inputs. Corporations are considered ideal if they use effective inputs to generate maximum profit. The lower the level of corporate efficiency, the higher the potential for corporate distress. Some indicators that are parts of the group of activity indicators are:
1. Inventory Turnover (I_Turn)
This ratio measures the correlation between sales and corporate inventory.
Inventory Turnover can be calculated using the following equation:
This ratio can also be used to measure the efficiency of a corporation over the sale of inventory. A higher ratio implies a more efficient corporation in managing inventory. Conversely, the low ratio signifies that the amount of the inventory was unsold, causing the cash used to purchase inventory to be eroded and the corporation will face problems with cash flow.
2. Asset Turnover (A_Turn)
This ratio explains how efficiently corporations make use of the assets to generate income. A higher ratio implies that the corporation has used the asset efficiently. The extreme value of turnover asset implies that the corporation is lacking productive assets so it can not maximize the profit to be gained.
Mathematically, the asset turnover value can be determined by the following equation:
In addition to the above indicators, other indicators that can be used as potential EWI representing the corporate cash flow is Capital Expenditure to Depreciation and Amortization Ratio. This ratio compares the investment in fixed asset or Capital Expenditure to the depreciation and amortization value in the current period. A higher ratio implies that corporations are expanding where the used cash is more for new investments than to finance depreciation and amortization.
Furthermore, EWI will be determined for both aggregate or sector. The sector determination is adjusted to the grouping of corporate business sector at the Indonesia Stock Exchange (IDX), as follows:
1. Agricultural Sector (JAKAGRI)
2. Basic Industrial & Chemical Sector (JAKBIND)
3. Manufacturing sector (JAKCONS)
4. Infrastructure, Utilities & Transportation Sector (JAKINFR) 5. Various Industries (JAKMIND)
6. Mining Sector (JAKMINE)
7. Property & Real Estate (JAKPROP) 8. Trade, Service & Investment (JAKTRAD)
3.3.2 Trend and Threshold Determination
To determine whether the potential indicator, used in this study, meets the EWI criteria or not, the first step is to analyze the trends of each indicator. This trend analysis is done to see how far an indicator deviates from its long-term trend and identifies whether the deviation exceeds the threshold. A deviation that exceeds the threshold, either lower or upper threshold, determines whether the indicator can detect potential corporate distress event in Indonesia or not. Some stages of trend analysis and threshold indicator determination are as follows:
1. Long-Term Trend Calculations
The long-term trends of the potential indicators were calculated using two methodologies: one sided HP filter with smoothing parameter (λ) of 1600 given that the data used are quarterly data (Drehman, 2011) and backward Moving Average (MA) for either 1, 2 or 3 years. The use of the MA itself is focused on the 3 years MA backward as it is more effective in describing short-term fluctuations (Ito et al., 2014 in Surjaningsih et al., 2014). The determination of trend calculation methodology is based on several factors such as the time series characteristics of each indicator and the result of statistical evaluation which minimize various statistical errors.
2. Gap Indicator Calculation
After the trend analysis is done, the next step is the gap calculation for each potential indicator. This stage is done to find out how big an indicator deviates from long-term trend. The gap value itself is the difference between the actual value of the indicator (xi) and the long-term trend value (xit).
3. Standard Deviation Determination (Root Mean Square)
In identifying whether an indicator provides a distress signal or not, what needs to be done is the analysis of the historical movement of the indicator and compare it with the particular threshold. To know which threshold value is optimal in giving information about signal given by indicator, some threshold levels should be made. The threshold level is determined by the standard mean deviation (Root Mean Square/RMS) of each indicator calculated using the following equation:
4. Threshold Determination (Upper dan Lower Threshold)
The threshold level formed either upper or lower threshold is a multiple of the standard deviation value (σ). Both upper and lower thresholds are calculated by the following equation:
Upper Threshold: xit + k σ Lower Threshold: xit - k σ
5. Where xi is both the actual value of the indicator and the indicator trend value generated from one sided HP Filter (λ = 1600) and 3 years MA backward. While k is a standard deviation multiplier factor used to perform the best threshold value determination simulation in detecting distress signals. The k values vary from 1, 1.25, 1.5, 1.75 and 2.
6. An indicator is said to give a distress signal if the actual value exceeds the upper threshold or lower threshold before the distress event.
Actual value above the upper threshold: xi > ( xit + k σ ) Actual value below the lower threshold: xi < ( xit - k σ )
3.3.3. Statistical Evaluation
Basically, the indicator selected as EWI can only give a signal before the distress event and does not give any signal outside that period. Possible conditions are that the indicator gives the signal and the distress event occurs (correct signal A) or the indicator gives no signal at all and the distress event does not occur (correct signal D).
In some studies, there is an indicator that can not signal properly i.e. the indicator gives signal but the distress event does not occur (Type II error/risk of issuing false signal [B]) or the indicator does not give signal but distress event occurs (Type I error/risk of missing crisis [C]). In brief, the conditions are described in Table 1.
Table 1.
Statistical Errors
Tabel of Statistical Errors Actual
Stress Event No Stress Event Predicted Signal Issued Correct Signal (A) Type II Errors(B)
No Signal Issued Type I Errors(C) Correct Signal (C) Source: Ito, et.al (2014)
The statistical evaluation of the selected EWIs, in this study, adopted the statistical method used by Ito et.al (2014) to evaluate the financial activity index (FAIX) in Japan. Using this method, the next level of threshold, which will minimize “loss”, will be determined, where the loss itself is the weighted average of the probability of type I error and type II error. The formula for calculating the loss function can be written as follows:
Where A, B, C, and D are related to the number of periods that occur when the indicator gives the signal and the distress occurs (A), the indicator gives the signal but the distress does not occur (B), the indicator gives no signal but the distress occurs (C) giving signal and distress does not occur (D). L(μ,τ) is the loss obtained by the regulator based on the value of the regulator preference parameter (μ) and a specific threshold (τ).
The value of the regulator preference parameter (μ) can vary from 0 to 1, if the μ=0,5 value implies that the regulator minimizes the value of type I and type II errors in a balanced manner while the μ>0,5 value indicates that the regulator prefers to minimize type I error compared to type II error. The P value is the ratio between the number of periods in which the indicator gives a signal with the total observed period. T1(τ) and T2(τ) are probabilities of type I and type II error, respectively. In addition to minimizing the loss value, the selected EWI is also an EWI that has predictive power (1 - type I Error) or the power to signal above 67%.
Thus, it can be interpreted that the indicator can signal with at least 2/3 of the period of stress that occurs.
3.3.4. Robustness test
Referring to Ishikawa et al. (2012), robustness test of an EWI can be done by looking at the historical behavior of the EWI through the analysis of the degree of real-time estimation problem up to the period of distress occurrence. Furthermore, robustness test on the EWI is performed using the standard deviation or Root Mean Square (RMS) value until the period where the distress occurs, the next best threshold is specified in the signal. An EWI is said to be robust if the result of a statistical evaluation of such historical behavior can minimize the loss as obtained from the results of the EWI selection analysis by using the entire sample.
Significantly different statistical differences between out-of-sample testing (robustness check) and EWI (all sample) selection analysis implies that the model contains real-time estimation problem and the model is not robust.
IV. RESULTS AND ANALYSIS 4.1. Statistical Evaluation Analysis
To obtain EWI by using the methodology described previously, it is necessary to formulate the indication of stress condition from each potential indicator as summarized in Table 2. the potential EWIs are financial ratios derived from corporate financial statements consisting of balance sheet, income statement and cash flow (Pranowo, et al, 2010). The indicators are then grouped into four categories (Jakubik & Teply, 2011) i.e. liquidity indicators, solvency indicators, profitability indicators, and activity indicators.
Table 2.
Summary of Potential EWI for Corporation Financial Distress
Indikator Definisi Indikator Kondisi
Liquidity Indicators
Current Ratio (CR) (Current Asset / Current Liabilities) CR < Lower Threshold Quick Ratio (QR) (Cash + Acc. Receivable) / Current Liabilities) QR < Lower Threshold Solvency Indicators
Debt to Equity Ratio (DER) (Total Debt / Total Equity) DER > Upper Threshold Debt to Asset Ratio (DAR) (Total DEbt / Total Asset) DAR > Upper Threshold Interest Coverage Ratio (ICR) (EBIT / Interest Expense) ICR < Lower Threshold Solvability Ratio (SR) (Total Asset / Total Liabilities) SR < Lower Threshold Debt Service Ratio (DSR) ((Current Liabilities + Interest Expense) / EBITDA) DSR > Upper Threshold Profitability Indicators
Gross Profit Margin (GPM) (Operating Profit / Sales) GPM < Lower Threshold
Return on Asset (ROA) (Net Income / Total Asset) ROA < Lower Threshold Return on Equity (ROE) (Net Income / Total Equity) ROE < Lower Threshold Activity Indicators
Inventory Turnover (I_Turn) (Sales / Inventory) I_Turn < Lower Threshold Asset Turnover (A_Turn) (Sales / Total Asset) A_Turn < Lower Threshold Cash Flow Indicators
CapEx to Dep_Amor Ratio (C_DA) (Capital Expenditure / Depreciation and Amortization) C_DA < Lower Threshold Source: Jakubik & Teply (2011)
The results of the selected indicator analysis are presented in statistical tabulation and graph. Based on Table 3, the Noise to Signal Ratio (NSR) analysis results showed that the long-term trend obtained through the one-sided method of the HP filter was better in giving distress signals when compared to the Moving Average. This result applies to all indicators with accuracy prediction above 67%
and a minimum statistical error among other indicators.
The statistical evaluation (Table 3) showed that some indicators, that can signal distress in the NFC sector in aggregate, are Debt to Equity Ratio (DER) as leading indicator and Current Ratio (CR), Quick Ratio (QR), Debt to Asset Ratio (DAR), Solvability Ratio (SR), and Debt Service Ratio (DSR) which is a near-term indicator.
Historically, the DER has been shown to consistently signal within a year before the 2009 distress event with accurate signals that capture distress over 67% (leading).
While the other indicators are near term as they signal in a relatively short period of time within a year before the occurrence of distress.
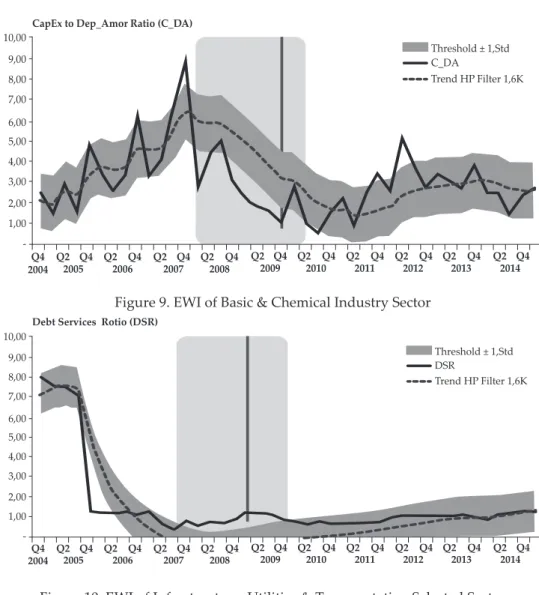
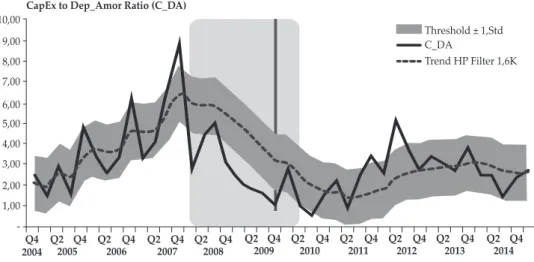
For sectoral, there are four leading indicators, namely DER (agricultural sector, various industries, and property & real estate), DSR (basic & chemical industry), DAR (various industries), and Asset Turnover (trade, services and investment).
In addition, there are several sectors that have near-term indicator, including the agricultural sector (Capital Expenditure to Depreciation & Amortization);
infrastructure, utility and transportation sectors (Interest Coverage Ratio, Inventory Turnover and Asset Turnover); various industries (SR); mining sector (ROA and ROE); trade, services and investment (QR) sectors.
Table 3.
Statistical Evaluation of Potential EWI for Corporation Financial Distress
Indicator Kategori Model Trend Threshold Predictive Power Loss First Signal (Distress : 2009Q1) λ = 1600
AGGREGATE
CR Liquidity Indicator μ = 0.5 one-side HP Filter 1σ(lower) 80% 0.131 2008Q2 QR Liquidity Indicator μ = 0.5 one-side HP Filter 1σ(lower) 80% 0.048 2008Q2 DER Solvency Indicator μ = 0.5 one-side HP Filter 1σ(lower) 80% 0.095 2007Q4 DAR Solvency Indicator μ = 0.5 one-side HP Filter 1σ(lower) 80% 0.107 2008Q2 SR Solvency Indicator μ = 0.5 one-side HP Filter 1σ(lower) 80% 0.131 2008Q2 DSR Solvency Indicator μ = 0.5 one-side HP Filter 1σ(lower) 80% 0.095 2008Q1 JAKAGRI
DER Solvency Indicator μ = 0.5 one-side HP Filter 1σ(lower) 80% 0.095 2006Q2 C_DA Cash Flow Indicator μ = 0.5 one-side HP Filter 1σ(lower) 80% 0.071 2008Q1 JAKBIND
DSR Solvency Indicator μ = 0.5 one-side HP Filter 1σ(lower) 80% 0.048 2007Q4 JAKINFR
ICR Solvency Indicator μ = 0.5 one-side HP Filter 1σ(lower) 80% 0.060 2008Q2 I_TURN Activity Indicator μ = 0.5 one-side HP Filter 1.5σ(lower) 100% 0.000 2008Q1 A_TURN Activity Indicator μ = 0.5 one-side HP Filter 1.25σ(lower) 80% 0.048 2008Q2 JAKMIND
DER Solvency Indicator μ = 0.5 one-side HP Filter 1σ(lower) 100% 0.095 2006Q2 DER Solvency Indicator μ = 0.5 one-side HP Filter 1.25σ(lower) 80% 0.060 2007Q3 SR Solvency Indicator μ = 0.5 one-side HP Filter 1.25σ(lower) 80% 0.048 2008Q2 JAKMINE
ROA Profitability Indicator μ = 0.5 one-side HP Filter 1σ(lower) 80% 0.060 2008Q2
ROE Profitability Indicator μ = 0.5 one-side HP Filter 1.25σ(lower) 80% 0.048 2008Q2
JAKPROP
DER Solvency Indicator μ = 0.5 one-side HP Filter 1σ(lower) 100% 0.107 2006Q4 JAKTRAD
QR Liquidity Indicator μ = 0.5 one-side HP Filter 1.25σ(lower) 80% 0.012 2008Q2 A_TURN Activity Indicator μ = 0.5 one-side HP Filter 1σ(lower) 100% 0.119 2006Q3
Leading Indicator Near-Term Indicator Source : Calculations of the author
4.2. Graphs of the Selected EWI
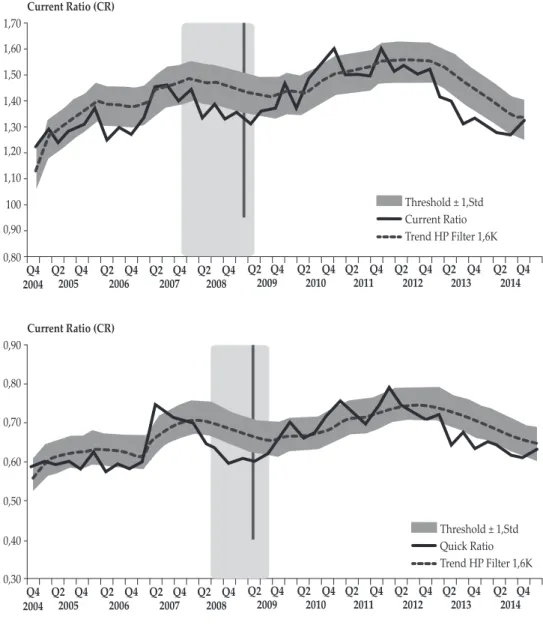
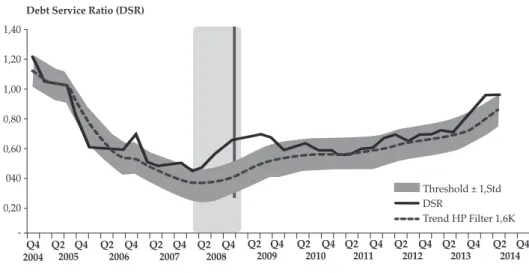
Visually, the following graphs can illustrate the ability of each indicator to signal before the occurrence of a distress event. The red vertical line indicates the beginning of the distress occurrence, while the shaded area is the period identified by each indicator as the period of distress. That was indicated by the value of the indicator passing the predefined threshold based on the statistical evaluation of the period.
Figure 7 shows that, in terms of aggregate, the CR, QR, DER, DAR, SR, and DSR are able to signal potential early distress with a prediction accuracy above 80%. Among the 6 indicators, only the DER began to signal over a year before the distress in the Q4 of 2007. The initial position data, in 2015, indicated that the corporate financial condition was at a safe level. Thus, it is expected that within
the next year, the company’s financial condition will be safe. Banks can continue to channel loans to the real sector to drive the economy which is expected to boost the economic growth.
Figure 7. EWI of the Selected Industry
2,20 2,00 1,80
1,40 1,60
1,20 1,00Q4
2004 Q2 Q4 2005 Q2 Q4
2006 Q2 Q4 2007 Q2 Q4
2008 Q2 Q4
2009 Q2 Q4 2010 Q2 Q4
2011 Q2 Q4 2012 Q2 Q4
2013 Q2 Q4 2014 Sovability Ratio (SR)
Threshold ± 1,Std Solvability Ratio Trend HP Filter 1,6K
Debt Service Ratio (DSR) 1,40
1,20 1,00
0,60 0,80
040 0,20
- Q4 2004 Q2 Q4
2005 Q2 Q4 2006 Q2 Q4
2007 Q2 Q4 2008 Q2 Q4
2009 Q2 Q4 2010 Q2 Q4
2011 Q2 Q4 2012 Q2 Q4
2013 Q2 Q4 2014 Threshold ± 1,Std DSR
Trend HP Filter 1,6K 1,70
1,60 1,50 1,40 1,30 1,20 1,10 100 0,90 0,80Q4
2004 Q2 Q4 2005 Q2 Q4
2006 Q2 Q4 2007 Q2 Q4
2008 Q2 Q4
2009 Q2 Q4 2010 Q2 Q4
2011 Q2 Q4 2012 Q2 Q4
2013 Q2 Q4 2014 Current Ratio (CR)
Threshold ± 1,Std Current Ratio Trend HP Filter 1,6K
0,90 0,80 0,70 0,60 0,50 0,40 0,30Q4
2004 Q2 Q4 2005 Q2 Q4
2006 Q2 Q4 2007 Q2 Q4
2008 Q2 Q4
2009 Q2 Q4 2010 Q2 Q4
2011 Q2 Q4 2012 Q2 Q4
2013 Q2 Q4 2014 Current Ratio (CR)
Threshold ± 1,Std Quick Ratio Trend HP Filter 1,6K
Quick Ratio (QR) 2,00
1,80 1,60 1,40 1,20 1,00 0,80 0,60 0,40 Q4
2004 Q2 Q4 2005 Q2 Q4
2006 Q2 Q4 2007 Q2 Q4
2008 Q2 Q4 2009 Q2 Q4
2010 Q2 Q4 2011 Q2 Q4
2012 Q2 Q4 2013 Q2 Q4
2014 Threshold ± 1,Std DER
Trend HP Filter 1,6K
0,70 0,65 0,60
0,50 0,55
0,45 0,40
Debt to Asset Ratio (DAR)
2004Q4 Q2 Q4 2005 Q2 Q4
2006 Q2 Q4 2007 Q2 Q4
2008 Q2 Q4
2009 Q2 Q4 2010 Q2 Q4
2011 Q2 Q4 2012 Q2 Q4
2013 Q2 Q4 2014 Threshold ± 1,Std DAR
Trend HP Filter 1,6K
Selection of Early Warning Indicator to Identify Distress in the Corporate Sector:
Crisis Prevention strengthening Efforts 361
2,20
2,00
1,80
1,40 1,60
1,20
1,00Q4 2004 Q2 Q4
2005 Q2 Q4 2006 Q2 Q4
2007 Q2 Q4 2008 Q2 Q4
2009 Q2 Q4 2010 Q2 Q4
2011 Q2 Q4 2012 Q2 Q4
2013 Q2 Q4 2014 Sovability Ratio (SR)
Threshold ± 1,Std Solvability Ratio Trend HP Filter 1,6K
Debt Service Ratio (DSR) 1,40
1,20 1,00
0,60 0,80
040 0,20
- Q4 2004 Q2 Q4
2005 Q2 Q4 2006 Q2 Q4
2007 Q2 Q4 2008 Q2 Q4
2009 Q2 Q4 2010 Q2 Q4
2011 Q2 Q4 2012 Q2 Q4
2013 Q2 Q4 2014 Threshold ± 1,Std DSR
Trend HP Filter 1,6K 1,50
1,40 1,30 1,20 1,10 100 0,90 0,80Q4
2004 Q2 Q4 2005 Q2 Q4
2006 Q2 Q4 2007 Q2 Q4
2008 Q2 Q4
2009 Q2 Q4 2010 Q2 Q4
2011 Q2 Q4 2012 Q2 Q4
2013 Q2 Q4 2014 Threshold ± 1,Std Current Ratio Trend HP Filter 1,6K
0,90
0,80
0,70
0,60
0,50
0,40
0,30Q4 2004 Q2 Q4
2005 Q2 Q4 2006 Q2 Q4
2007 Q2 Q4 2008 Q2 Q4
2009 Q2 Q4 2010 Q2 Q4
2011 Q2 Q4 2012 Q2 Q4
2013 Q2 Q4 2014 Current Ratio (CR)
Threshold ± 1,Std Quick Ratio Trend HP Filter 1,6K
Quick Ratio (QR) 2,00
1,80 1,60 1,40 1,20 1,00 0,80 0,60 0,40Q4
2004 Q2 Q4
2005 Q2 Q4 2006 Q2 Q4
2007 Q2 Q4 2008 Q2 Q4
2009 Q2 Q4 2010 Q2 Q4
2011 Q2 Q4 2012 Q2 Q4
2013 Q2 Q4 2014 Threshold ± 1,Std DER
Trend HP Filter 1,6K
0,70 0,65
0,60
0,50 0,55
0,45
0,40
Debt to Asset Ratio (DAR)
2004Q4 Q2 Q4 2005 Q2 Q4
2006 Q2 Q4 2007 Q2 Q4
2008 Q2 Q4
2009 Q2 Q4 2010 Q2 Q4
2011 Q2 Q4 2012 Q2 Q4
2013 Q2 Q4 2014 Threshold ± 1,Std DAR
Trend HP Filter 1,6K
Bulletin of Monetary Economics and Banking, Volume 20, Number 3, January 2018 362
Based on Figure 8 up to Figure 14, each sector in the corporation has a different EWI. There are indicators that can be EWI in a sector, but can not signal distress in other sectors. This is due to the characteristics of the business between different sectors. Solvency indicators, such as DER, DAR, DSR, and SR, are still the dominant EWI indicators in various sectors, namely agriculture, basic &
chemical industries, various industries, and property & real estate. Unlike the mining sector where the distress signals are given through profitability indicators, ROA and ROE, and trade, service and investment sectors dominated by activity indicators (inventory turnover and asset turnover) and liquidity indicators (quick ratio). In general, the DER can be an EWI that represents the financial condition of the company in aggregate or sectoral. However, the monitoring and assessment of other complementary indicators is needed, especially for sectors that are high connected to the financial sector.
Figure 8. EWI of the Agricultural Selected Sector
CapEx to Dep_Amor Ratio (C_DA)
Threshold ± 1,Std C_DA
Trend HP Filter 1,6K 10,00
9,00 8,00 7,00 6,00 5,00 4,00 3,00 2,00 1,00
-Q4 2004 Q2 Q4
2005 Q2 Q4 2006 Q2 Q4
2007 Q2 Q4 2008 Q2 Q4
2009 Q2 Q4 2010 Q2 Q4
2011 Q2 Q4 2012 Q2 Q4
2013 Q2 Q4 2014 3,00
2,50 2,00 1,50 1,00 0,50 - (0,50)
2004Q4 Q2 Q4 2005 Q2 Q4
2006 Q2 Q4
2007 Q2 Q4 2008 Q2 Q4
2009 Q2 Q4 2010 Q2 Q4
2011 Q2 Q4 2012 Q2 Q4
2013 Q2 Q4 2014 Debt to Equity ratio (DER)
Trend HP Filter 1,6K DER
Threshold ± 1,Std 2,20
2,00 1,80
1,40 1,60
1,20 1,00Q4
2004 Q2 Q4 2005 Q2 Q4
2006 Q2 Q4 2007 Q2 Q4
2008 Q2 Q4
2009 Q2 Q4 2010 Q2 Q4
2011 Q2 Q4 2012 Q2 Q4
2013 Q2 Q4 2014 Sovability Ratio (SR)
Threshold ± 1,Std Solvability Ratio Trend HP Filter 1,6K
Debt Service Ratio (DSR) 1,40
1,20 1,00
0,60 0,80
040 0,20
- Q4 2004 Q2 Q4
2005 Q2 Q4 2006 Q2 Q4
2007 Q2 Q4 2008 Q2 Q4
2009 Q2 Q4 2010 Q2 Q4
2011 Q2 Q4 2012 Q2 Q4
2013 Q2 Q4 2014 Threshold ± 1,Std DSR
Trend HP Filter 1,6K 1,60
1,50 1,40 1,30 1,20 1,10 100 0,90 0,80Q4
2004 Q2 Q4 2005 Q2 Q4
2006 Q2 Q4 2007 Q2 Q4
2008 Q2 Q4
2009 Q2 Q4 2010 Q2 Q4
2011 Q2 Q4 2012 Q2 Q4
2013 Q2 Q4 2014 Threshold ± 1,Std Current Ratio Trend HP Filter 1,6K
0,90 0,80 0,70
0,60 0,50 0,40 0,30Q4
2004 Q2 Q4 2005 Q2 Q4
2006 Q2 Q4 2007 Q2 Q4
2008 Q2 Q4
2009 Q2 Q4 2010 Q2 Q4
2011 Q2 Q4 2012 Q2 Q4
2013 Q2 Q4 2014 Current Ratio (CR)
Threshold ± 1,Std Quick Ratio Trend HP Filter 1,6K
Quick Ratio (QR) 2,00
1,80 1,60 1,40 1,20 1,00 0,80 0,60 0,40 Q4
2004 Q2 Q4 2005 Q2 Q4
2006 Q2 Q4 2007 Q2 Q4
2008 Q2 Q4 2009 Q2 Q4
2010 Q2 Q4 2011 Q2 Q4
2012 Q2 Q4 2013 Q2 Q4
2014 Threshold ± 1,Std DER
Trend HP Filter 1,6K
0,70 0,65
0,60
0,50 0,55
0,45 0,40
Debt to Asset Ratio (DAR)
2004Q4 Q2 Q4 2005 Q2 Q4
2006 Q2 Q4 2007 Q2 Q4
2008 Q2 Q4
2009 Q2 Q4 2010 Q2 Q4
2011 Q2 Q4 2012 Q2 Q4
2013 Q2 Q4 2014 Threshold ± 1,Std DAR
Trend HP Filter 1,6K
Selection of Early Warning Indicator to Identify Distress in the Corporate Sector:
Crisis Prevention strengthening Efforts 363
CapEx to Dep_Amor Ratio (C_DA)
Threshold ± 1,Std C_DA
Trend HP Filter 1,6K 10,00
9,00 8,00 7,00 6,00 5,00 4,00 3,00 2,00 1,00
- Q4 2004 Q2 Q4
2005 Q2 Q4 2006 Q2 Q4
2007 Q2 Q4 2008 Q2 Q4
2009 Q2 Q4 2010 Q2 Q4
2011 Q2 Q4 2012 Q2 Q4
2013 Q2 Q4 2014 2,50
2,00 1,50 1,00 0,50 - (0,50)
2004Q4 Q2 Q4 2005 Q2 Q4
2006 Q2 Q4 2007 Q2 Q4
2008 Q2 Q4 2009 Q2 Q4
2010 Q2 Q4 2011 Q2 Q4
2012 Q2 Q4 2013 Q2 Q4
2014 Trend HP Filter 1,6K DER
Figure 9. EWI of Basic & Chemical Industry Sector
Threshold ± 1,Std DSR
Trend HP Filter 1,6K
2004Q4 Q2 Q4 2005 Q2 Q4
2006 Q2 Q4 2007 Q2 Q4
2008 Q2 Q4 2009 Q2 Q4
2010 Q2 Q4 2011 Q2 Q4
2012 Q2 Q4 2013 Q2 Q4
2014 Debt Services Rotio (DSR)
10,00 9,00 8,00 7,00 6,00 5,00 4,00 3,00 2,00 1,00 -
Figure 10. EWI of Infrastructure, Utilities & Transportation Selected Sector
13,00
11,00
9,00
7,00 5,00
3,00
1,00Q4 2004 Q2 Q4
2005 Q2 Q4 2006 Q2 Q4
2007 Q2 Q4
2008 Q2 Q4 2009 Q2 Q4
2010 Q2 Q4 2011 Q2 Q4
2012 Q2 Q4 2013 Q2 Q4
2014 Interest Cov. Ratio
Threshold ± 1,5 Std ICR
Trend HP Filter 1,6K
Threshold ± 1,Std I_Turn
Trend HP Filter 1,6K
2004Q4 Q2 Q4 2005 Q2 Q4
2006 Q2 Q4 2007 Q2 Q4
2008 Q2 Q4 2009 Q2 Q4
2010 Q2 Q4 2011 Q2 Q4
2012 Q2 Q4 2013 Q2 Q4
2014 Inventory Tumeover (I_Turn)
254,00
204,00
154,00
104,00
54,00
4,00
2004Q4 Q2 Q4 2005 Q2 Q4
2006 Q2 Q4 2007 Q2 Q4
2008 Q2 Q4 2009 Q2 Q4
2010 Q2 Q4 2011 Q2 Q4
2012 Q2 Q4 2013 Q2 Q4
2014 Asset Turnover (A_Turn)
Threshold ± 1,25 Std A_Turn
Trend HP Filter 1,6K 0,70
0,65 0,60 0,55 0,50 0,45 0,40 0,35 0,30