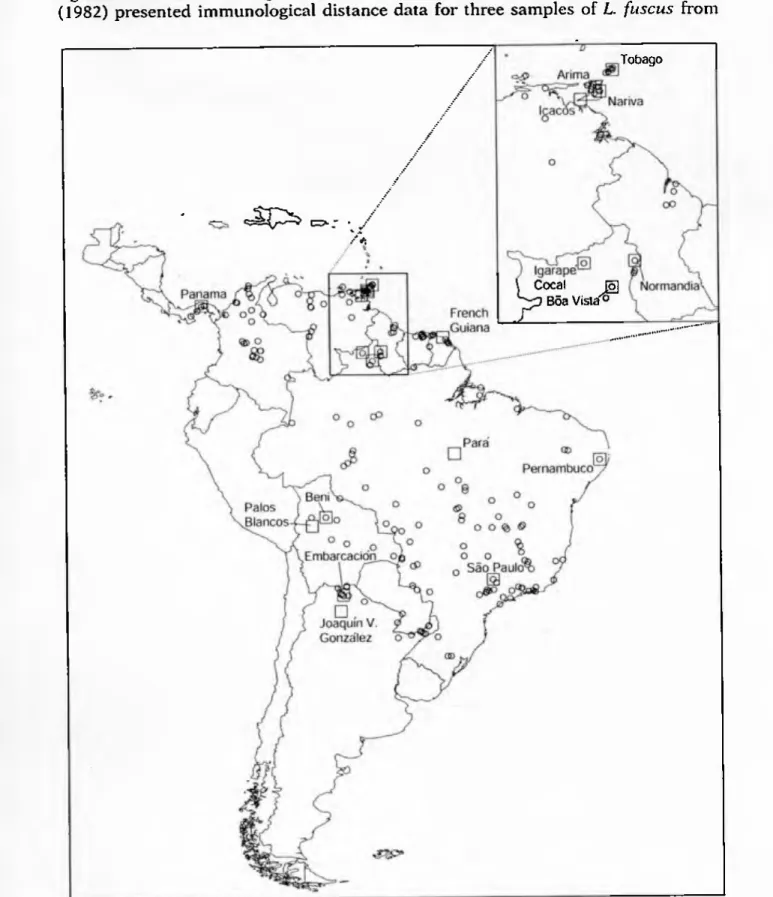
Divider of the frog Leptodactylus fuscus (circles) showing locations of 16 samples used for electrophoretic analysis (squares). Perspective can be misleading when viewing multidimensional scaling results depending on the orientation of the axes. The samples from Trinidad, the samples from Roraima, and the samples from Tobago (2) and French Guiana (9) also consistently cluster together, with the samples from French Guiana always being closer to the samples from Roraima and Tobago than the samples from Trinidad (as shown). in Fig. 2), in most perspectives the Tobago sample is more intermediate in position between the Trinidad and Roraima samples than shown in Fig.
Another type of deviation from the null model concerns the y-intercept of the ratio, that is, the expected genetic distance between two demes separated by zero geographic distance. All data points showing greater genetic differentiation than predicted by geographic distance (those values marked with ellipses in Figure 3) are accounted for by three samples: Tobago, Palos Blancos, and Para. The sample from Tobago has a higher than expected genetic differentiation compared to the three samples from Trinidad (Arima, Icacos, Nariva, the lowest three values inside the ellipse on the left side of Figure 3) compared to Tobago-Roraima genetic distances.
The nine samples north of the Amazon River demonstrate a stronger relationship between Nei and geographic distances than for the data set as a whole (Fig. 3). Thus, samples north of the Amazon River fit the Hnear differentiation model quite well. In contrast, the seven samples south of the Amazon River do not show a statistically significant relationship between NEI unbiased genetic distances and geographic distances (Fig. 3).
The fact that 14 of the 21 data comparisons have NEI distances > 0.15 indicates that significant genetic differentiation has occurred among these southern populations.
2000 4000 Distance in Kilometers
When the Panama sample data are deleted from the samples north of the Amazon River, the matrices still have a statistically significant relationship, but the correlation is not as strong. This suggests that there may have been less time available for differentiation to occur or a slower rate of differentiation between the French Guiana and Roraima localities than for the rest of the data set. SLATKIN (1993) indicated that a log-log plot of AÍ values with geographic distance would demonstrate isolation by distance if there was a linear relationship of the data.
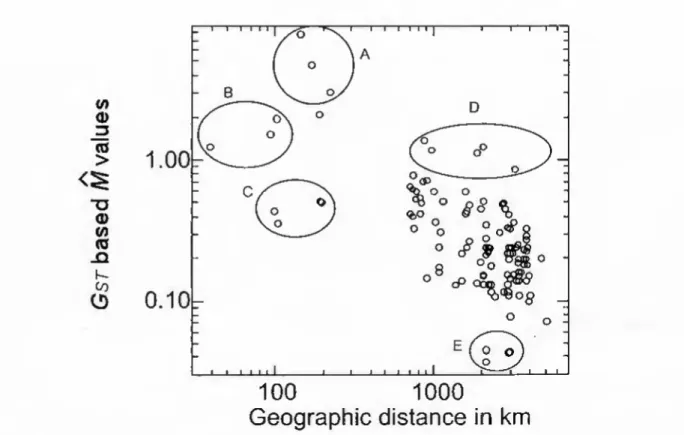
However, since two of the é values are negative, only log G^j values can be used when the entire data set is required for analysis (Table 6). Considering the entire data set, the results of the Mantel test comparing log M values based on Gsj values are statistically significant, with a matrix correlation of -0.66 and a one-tailed probability of P [random Z > observed Z] = 0.001 M values based on 0 and G^T, are very similar (Table 6), with values based on 6 being typically smaller than values based on G^T. A log plot of Gsj-based M values against geographic distance (Figure 4) indicates a generally low genetic cohesion between sample pairs.
Somewhat surprisingly, the data for the three Trinidad samples (Fig. 4, cluster B), which are the three geographically closest samples to each other in the data set, demonstrate less genetic cohesion than the three Roraima samples (Fig. 4, group A). One possible explanation is that the Trinidad samples are out of balance due to gene flow from the South American mainland through the strait at the tip of the Icacos Peninsula (see READ 1986 for a discussion of amphibian rafting from Venezuela to the Icacos Peninsula). The three data points comprising the Trinidad-Tobago comparisons show less genetic cohesion than predicted by the isolation-by-distance model (Fig. 4, cluster C).
The Ö-based score differs for this comparison, but in this case the scores have lower genetic cohesion and fall within the large cluster of points that make up most of the data. The points within group E (Figure 4) have extremely low values of genetic cohesion – there is probably no gene flow between these samples. The Panama-Beni samples with a geographic distance value of 2968 and an M value of 0.410 fall into the upper part of the dense cloud of data points in Fig.
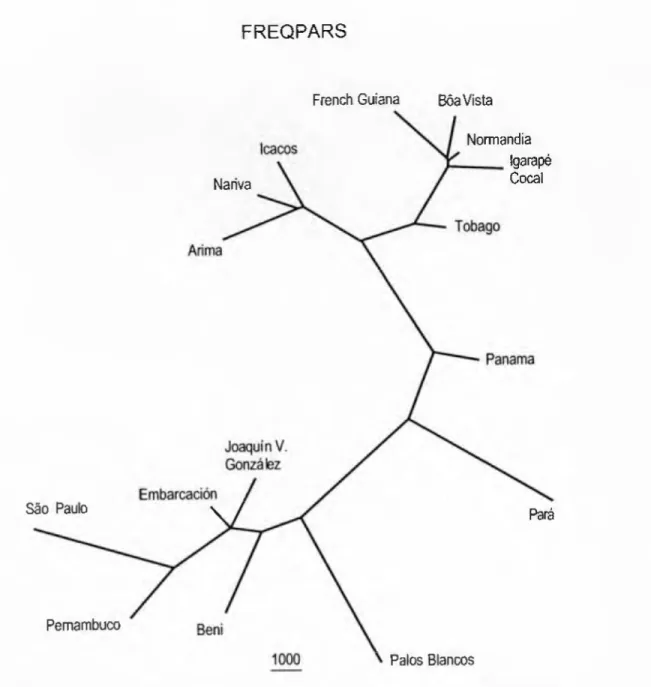
When regions are analyzed separately, isolation by distance is only supported for samples north of the Amazon River, but not for samples south of the Amazon River (results not shown). The Para sample is in the FREQPARS tree (Fig. 7), together with Panama, between the remaining northern and southern samples, or with the southern samples in the other two trees (Figs. 5-6). However, in no tree does the sample from Tobago come close to any sample from Trinidad.
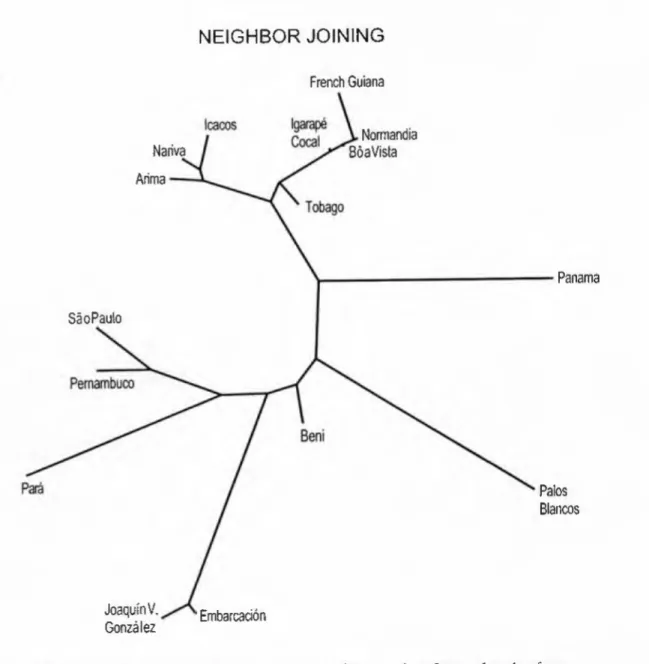
NEIGHBOR JOINING
Within the northern samples, there are slight differences in the branching pattern, but overall the results make geographic sense. Samples from Trinidad are shown together, and samples from Roraima and French Guiana are shown together. Instead, the Tobago sample is close to the Roraima/French Guiana group, but at a basal position in each, reflecting the intermediate genetic position also seen with the three-way scaling, gene flow, and geographic-genetic distance results.
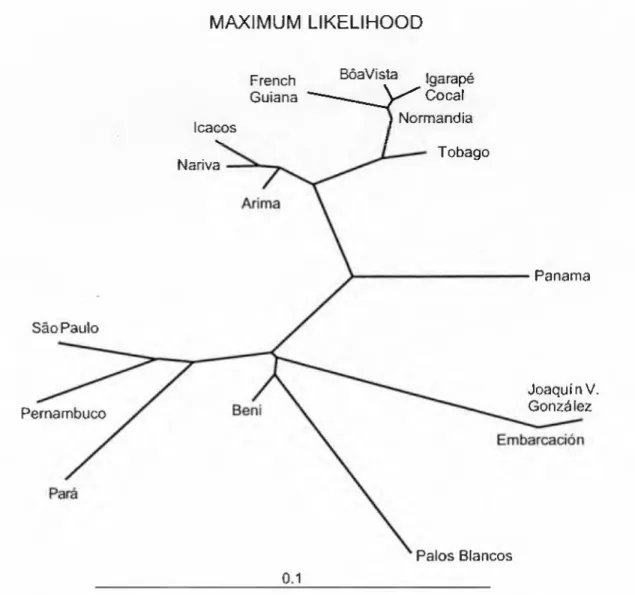
MAXIMUM LIKELIHOOD
FREQPARS
The relatively low values of genetic cohesion for the Trinidad-Tobago comparisons may be due to the water barrier, in addition to the map distances involved in the homozygosity of the Tobago sample resulting from either a founder event or some other genetic barrier. Plethodon cinereus also provides a good example of an amphibian species showing considerable genetic differentiation in the part of the range where population isolation would have occurred when habitats were fragmented and/or geographically shifted during periods of global climate change (HIGHTON & WEBSTER 1976). Our results indicate that there is deeper genetic differentiation among the remainder of the samples included in the study.
In order to evaluate the importance of the genetic partitions or banners within Leptodactylus fuscus. investigated population genetics of five species of frogs along a 1,000 km stretch of the Rio Junaá in Amazonian Brazil. With the exception of the two Bolivian samples, all other sample pairs showing high values of genetic differentiation from each other are separated by rather considerable geographical distances.
Ldli-1 alíeles c, e, and /" are otherwise restricted to northern samples (including Panama), while Ldh-1 alíeles a, b, and d are restricted to samples found south of the Amazon. For a common ancestor to have originated north of Amazon and dispersed southward, the genetic relationships would require that the ancestor was either genetically homogeneous over a wide area for a long time or had a small, genetically uniform population that dispersed southward long before it expanded its distribution north of the Amazon .Electrophoretic data can provide a rough time frame for when dispersal is thought to have occurred north of the Amazon.
If the Amazon River was a barrier, dispersal would have to be via the western part of the Amazon. Kevin de Queiroz, National Museum of Natural History, Smithsonian Institution, and Richard Highton, University of Maryland, critically reviewed penultimate versions of the manuscript. Patterns of genetic population differentiation in four species of Amazonian frogs: a test of the river barrier hypothesis.
Geographic variation and speciation in the newts of the genus Rhyacotriton (Caudata: Rhyacotritonidae). Systematic studies of the Costa Rican moss salamanders, genus Notoírííon, with descriptions of three new species, fierperological Monographs 7: 131-159. 1944, The distribution of the salamanders of the genus Plethodon in the eastern United States and Canada, Annals of the New York Academy of Sciences.
Biochemical evolution in the slimy salamanders of the Plethodon glutinosus complex in the eastern United States. Systematic and biological studies of the leopard frogs (Rana pipiens complex) of the United States.
![Fig. 2. •• Kruskal method three-way scahng plot of ROGERS' genetic distance values. ] = Panama, 2 = Tobago, 3 - Arima, Trinidad, 4 = Nartva, Trinidad, 5 = Icacos, Trinidad, 6 = Igarapé Coca), Roraima, Brazil, 7 = Normandia, Roraima, Brazil, 8 = Boa Vis](https://thumb-ap.123doks.com/thumbv2/123dok/11170573.0/14.918.104.791.593.1015/kruskal-distance-trinidad-trinidad-trinidad-igarapé-roraima-normandia.webp)