International Journal of Humanities and Social Science Invention (IJHSSI) ISSN (Online): 2319 – 7722, ISSN (Print): 2319 – 7714
www.ijhssi.org ||Volume 10 Issue 3 Ser. II || March 2021 || PP 49-60
DOI: 10.35629/7722-1003024960 www.ijhssi.org 49 | Page
Determinants of Bank Health Level in Indonesia : How does its implications for stock prices ?
Reschiwati
1),Febry Yeni Anwar
2), Aang Syahdina
3)1),2),3)
Sekolah Tinggi Ilmu Ekonomi Y.A.I
Abstract
This study aims to test and analyze the determinants of the health level of the Bank and its implications for stock prices with the Dividend Payout Ratio (DPR) as an intervening variable. The bank's health determinant which is an independent variable is the Loan to Deposit Ratio (LDR), Return on Assets (ROA), and the Capital Adequacy Ratio (CAR). While the dependent variable in this study is stock prices, and dividend payout ratio (DPR) as an intervening variable.
The population in this study were 44 banking companies listed on the Indonesia Stock Exchange for the 2015- 2019 period. Sampling method using purposive sampling. Based on the criteria set by 11 banking companies were sampled. Data analyzed using EViews 9.0 programs.
The results of this study indicate that the health determinants of banks that affect the DPR are LDR and CAR.
While the determinant of the health of the bank that affects stock prices is only LDR. The results of the path analysis in this study indicate that the DPR is a mediator of the influence of LDR on stock prices, but it is not a mediator of the influence of ROA and CAR against stock prices.
Keywords: Stock Price, Dividend Payout Ratio (DPR), Loan to Deposit Ratio (LDR), Return on Assets (ROA), Capital Adequacy Ratio (CAR)
--- Date of Submission: 02-03-2021 Date of Acceptance: 16-03-2021 ---
I. INTRODUCTION
The capital market is an activity associated with public offering and securities, public companies related to published effects, as well as institutions and professions related to the effects (Law of the Republic of Indonesia Number 8 concerning the Capital Market, 1995). The capital market is a means for the company in improving its capital structure by getting investors who are willing to invest, one of which is in stock.
Stock prices are determined by the height or low demand and offers that occur in the capital market.
Relationship Requests and stock prices are directly proportional, if demand for high shares, the stock price will be high (Sartono, 2008). Stock prices will be high if many investors want to invest in the company. Investment objectives according to (Azis, 2012) is to improve investor welfare. Therefore, before investing, investors will see the company's performance through financial statements so that the aim can be achieved properly.
Performance assessment or in this case a health determinant factor in Indonesia is regulated through (Bank Indonesia Regulation Number 13/1 / PBI / 2011, 2011) which requires banks to carry out the Bank's health level assessment using the Risk Based Bank Rating (RBBR) approach. This method consists of risk profiles (Risk Profile), Rentability (Earns), Capital (Capital), and Good Corporate Governance. Loan to Deposit Ratio (LDR) is one of the measurements for the Risk Profile category, for the measurement profitability that can be used is return on assets, (ROA), and for capital is the Capital Adequacy Ratio (CAR). Good Corporate Governance (GCG) is not included in this study, because it has different data properties.
Research that sees the effect of determinants of the level of banking health on stock prices carried out by Sunyoto & Sam'ani (2014) which proves that ROA and CAR have a significant effect on stock prices.
However, the results of the study Polii, Saerang, & Mandagie (2014) resulted in the conclusion that LDR did not have a significant influence on stock prices. Likewise with the research conducted by Effendi F. M. (2018) which proves that ROA has no significant effect on stock prices. As well as research conducted by Sulhan &
Halimah (2013) which shows that the CAR has no significant effect on the stock price (SP).
According to Widoatmodjo (2005) Investors can benefit from selling or buying shares in the form of a difference between higher selling values than the buying value of shares, in addition to stock investment benefits can also be felt by investors by enjoying dividends distributed by the company. Eisenhardt (1989) explains that agency theory consists of several assumptions, namely the assumption of human nature, organizational assumptions, and information assumptions. The theory of agents creates conflicts of interest between shareholders and management, because of different goals. Solution for this conflict can be overcome by dividend policy . Sartono (2001) concluded that what was meant by dividend policy , the allocation of
Determinants of Bank Health Level in Indonesia : How does its implications for stock prices ?
DOI: 10.35629/7722-1003024960 www.ijhssi.org 50 | Page corporate profits to be distributed to shareholders as dividends or detained in the form of retained earnings for investment financing in the future. The ratio used to overcome this conflict is DPR.
Horne (2007) states that the dividend payout ratio (DPR) is determining the amount of profit that can be detained as a funding source. So it can be concluded that this ratio shows how high the portion of profits for shareholders and the portion of profit to fund the continuity of the bank's operations. With the DPR promised by banking companies to its shareholders, this can increase stock prices because dividends are one of the objectives of investors investing in the company. This is evidenced by Nugraha & Sudaryanto (2016) which states that the DPR has a significant positive effect on stock prices.
From the above explanation it can be concluded that the DPR strongly determines the fall of stock prices. So eventhough the banking company has a healthy level of health stipulated, it is not able to establish a high DPR, it is possible that many investors not interested in investing in the banking company, because dividend is one of the goals of investors. This is what makes the author of the author choose the DPR as an intervening variable.
II. LITERATURE STUDIES AND HYPOTHESES Agency theory
According to Anthony (2005) Theory of agency is a contract between Principal and Agent. Every individual is motivated by his own interests so that conflicts of interest. Principal is the owner of the company and agent is the person paid by the owner to run a company. Principal here is an investor as a shareholder and company owner while the agent itself is a company management.
Meanwhile Eisenhardt (1989) explained that the theory of agency consisted of several assumptions.
These assumptions are, the assumption of human nature, organizational assumptions, and information assumptions. The assumption of human nature means that human nature is usually more selfish, has limited rationality and does not like risk. Organizational assumptions are conflicts between organizational members and information asymmetry between principals and agents, while information assumptions are information as commodities traded.
Of the two opinions above it can be concluded that the agent's theory creates conflicts of interest between shareholders and management, because of different goals. Shareholders want high investment returns, while managers want their interests accommodated with high compensation or incentives for performance.
Information asymmetry theory
Information asymmetry means that managers have access to company information that are not owned by the company outside. According to Supriyono (2000) Information Asymmetry is the condition of the principal does not have information on information on the performance of the agent, so the principal has not succeeded in finding the contribution of the agent business on the results of the real company. Whereas according to Suwardjono (2014) management is a ruler of information than investors or creditors. Another opinion was revealed Hanafi (2014) who said that there was a strong relationship between the concept of signaling with information asymmetry. Information asymmetry theory shows that not all parties get important company information, about the prospects and risk of the company.
Assuming individuals act maximize your own interests, then using information asymmetry will encourage the agent to hide some unknown principal information as the owner. With the asymmetry between the management (agent) with the owner (Principal) provides an opportunity for managers to carry out earnings management to increase their utilities. This can be minimized by providing quality information for all financial statements users.
There are two types of information asymmetry based on the way a party has more superior information than other parties, namely Adverse Selection and Moral Hazard (Scott, 2009).
Stakeholders Theory.
According to Ghozali (2007) In addition to operating in the interest of the internal parties, the company must also provide benefits for stakeholders, because the welfare of the company is inseparable from stakeholder support. Stakeholders are stakeholders to the existence and activity of the company, not only from within the company, but also be found out of the company. (Puspitasari, 2017).
Almost the same as the opinion Wibisono Y. (2007) said that stakeholders are direct or indirect interested groups that influence or influenced by the activities and existence of the company. The conclusion is stakeholders and companies influence each other, so that changes to one of the parties will have an impact on the other party. Stakeholders according to Wibisono Y. (2007) are: (1) internal and external stakeholders; (2) primary, secondary and marginal stakeholders; (3) traditional stakeholders and future stakeholders; (4) siding, opposing, and no matter; (5) silent majority and vocal minority
Of some of these stakeholder theories it can be concluded that stakeholders are important parties in the company's activities whether they are direct or indirect impact. The existence of stakeholders is very influential
Determinants of Bank Health Level in Indonesia : How does its implications for stock prices ?
DOI: 10.35629/7722-1003024960 www.ijhssi.org 51 | Page on the sustainability of the company in accordance with its interests. The company must maintain good relations with all stakeholders without exception by making the right decisions of any existing problems.
Signaling theory.
Signalling theory emphasizes the importance of information issued by the Company on the company's investment decisions outside the company. According to Jogiyanto (2000) in the study Norazmi (2014) information published as an announcement will provide a signal for investors in investment decision making. If the announcement contains a positive value, it is expected that the market will react at the time of the announcement received by the market. At the time of information it was announced and all market participants have received the information, market participants first interpret and analyze the information as a good signal (good news) or a bad signal (bad news). If the announcement of the information is a signal that is good for investors, there is a change in the volume of stock trading.
According to Sharpe (1997) and Ivana (2005) in the study Norazmi (2014) the announcement of accounting information gave a signal that the company had a good prospect in the future so that investors were interested in trading stocks, thus the market would react reflected Through changes in the volume of stock trading. Thus the relationship between information publications, both financial statements, financial conditions or socio-political on the fluctuations in stock trading volume can be seen in market efficiency.
One type of information issued by companies that can be a signal for parties outside the company, especially for investors is an annual report. Information disclosed in annual reports can be in the form of accounting information, namely information relating to the financial statements and non-accounting information, namely information that is not related to financial statements. The annual report should contain relevant information and disclose information that is considered important to know by users of reports both internal parties and external parties. All investors need information to evaluate the relative risk of each company so that it can diversify portfolios and investment combinations with the desired risk preferences.
Pecking Order theory
Donaldson (1961) was referred to by Myers (1984) in Wijaya M. E. (2001) found that there was a trend in the company to determine the selection of funding sources. Management behavior that does not take part in the order of funding according to Pecking Order Theory is a bad signal about the prospect of the company in the future. Pecking Order Theory refers to the company theory that aims to maximize the prosperity of the company owner.
Myers (1984) in Wijaya M.E (2001) argues that funding decisions based on Pecking Order Theory will follow the following funding sequences: (1) The company will prefer funding from internal sources (funding from the results of the company's operations); (2) the company adjusts dividend payment target to investment opportunities; (3) Dividend policies are sticky, fluctuations in profitability and investment opportunities have an impact on the internal cash flow can be greater or smaller than investment expenditure; (4) if external funds are needed, the company will try to choose the source of funds from debt because it is safer and published New equity as the last choice to meet the source of funds.
According to Manurung (2004) Pecking Order Theory was introduced by Gordon Donaldson (1961) that the company has a sequence in financing which began with the order of retained earnings, debt to third parties both with loans or selling bonds and finally by issuing new shares. The order of financing is the order based on the costs that the company must incur and equity costs are the highest cost. Whereas according to Hanafi (2016) the theory of Pecking Order is more emphasis on the company with a high level of profit has a little debt. The low level of debt is because the company has sufficient internal funds to finance investment needs. According to Fahmi (2015) Packing Order theory is a company policy by selling assets. Like selling buildings, land, equipment and other assets, it does not rule out the possibility of funds from retained earnings.
Market Timing Theory
Market timing theory stems from the term equity market timing which means selling shares when the company or company value is high and making purchases when the company's stock price is low, so from the results of this research, they reveal that capital structure policies also have the same technique, that is. issuing shares for sale to the public when the price is high and buying them back when the firm value is low (Baker &
Wurgler, 2002).
The market timing theory approach put forward by Baker & Wurgler (2002) includes: (1) Analysis of actual financial decisions which shows that companies tend to issue equity as a substitute for debt when the market value is high relative to book value and buy shares again when low market value; (2) Long-term analysis of stock returns followed by the company's financial decisions, namely issuing shares when the cost of equity is relatively low and buying them back when costs are high; (3) Analysis of revenue forecasting and its realization around the issuance of shares, that companies tend to issue shares when investors are enthusiastic and have an
Determinants of Bank Health Level in Indonesia : How does its implications for stock prices ?
DOI: 10.35629/7722-1003024960 www.ijhssi.org 52 | Page optimistic character on the company's earning prospects; (4) Managers use market timing, namely issuing shares when the price is high and buying them back when the price is low.
Dividend Policy Theory
According to Ambarwati (2010), the theory related to dividend policy, which is about the high or low dividends desired by investors, consists of: (1) Dividend Irrelevance Theory, from Merton Miller and Franco Modigliani which states that the value of a company is determined by net income before tax. companies and the business risks of these companies. This theory also explains that dividend and capital gains do not affect anything; (2) The Bird In Hand Theory of Gordon and Lintner which states that dividends that have been received are certain, so they have a smaller risk than capital gains. Gordon and Lintner also argue that investors prefer dividends because of their certainty; (3) The Tax Preference Theory of Litzenberger and Ramaswamy which states that capital gains is preferred because the tax on capital gains will be paid after the shares are sold, while the tax on dividends must be paid annually after dividends are received and the amount is greater. This allows investors to like it if the company's management retains some of the profits (Sawir, 2004).
Stock price
The share price is formed through the supply and demand mechanism in the capital market. If a stock is oversubscribed, the stock price tends to rise. Conversely, if the supply is excess, the stock price tends to fall (Sartono, 2008). Brigham & Houston (2010) states that share prices determine shareholder wealth. The share price at any given time depends on the cash flow received by investors in the future. Share Prices consist of many types, including (1) Nominal Price, namely the price stated on the share certificate determined by the issuer to assess the issued shares; (2) Initial Price, namely the price that occurs when the initial share price is recorded on the stock exchange determined by the underwriter and issuer; (3) Market Price, namely the selling price from one investor to another. This transaction no longer involves the issuer from the underwriter, this price represents the price of the issuing company; (4) Opening Price, namely the price requested by the seller or buyer at the opening of exchange hours; (5) Closing Price, namely the agreed price of the buyer and seller at the end of the exchange day; (6) Highest Price, namely the highest level of share price on an exchange day, which is caused by the transaction of a share more than once at different prices; (7) The lowest price, which is the lowest price on an exchange day, which is caused by more than one share transaction at different prices; (8) Average Price which is the highest total price plus the lowest price and is divided into two (Widoatmodjo, 2005).
The fluctuation of share prices is influenced by several factors, namely: (1) Micro and macro economic conditions; (2) Decisions for expansion such as opening branch offices at home and abroad; (3) changes in the board of directors suddenly; (4) The commissioners or directors are involved in a criminal act; (5) Decrease in company performance from time to time; (6) Systematic risks involving companies; (7) Market psychology that is able to suppress the technical conditions of buying and selling shares (Fahmi, 2012).
According to Brigham & Houston (2010) several factors that influence the ups and downs of stock prices consist of internal and external factors. Internal factors consist of: (1) sales production marketing announcements such as advertisements, contracts, price changes, new product withdrawals, production reports, security reports, and product sales reports; (2) Announcement of funding related to equity and debt; (3) Announcement of organizational structure changes; (4) Announcement of investment merger reports, equity investment reports, take over reports, and other investment reports; (5) factory expansion, research development and business closure; (6) Employment announcements, such as new negotiations, new contracts, strikes and others; (7) Announcement of financial statements, such as forecasting earnings before and after the end of the fiscal year. External factors consist of: (1)
Announcement of various economic regulations issued by the government; (2) Legal announcements relating to claims against the company or the company's internal environment; (3) Announcement regarding the securities industry.
Loan To Deposit Ratio (LDR)
According to (Bank Indonesia Regulation Number 15/15 / PBI, 2013) concerning the minimum statutory reserve requirement for banks in rupiah and foreign currency for conventional commercial banks the Loan to Deposit Ratio (LDR) is a ratio to measure the composition of the amount of credit extended compared to the amount of public funds and own capital is used. LDR is a ratio that measures a bank's ability to meet financial obligations that must be fulfilled. LDR is also used to measure bank liquidity. LDR is the ratio between the total amount of credit provided by the bank and the funds received by the bank (Dendawijaya, 2009). Meanwhile, according to Pandia (2012) LDR is a ratio that states how far a bank has used deposit money to provide loans to its customers. In other words, the amount of money that is used to make loans is money that comes from deposits from depositors. According to Kasmir (2012) LDR is a ratio to measure the amount of
Determinants of Bank Health Level in Indonesia : How does its implications for stock prices ?
DOI: 10.35629/7722-1003024960 www.ijhssi.org 53 | Page credit compared to the amount of public funds and own capital. LDR shows how far the bank's ability to pay back withdrawals made by depositors by relying on credit as a source of liquidity.
Based on (Bank Indonesia Circular Letter Number 6/23 / DPNP, 2004) The standard for determining the level of Loan to Deposit Ratio (LDR) is as follows Very healthy: LDR ≤ 75%; Healthy: 75% <LDR ≤ 85%;
Fairly Healthy: 85% <LDR ≤ 100%; Unhealthy 100% <LDR ≤ 120%; Unhealthy LDR> 120%. (Junaeni, 2016)
Return On Assets (ROA)
According to Tandelilin (2010) Return On Assets (ROA) describes the extent to which the company's assets can generate profits. ROA is used to measure past company profits that are projected in the future.
Brigham E. d. (2001) and Suad (1998) calculate ROA by comparing net income available to common stockholders with total assets.
The increase in the percentage of ROA has an effect on the level of profit achieved and proves that the aspect of securing company assets is well controlled (Dendawijaya, 2000). If the level of profit achieved by a bank is high, it will affect the bank's share price because the higher the profit of a bank, the higher the interest of shareholders to invest in the bank. The high percentage of ROA explains the good financial performance caused by the higher rate of return.
Based on (Bank Indonesia Circular Letter Number 6/23/DPNP, 2004) the standard for determining the rate of Return On Assets (ROA) is Very Healthy: ROA> 1.5%; Healthy: 1.25% <ROA ≤ 1.5%; Fairly Healthy:
0.5% <ROA ≤ 1.25%; Less Healthy: 0% <ROA ≤ 0.5%; Unhealthy: ROA ≤ 0% (Junaeni, 2016).
Capital Adequacy Ratio (CAR)
Capital Adequacy Ratio (CAR) is a ratio that defines all assets that contain credit risk, investments, securities, claims financed by own capital, and others (Dendawijaya, 2009). This definition is similar to Mudrajat & Suhardjono (2011) which states that CAR is capital adequacy and the ability of bank management to identify, measure, supervise and control risks that affect bank capital.
In principle, CAR calculation is for every investment in the form of credit that contains risk, so that a certain amount of capital must be provided which is adjusted to a certain percentage according to the amount of investment (Budiawan, 2008). This ratio also aims to ensure that if the bank experiences losses in its activities, the availability of capital owned by the bank is able to cover these losses, so that the bank is able to maintain its existence which can affect the bank's share price. Dendawijaya (2009) argues that capital is an important factor for expansion and to accommodate the risk of loss.
Based on (Bank Indonesia Circular Letter Number 6/23/ DPNP, 2004), the standard level of capital is set, namely Very Healthy: CAR> 12%; Healthy: 9% ≤ CAR <12%; Fairly Healthy: 8% ≤ CAR <9%; Less healthy: 6% <CAR <8%; Unhealthy: CAR ≤ 6% (Junaeni, 2016).
Dividend Payout Ratio (DPR)
According to Suad (1996) dividends are the company profits of each company, so it requires more serious consideration from company management. This dividend is distributed to shareholders as profit from company profits. Dividends are determined based on the general meeting of shareholders and the type of payment depends on the policy of the leadership. Based on the description above, it can be concluded that dividends are part of the company's profits distributed to shareholders. So the company can pay dividends if it makes a profit.
Horne (2007) states that the Dividend Payout Ratio (DPR) is the amount of profit that can be retained in the company as a source of funding. The percentage of profit paid in the form of dividends or the ratio between the profit paid in the form of dividends and the total profit available to shareholders. So it can be concluded that this ratio is used to measure the percentage of net income for shareholders in the form of dividends for one year and the percentage of profit for banking company operations.
The size of the dividends given to shareholders depends on company policy. Not all profits or profits obtained by the company are distributed in the form of dividends. Some of these profits are used as retained earnings which can later be used for the benefit of the company's growth. Between dividends and retained earnings is often a conflict of interest in the company. For this reason, the DPR ratio is used as a comparison between dividends and profits available to shareholders (Suhadak & Hidayat, 2015). If this ratio is getting bigger, it means that the company is allocating profits for its shareholders. Conversely, if this ratio is small, it means that the company allocates a portion of its net profit to meet the internal needs of the company (Antara, 2012). The DPR reflects the dividend policy taken by the company in dividend distribution (Wardjono, 2010).
If the company is able to pay dividends in cash, it will be a good signal for investors, whereas if the company is reluctant to pay dividends, it will be a negative signal for investors because the company is considered to need funds. According to Warsono (2002) the DPR is a comparison between dividends per common share and profit available to ordinary shareholders, the amount of the dividend payout ratio calculation shows the proportion of
Determinants of Bank Health Level in Indonesia : How does its implications for stock prices ?
DOI: 10.35629/7722-1003024960 www.ijhssi.org 54 | Page the allocation of the profit per share to the dividends of each share. This ratio measures how much part of the net profit after tax is paid a portion of dividends to shareholders. The greater this ratio means that the less share of profits is retained to spend on investments made by the company (Sudana, 2011). According to Kurniawati, Sari, & Dewi (2012) the DPR is used to predict the return for investors, meaning that the greater the dividends distributed by the company or issuer, the more investors will be interested in the company's shares.
According to Suhadak & Hidayat (2015) companies that make large profits, theoretically the company will be able to distribute bigger dividends. By increasing the company's ability to generate profits, the company will be able to distribute dividends to shareholders so that the greater the dividends to be distributed. This will cause the share price to increase. Based on this, many investors are interested in buying shares of companies that have a high ability to generate profits.
Research design
Figure 1 The Influence of Determinants of Bank Health Level and LDR on Stock Prices
Hypothesis
H1: There is an effect of the Loan To Deposit Ratio (LDR) on the Dividend Payout Ratio (DPR) H2: There is an effect of Return On Assets (ROA) on Dividend Payout Ratio (DPR)
H3: There is an effect of Capital Adequacy Ratio (CAR) on Dividend Payout Ratio (DPR)
H4: There is an effect of Loan to Deposit Ratio (LDR), Return On Assets (ROA), and Capital Adequacy Ratio (CAR) on Dividend Payout Ratio (DPR)
H5: There is an effect of the Loan To Deposit Ratio (LDR) on Share Prices H6: There is an effect of Return On Assets (ROA) on Stock Prices
H7: There is an effect of Capital Adequacy Ratio (CAR) on Stock Prices H8: There is an influence of the Dividend Payout Ratio (DPR) on stock prices
H9: There is an effect of Loan to Deposit Ratio (LDR), Return On Assets (ROA), Capital Adequacy Ratio (CAR) and Dividend Payout Ratio (DPR) on Stock Prices
Research methods
This type of research is quantitative. The population of the study is the annual financial statements of banking companies listed on the Indonesia Stock Exchange (IDX) for the period 2015¬-2019, totaling 44 banking companies. Determination of the research sample using purposive sampling (based on certain criteria), which is consistent in publishing annual financial reports during the study period, banking companies that generate profits during the study period, and have complete financial reports according to the data required, and finally consistent in the distribution. cash dividends to shareholders during the study period. From these criteria, the research sample obtained from 11 banking companies with a total of 55 observational data.
Measurement of Research Variables Loan To Deposit Ratio (LDR)
Return On Assets (ROA)
Capital Adequacy Ratio (CAR)
H5 H5
H1
H2 H8
H6
H3 H4 H7
H9 Loan To Deposit Ratio
(LDR)
Return On Asset (ROA)
Capital Adequacy Ratio (LDR)
Stock Price (SP) Dividend Payout
Ratio (DPR)
LDR = Total Credits x 100%
Third-party funds
ROA = Earning before tax x100%
Total Assets
CAR = Capital x100%
Risk Weighted Assets
Determinants of Bank Health Level in Indonesia : How does its implications for stock prices ?
DOI: 10.35629/7722-1003024960 www.ijhssi.org 55 | Page Dividend Payout Ratio (DPR)
Stock price
The stock price used in this study is the closing stock price.
Data Analysis and Hypothesis Testing Descriptive Statistical Analysis
Descriptive statistical analysis provides a description or description of data seen from the average value (mean), standard deviation, highest value (maximum) and lowest value (minimum) (Ghozali, 2011).
Panel Data Regression Analysis and Hypothesis Testing
Panel data regression estimation model can be done with three approaches (Basuki A. T., 2017), namely:
Common Effect Model (CEM), Fixed Effect Model (FEM), and Random Effect Model (REM). The test procedure to determine the panel data regression model, namely: the chow test which functions to determine the best model between fixed effects and common effects, the Hausman test which functions to select the best model between Fixed Effects or Random Effects, and the lagrange multiplier test which functions to determine the best model. between the Random Effect or the Common Effect.
Path Analysis
According to Sarwono (2012) path analysis is a technique for analyzing the causal relationship that occurs in multiple regression if the independent variable affects the dependent variable not only directly but also indirectly. Based on the trimming theory, insignificant pathways are discarded, in order to obtain a model that is supported by empirical data.
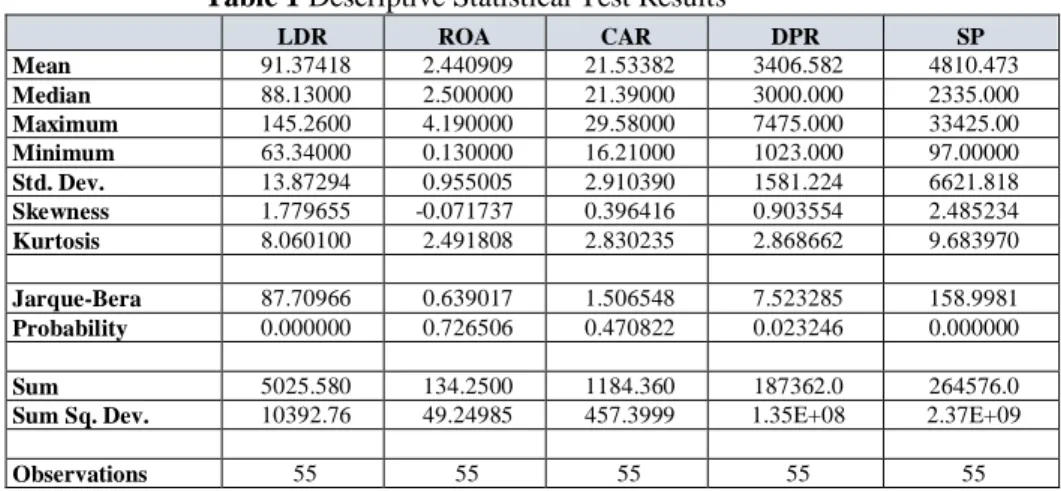
III. RESULTS Descriptive Statistical Analysis
Table 1 Descriptive Statistical Test Results
LDR ROA CAR DPR SP
Mean 91.37418 2.440909 21.53382 3406.582 4810.473 Median 88.13000 2.500000 21.39000 3000.000 2335.000 Maximum 145.2600 4.190000 29.58000 7475.000 33425.00 Minimum 63.34000 0.130000 16.21000 1023.000 97.00000 Std. Dev. 13.87294 0.955005 2.910390 1581.224 6621.818 Skewness 1.779655 -0.071737 0.396416 0.903554 2.485234 Kurtosis 8.060100 2.491808 2.830235 2.868662 9.683970
Jarque-Bera 87.70966 0.639017 1.506548 7.523285 158.9981 Probability 0.000000 0.726506 0.470822 0.023246 0.000000
Sum 5025.580 134.2500 1184.360 187362.0 264576.0 Sum Sq. Dev. 10392.76 49.24985 457.3999 1.35E+08 2.37E+09
Observations 55 55 55 55 55
Based on table 1 above shows that for the LDR variable, of the 55 observed data, it has an average value of 91.37418. This means that when viewed from the aspect of the average LDR, the Bank used as observation is categorized as Fairly Sound. There is a very healthy bank, reflected in the maximum value of 145,2600. From the table, there are also unhealthy banks, this can be seen from the minimum value of 63.34000, the median of 88.13000 which reflects Fairly Sound with a standard deviation of 13.87294.
From the aspect of ROA, the average observed bank is very healthy, this can be seen from an average of 2.440909, a median of 2.500000, a maximum value of 4.190000, There are banks in the Healthy category, the minimum value is 0.130000, with a standard deviation of 0.955005.
From the CAR aspect, all banks observed were in the very healthy category. This is reflected in the average number of 21.53382, the maximum value of 29.58000, the minimum value of 16.21000, the median of 21.39000 and. standard deviation of 2.910390
For the DPR, it is found that the amount of profit that can be retained in the company as a source of funding is an average of 3406,582, with a maximum value of 7475,000, a minimum value of 1023,000, and a midpoint value of 3000,000, with a standard deviation of 1581,224.
The average closing share price was 4810,473, with a maximum value of 33425.00, a minimum value of 97.00000, a midpoint of 2335,000, and a standard deviation of 6621,818.
DPR = Dividend Per Share Earning Per Share
Determinants of Bank Health Level in Indonesia : How does its implications for stock prices ?
DOI: 10.35629/7722-1003024960 www.ijhssi.org 56 | Page Hypothesis Test Results and Path Analysis
The results of hypothesis testing in this study are divided into two structures, namely structure I, seeing the effect of variable (X) on variable (Z) and structure II, namely seeing the effect of variable (X) and variable (Z) on variable (Y). While the results of the path analysis see whether the variable (Z) is a mediator of the influence of the variable (X) on the variable (Y).
Result of Structure Hypothesis Test I
After doing the chow test, hausman test, and lagrange multiplier test, the model chosen for structure I is the Fixed Effect Model (FEM). The following is a Fixed Effect Model table for structure I:
Table 2
Fixed Effect Model – Structure I
Sample: 2015 2019 Periods included: 5 Cross-sections included: 11
Total panel (balanced) observations: 55 Linear estimation after one-step weighting matrix
White cross-section standard errors & covariance (d.f. corrected)
Variable Coefficient Std. Error t-Statistic Prob.
C 6.978179 0.114023 61.19983 0.0000
LDR 0.006809 0.001459 4.666957 0.0000
ROA 0.019911 0.024613 0.808945 0.4232
CAR 0.017892 0.007745 2.310101 0.0260
Effects Specification Cross-section fixed (dummy variables)
Weighted Statistics
R-squared 0.962925 Mean dependent var 13.60647
Adjusted R-squared 0.951170 S.D. dependent var 8.035952
S.E. of regression 0.165209 Sum squared resid 1.119049
F-statistic 81.91312 Durbin-Watson stat 1.532079
Prob(F-statistic) 0.000000
Unweighted Statistics
R-squared 0.860830 Mean dependent var 8.034220
Sum squared resid 1.502041 Durbin-Watson stat 1.699786
From table 2 above, the equation for structure I is obtained as follows:
The DPR value is 6.978179, if the LDR, ROA and CAR values are zero. The regression coefficient for the LDR variable is 0.006809, meaning that if other independent variables remain and the LDR increases by 1 unit, the DPR will increase by 0.006809. The coefficient is positive, meaning that there is a positive relationship between the LDR and the DPR, the higher the LDR, the higher the DPR. The same is true for ROA and CAR.
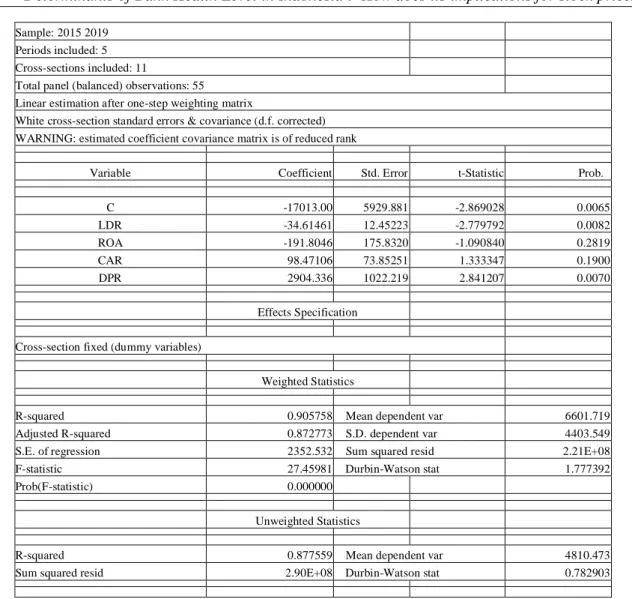
Result of Structure Hypothesis Test II
After the chow test, hausman test, and lagrange multiplier test for structure II, the model chosen for structure II is the Fixed Effect Model (FEM). The following is a Fixed Effect Model table for structure II:
Table 3
Fixed Effect Model – Structure II
Dependent Variable: SP
Method: Panel EGLS (Cross-section weights) Date: 11/05/20 Time: 13:03
DPR = 6.978179 + 0.006809LDR + 0.019911ROA + 0.017892CAR
Determinants of Bank Health Level in Indonesia : How does its implications for stock prices ?
DOI: 10.35629/7722-1003024960 www.ijhssi.org 57 | Page
Sample: 2015 2019 Periods included: 5 Cross-sections included: 11
Total panel (balanced) observations: 55 Linear estimation after one-step weighting matrix
White cross-section standard errors & covariance (d.f. corrected) WARNING: estimated coefficient covariance matrix is of reduced rank
Variable Coefficient Std. Error t-Statistic Prob.
C -17013.00 5929.881 -2.869028 0.0065
LDR -34.61461 12.45223 -2.779792 0.0082
ROA -191.8046 175.8320 -1.090840 0.2819
CAR 98.47106 73.85251 1.333347 0.1900
DPR 2904.336 1022.219 2.841207 0.0070
Effects Specification Cross-section fixed (dummy variables)
Weighted Statistics
R-squared 0.905758 Mean dependent var 6601.719
Adjusted R-squared 0.872773 S.D. dependent var 4403.549
S.E. of regression 2352.532 Sum squared resid 2.21E+08
F-statistic 27.45981 Durbin-Watson stat 1.777392
Prob(F-statistic) 0.000000
Unweighted Statistics
R-squared 0.877559 Mean dependent var 4810.473
Sum squared resid 2.90E+08 Durbin-Watson stat 0.782903
Based on table 3 above, it can be concluded that equation II is as follows:
From the structure II equation above, it can be concluded that the share price is -17013.00, if the LDR, ROA, CAR and DPR values are equal to zero. LDR variable regression coefficient of -34.6146; This means that if other independent variables are fixed in value and the LDR increases by 1 unit, then the share price will decrease by 34,6146. The coefficient is negative, meaning that there is a negative relationship between the LDR and the stock price, the higher the LDR, the lower the stock price. The same applies to ROA, CAR and DPR.
However, CAR and DPR are directly proportional to stock prices because they have a positive coefficient value.
Path Analysis Test Results
The table below is a table of direct and indirect effect analysis. Based on the trimming theory, the insignificant pathway is discarded, in order to obtain a model that is supported by empirical data for indirect effects.
Table 4 : Analysis of Direct and Indirect Effects
Variable Direct Influence to Indirect Influence to
DPR Significance SP Significance SP Significance
LDR 0.006809 Significant -34.61461 Significant 19.775624 Significant
ROA 0.019911 Not significant -191.8046 Not significant
CAR 0.017892 Significant 98.47106 Not significant
DPR 2904.336 Significant
IV. CONCLUSION AND DISCUSSION
H1: Loan to Deposit Ratio (LDR) has a positive and significant effect on Dividend Payout Ratio (DPR). From the results of the partial test calculation, the t-count value is 4.666957, the probability value is 0.0000, and the coefficient is 0.006809. Loan To Deposit Ratio (LDR) is closely related to the Dividend Payout
SP = -17013.00 -34.61461LDR -191.8046ROA+ 98.47106CAR+ 2904.336DPR
Determinants of Bank Health Level in Indonesia : How does its implications for stock prices ?
DOI: 10.35629/7722-1003024960 www.ijhssi.org 58 | Page Ratio (DPR), because company liquidity is the main consideration in dividend policy, dividends for companies are cash outflows, the greater the cash position and liquidity of the company as a whole will have an impact on the percentage of dividends. Payout Ratio (DPR). This is in accordance with research conducted by Karauan, Murni, & Tulung (2017) which states that partially the Loan to Deposit Ratio (LDR) has a significant effect on the Dividend Payout Ratio (DPR) in state-owned banks that go public on the Indonesian stock exchange. 2011- 2015.
H2: Return On Assets (ROA) has a positive and insignificant effect on the Dividend Payout Ratio (DPR). From the table of hypothesis test results, it is found that the coefficient value is 0.019911, the t-count value is 0.808945 and a large probability value of 0.05 is 0.4232. According to Tandelilin ( 2010), Return On Assets (ROA) describes the extent to which the company's assets can generate profits, while the Dividend Payout Ratio (DPR) is the ratio of the comparison between dividends and profits available to shareholders (Suhadak & Hidayat, 2015). This ratio shows how high the portion of profits is given to shareholders and the portion of profits that is used to fund the continuity of the bank's operations. So it can be concluded that the high value of Return On Asset (ROA) has a positive effect on the value of the Dividend Payout Ratio (DPR), but not significant because there are other factors that influence, namely management policies related to the percentage of retained earnings required by the company. This is in accordance with research conducted by Meilani & Amboningtyas (2017) which states that Return On Asset (ROA) has a positive effect on the Dividend Payout Ratio (DPR) in manufacturing companies listed on the Indonesia Stock Exchange for the period 2012- 2016.
H3: Capital Adequacy Ratio (CAR) has a positive and significant effect on Dividend Payout Ratio (DPR). The coefficient value is 0.017892, the t-count value is 2.310101 and the probability is 0.0260 <0.05.
Capital Adequacy Ratio (CAR) describes the existence of a company. In accordance with the theory Mudrajat
& Suhardjono (2011) Capital Adequacy Ratio (CAR) is capital adequacy and the ability of bank management to identify, measure, supervise and control risks that affect bank capital. The higher the existence of a banking company, the company is able to allocate company profits in the form of dividends to attract investors to invest in the banking company. . The results of this study are in accordance with the results of research Wahyuni (2014) which states that the Capital Adequacy Ratio (CAR) has a significant effect on the Dividend Payout Ratio (DPR).
H4: Loan to Deposit Ratio (LDR), Return On Assets (ROA), and Capital Adequacy Ratio (CAR) together have a positive and significant effect on Dividend Payout Ratio (DPR). The F-statistic value is 81.91312, the probability value is 0.000000, which is smaller than 0.05 which means significant, the R square value is 0.962925. This is because the Loan To Deposit Ratio (LDR), Return On Assets (ROA), and Capital Adequacy Ratio (CAR) are Risk Based Bank Rating (RBBR) whose function is to maintain the soundness level of a profit-oriented bank as regulated in (Bank Indonesia Regulation). Number 13/1 / PBI / 2011, 2011) then this affects the Dividend Payout Ratio (DPR) that will be received by investors, because the percentage of Dividend Payout Ratio (DPR) depends on the profits generated by the banking company. This is consistent with research (Karauan, Murni, & Tulung (2017) which states that the Loan to Deposit Ratio (LDR), Capital Adequacy Ratio (CAR), Return On Assets (ROA), Return On Equity (ROE) simultaneously have a significant effect. to the Dividnd Payout Ratio (DPR) in SOEs Going Public on the Indonesia Stock Exchange 2011-2015.
H5: Loan to Deposit Ratio (LDR) has a negative and significant effect on stock prices (HS). The coefficient value is -34.61461, the t-count value is -2.779792, the probability value is 0.0082 <0.05. The higher the Loan To Deposit Ratio (LDR), an indication of the lower liquidity capacity of the bank, because the amount of funds needed to finance credit has an impact on stock prices. Evidenced by Martanorika (2018) which states that the Loan to Deposit Ratio (LDR) has a negative and significant to the Share Price of commercial banks listed on the Indonesia Stock Exchange from 2014 to 2016.
H6: Return on assets (ROA) has a negative and insignificant effect on stock prices. The coefficient value of Return On Assets (ROA) is -191.8046, t-count is -1.090840, and the probability value is 0.2819> 0.05.
So it can be concluded that the increase or decrease in the value of Return On Assets (ROA) does not really have an impact on stock prices. According to Munawir (2001) Return on Assets (ROA) has weaknesses, namely that it is strongly influenced by the fixed asset depreciation method, contains quite a large distortion, especially in conditions of inflation. This is the reason investors are not too concerned with the percentage of Return On Assets (ROA). This is in accordance with the results of research Wulandari & Badjra (2019) which states that Return On Assets (ROA) has no significant effect on share prices in LQ-45 companies on the Indonesia Stock Exchange (IDX).
H7: Capital Adequacy Ratio (CAR) has a positive and insignificant effect on stock prices. The coefficient value of the Capital Adequacy Ratio (CAR) to the Stock Price (HS) is 98.47106, the t-count value is 1.333347 with a probability value of 0.1900 which is greater than 0.05. This is in accordance with the results of research conducted by Sulhan & Halimah (2013) which shows that the Capital Adequacy Ratio (CAR) does not have a significant effect on stock prices (SP). This occurs because capital functions to finance operations, as an
Determinants of Bank Health Level in Indonesia : How does its implications for stock prices ?
DOI: 10.35629/7722-1003024960 www.ijhssi.org 59 | Page instrument to anticipate risks, and as a tool for business expansion. So a high Capital Adequacy Ratio (CAR) will increase share prices but this is not significant because there are still many other factors that cause share prices to fluctuate, such as management decisions in changing organizational structures, and so on.
H8: Dividend Payout Ratio (DPR) has a positive and significant effect on stock prices. The coefficient value for the Dividend Payout Ratio (DPR) variable is 2904,336, the t-count value is 2.841207 with a probability of 0.0070 which is smaller than 0.05. This is also proven by Nugraha & Sudaryanto (2016) that the Dividend Payout Ratio (DPR) has a significant positive effect on share prices in basic industrial companies and chemicals listed on the IDX for the period 2010-2014). The high percentage of Dividend Payout Ratio (DPR) is highly expected by investors because dividends are one of the objectives of investors in investing in accordance with the theory put forward by Widoatmodjo (2005) about the advantages of buying shares, one of which is dividend payments on these shares. So, if a banking company is able to set a high percentage of the Dividend Payout Ratio (DPR), it will have an impact on the high stock prices of companies, including banking companies.
H9: Loan to Deposit Ratio (LDR), Return On Assets (ROA), Capital Adequacy Ratio (CAR), and Dividend Payout Ratio (DPR) simultaneously have a positive and significant effect on stock prices. The F- statistic value is 27.4598 with a significance value of 0.000000, which is smaller than 0.05. According to Effendi M. A. (2016) company value is an indicator of the success of a company which can be seen from the stock price. If the stock price is high, the company value is also high and vice versa. Company value can be seen through the company's performance itself. The performance of banking companies is applied in the form of Loan To Deposit Ratio (LDR), Return On Assets (ROA), and Capital Adequacy Ratio (CAR) which are incorporated in the Risk Based Bank Rating (RBBR) method. If the company's performance is not optimal, then the company will not get maximum profit, so the company is unable to set a high percentage of the Dividend Payout Ratio (DPR), which will have an impact on the stock price of banking companies, because market confidence in the company depends on the company's performance itself (Prastuti & Sudiartha, 2016).
The result of the Path Analysis shows that the direct effect of the Loan To Deposit Ratio (LDR) on the Stock Price (HS) is -34.61461 and it is significant. The indirect effect of the Loan To Deposit Ratio (LDR) to the Stock Price through the Dividend Payout Ratio (DPR) is 19.775624. This figure is obtained from the multiplication of 0.006809 multiplied by 2904.336 and is significant, so the direct effect is smaller than the indirect effect, so it can be concluded that the Dividend Payout Ratio (DPR) is a mediator or acts as an intervening variable of the effect of the Loan To Deposit Ratio (LDR) on Prices. Stock. This does not apply to Return On Assets (ROA) and Capital Adequacy Ratio (CAR) because there is an insignificant effect on stock prices. This is because company liquidity is the main consideration in dividend policy. The higher the Loan To Deposit Ratio (LDR) percentage, the higher the probability of a banking company profit, assuming there is no bad credit or an accumulation of uncollectible accounts. If the profits are high, then the company will be able to set a high Dividend Payout Ratio (DPR), thereby attracting investors to invest in the banking company which has an impact on the high share price of the banking company.
REFERENCES
[1]. Ambarwati, S. D. (2010). Manajemen Keuangan Lanjut Cetakan I. Yogyakarta: Graha ilmu.
[2]. Antara, I. M. (2012). Pengaruh Dividend Payout Ratio, Price To Book Value Dan Price To Earning Ratio Pada Return Saham Di Bursa Efek Indonesia Periode 2009-2011. E-Jurnal Akuntansi, Vol. I, Hal. 1-14.
[3]. Anthony, R. V. (2005). Management Control System Jilid I Dan II Terjemahan Kurniawan Tjakrawala Dan Krista. Jakarta:
Salemba Empat.
[4]. Azis, M. (2012). Manajemen Investasi: Fundamental, Teknikal Prilaku Investor, Dan Return Saham. Yogyakarta: Deepublish.
[5]. Baker, M., & Wurgler, J. (2002). Market Timing and Capital Structure. Journal Of Finance, Vol. 57, Hal. 1-32.
[6]. Basuki, A. T. (2017). Analisis Regresi Dalam Penelitian Ekonomi & Bisnis: Dilengkapi Aplikasi SPSS & EVIEWS. Jakarta: PT.
Raja Grafindo Persada.
[7]. Brigham, & Houston. (2010). Dasar-Dasar Manajemen Keuangan Edisi Empat Belas Buku I. Jakarta: Salemba Empat.
[8]. Brigham, E. d. (2001). Manajemen Keuangan Edisi Kedelapan Buku 2. Jakarta: Erlangga.
[9]. Budiawan. (2008). Analisis Faktor-Faktor Yang Mempengaruhi Penyaluran Kredit Pada Bank Perkreditan Rakyat Studi Kasus Pada BPR Di Wilayah Kerja BI Banjarmasin. Tesis Program Studi Magister Manajemen Universitas Diponegoro Semarang . [10]. Dendawijaya, L. (2000). Manajemen Perbankan. Jakarta: Ghalia Indonesia.
[11]. Dendawijaya, L. (2009). Manajemen Perbankan. Jakarta: Ghalia Indonesia.
[12]. Effendi, F. M. (2018). Pengaruh Return On Assets (ROA) Terhadap Harga Saham Dengan Earning Per Share (EPS) Sebagai Intervening (Studi Kasus Pada Perusahaan Sub Sektor Tekstil Dan Garmen Yang Terdaftar Di Bursa Efek Indonesia Periode 2013 - 2016). Jurnal Administrasi Bisnis, Vol. 7, Hal. 1-9.
[13]. Effendi, M. A. (2016). The Power Of Good Corporate Governance Edisi Kedua. Jakarta: Salemba Empat.
[14]. Eisenhardt, K. (1989). Agency Theory: An Assesment And Review, Academi OF Management Review, 14. Hal. 57-74.
[15]. Fahmi, I. (2015). Pengantar Manajemen Keuangan. Bandung: Alfabeta.
[16]. Fahmi, I. (2012). Pengantar Pasar Modal Edisi Pertama. Bandung: Alfabeta.
[17]. Ghozali, I. (2007). Teori Akuntansi. Semarang: Badan Penerbit Universitas Diponegoro.
[18]. Ghozali, I. (2011). Aplikasi Analisis Multivariat Dengan Program SPSS. Semarang: Badan Penerbit Universitas Diponegoro.
[19]. Hanafi, M. M. (2014). Analisis Laporan Keuangan Edisi Keempat . Yogyakarta: BPFE.
[20]. Hanafi, M. M. (2016). Manajemen Keuangan Edisi Kedua. Yogyakarta: BPFE.
Determinants of Bank Health Level in Indonesia : How does its implications for stock prices ?
DOI: 10.35629/7722-1003024960 www.ijhssi.org 60 | Page
[21]. Horne, V. d. (2007). Fundamentals OF Financial Management, Prinsip-Prinsip Manajemen Keuangan . Jakarta: Salemba Empat.
[22]. Junaeni, I. (2016, Oktober 12). Tingkat Kesehatan Bank Berdasarkan Risiko (Risk Based Bank Rating). Retrieved Januari 2020, from Perbanas Institute Jakarta: https://dosen.perbanas.id/tingkat-kesehatan-bank-berdasarkan-risiko-risk-based-bank-rating-rbbr/
[23]. Karauan, P., Murni, S., & Tulung, J. (2017). Pengaruh Kinerja Keuangan Terhadap Kebijakan Dividen Pada Bank BUMN Yang Go Publik Di Bursa Efek Indonesia Tahun 2011-2015. Jurnal EMBA, Vol. 5, Hal 1-10.
[24]. Kasmir. (2012). Dasar-Dasar Perbankan. Jakarta: PT. Raja Grafindo Persada.
[25]. Kurniawati, S. L., Sari, L. P., & Dewi, H. N. (2012). Faktor Penentu Return Saham Dengan Price To Book Value Sebagai Variabel Moderasi Di Bursa Efek Indonesia. Jurnal Keuangan Perbankan, Vol. 16, Hal. 1-8.
[26]. Manurung, A. H. (2004). Teori Struktur Modal Sebuah Survei. Usahawan , Hal. 1-7.
[27]. Martanorika, N. (2018). Pengaruh Loan To Deposit Ratio (LDR), Non Performing Loan (NPL), Capital Adequacy Ratio (CAR), Net Interest Margin (NIM) Terhadap Harga Saham Bank Umum Konvensional Yang Terdaftar Di Bursa Efek Indonesia Pada Tahun 2014-2016. Jurnal Profita, Vol. 6, Hal. 1-15.
[28]. Meilani, L., & Amboningtyas, D. (2017). Analisis Pengaruh Rasio Likuiditas, Leverage, Dan Profitabilitas Terhadap Dividend Payout Ratio (DPR) Dengan Firm Size Sebagai Variabel Intervening Pada Perusahaan Manufaktur Yang Terdaftar Di Bursa Efek Indonesia Periode 2012-2016. Journal Of Management Universitas Padjajaran, Vol. 3, Hal. 1-9.
[29]. Mudrajat, K., & Suhardjono. (2011). Manajemen Perbankan Teori Dan Aplikasi. Yogyakarta: BPFE.
[30]. Munawir. (2001). Analisa Laporan Keuangan. Yogyakarta: Liberty.
[31]. Norazmi, H. (2014). Signalling Theory. Retrieved Oktober 2019, from Academia:
https://www.academia.edu/3884969/A_Teori_Pesinyalan_Signalling_Theory_Signalling_theory_menekankan_kepada_pentingnya _informasi_yang
[32]. Nugraha, R. D., & Sudaryanto, B. (2016). Analisis Pengaruh DPR, DER, ROE, Dan TATO Terhadap Harga Saham Studi Kasus Pada Perusahaan Industri Dasar Dan Kimia Yang Terdaftar Di BEI Periode 2010-2014. Diponegoro Journal Of Management, Vol.
5, Hal. 1-12.
[33]. Pandia, F. (2012). Manajemen Dana Dan Kesehatan Bank Cetakan Pertama. Jakarta: Rineka Cipta.
[34]. Peraturan Bank Indonesia Nomor 13/1/PBI/2011. (2011). Retrieved November 2019, from Otoritas Jasa Keuangan:
https://www.ojk.go.id/id/kanal/perbankan/regulasi/peraturan-bank-indonesia/Pages/peraturan-bank-indonesia-nomor-13-1-pbi- 2011.aspx
[35]. Peraturan Bank Indonesia Nomor 15/15/PBI. (2013, Desember 24). Retrieved November 2019, from Badan Pemeriksa Keuangan Republik Indonesia: https://peraturan.bpk.go.id/Home/Details/136591/peraturan-bi-no-1515pbi2013-tahun-2013
[36]. Polii, P. J., Saerang, I., & Mandagie, Y. (2014). Rasio Keuangan Pengaruhnya Terhadap Harga Saham Pada Bank Umum Swasta Nasional Devisa Yang Go Publik Di Bursa Efek Indonesia. Jurnal EMBA, Vol. 2, Hal. 1-12.
[37]. Prastuti, N. K., & Sudiartha, I. G. (2016). Pengaruh Struktur Modal, Kebijakan Dividen Dan Ukuran Perusahaan Terhadap Nilai Perusahaan Pada Perusahaan Manufaktur. E-Jurnal Manajemen, Vol. 5, Hal. 1-27.
[38]. Puspitasari, A. D. (2017). Analisis Pengaruh Enterprise Risk Management Disclosure, Intellectual Capital Disclosure, Dan Corporate Social Responsibility Disclosure Terhadap Nilai Perusahaan Studi Empiris Pada Perusahaan Pertambangan Yang Terdaftar Di BEI Tahun 2012-2015. Universitas Lampung.
[39]. Santoso, T. B. (2006). Bank Dan Lembaga Keuangan Lain Edisi Kedua. Jakarta : Salemba Empat.
[40]. Sartono, A. (2001). Manajemen Keuangan Teori Dan Aplikasi. Yogyakarta: BPFE.
[41]. Sartono, A. (2008). Manajemen Keuangan Teori Dan Aplikasi Edisi Keempat. Yogyakarta: BPFE.
[42]. Sarwono, J. (2012). Path Analysis Untuk Riset Skripsi, Tesis, Dan Disertasi. Jakarta: PT. Elex Media Komputindo Kompas Gramedia.
[43]. Sawir, A. (2004). Kebijakan Pendanaan Dan Restrukturisasi Perusahaan. Jakarta: Gramedia Pustaka Utama.
[44]. Scott, W. R. (2009). Financial Accounting Theory Fourth Edition. USA Prentice Hall Inc.
[45]. Siamat, D. (2005). Manajemen Lembaga Keuangan Kebijakan Moneter Dan Perbankan. Jakarta: Fakultas Ekonomi Universitas Indonesia.
[46]. Suad, H. (1998). Dasar-Dasar Teori Portofolio Dan Analisis Sekuritas Edisi Kedua. Yogyakarta: UPP-AMP YKPN.
[47]. Suad, H. (1996). Manajemen Keuangan Teori Dan Penerapan (Keputusan Jangka Panjang) Edisi Keempat. Yogyakarta: BPFE.
[48]. Sudana, I. M. (2011). Manajemen Keuangan Perusahaan Teori Dan Praktik. Jakarta: Erlangga.
[49]. Suhadak, S. M., & Hidayat, R. R. (2015). Pengaruh Beta Pasar Dan Dividend Payout Ratio Terhadap Return Saham Studi Pada Perusahaan Perbankan Yang Terdaftar Di Bursa Efek Indonesia Periode 2010-2013. Jurnal Administrasi Bisnis, Vol. 26, Hal. 1-8.
[50]. Sulhan, M., & Halimah, D. N. (2013). Pengaruh Kinerja Keuangan Perbankan Berdasarkan Analisis CAMELS Terhadap Harga Saham Dengan CSR Sebagai Variabel Intervening Studi Empiris Pada Bursa Efek Indonesia Periode 2008-2011. Jurnal Ekonomi Dan Bisnis Islam, Vol. 9, Hal. 1-13.
[51]. Sunyoto, Y., & Sam'ani. (2014). Pengaruh Capital Adequacy Ratio, Net Interest Margin, Dan Return On Asset Terhadap Harga Saham Pada Perbankan Di BEI Periode 2009-2012. Jurnal Ekonomi Manajemen Dan Akuntansi, Vol. 21, Hal. 1-19.
[52]. Supriyono, R. (2000). Perencanaan Dan Pengendalian Biaya Sert Pembuatan Keputusan Edisi Kedua Buku II. Yogyakarta: BPFE.
[53]. Suwardjono. (2014). Teori Akuntansi Perekayasaan Pelaporan Keuangan Edisi Ketiga . Yogyakarta: BPFE.
[54]. Tandelilin, E. (2010). Pertofolio Dan Investasi Teori Dan Aplikasi Edisi Pertama. Yogyakarta: Kanisius.
[55]. Undang-Undang Republik Indonesia Nomor 8 Tentang Pasar Modal. (1995). Retrieved November 2019, from Otoritas Jasa Keuangan: https://www.ojk.go.id/id/kanal/pasar-modal/regulasi/undang-undang/Documents/Pages/undang-undang-nomor-8-tahun- 1995-tentang-pasar-modal/UU%20Nomor%208%20Tahun%201995%20(official).pdf
[56]. Wahyuni, F. I. (2014). Pengaruh Return On Assets, Capital Adequacy Ratio, BOPO, Loan To Deposit Ratio Terhadap Kebijakan Dividen Pada Perusahaan Perbankan Yang Terdaftar Di BEI. Digital Repository Unila Fakultas Ekonomi Dan Bisnis Universitas Lampung .
[57]. Wardjono. (2010). Analisis Faktor-Faktor Yang Mempengaruhi Price To Book Value Dan Implikasinya Pada Return Saham Studi Kasus Pada Perusahaan Manufaktur Yang Terdaftar Di BEI. Dinamika Keuangan Dan Perbankan, Vol. 2, Hal. 1-14.
[58]. Warsono. (2002). Manajemen Keuangan Perusahaan. Malang: Universitas Muhammadiyah Malang.
[59]. Wibisono, Y. (2007). Membedah Konsep Dan Aplikasi CSR. Gresik: Frescho Publishing.
[60]. Widoatmodjo, S. (2005). Cara Sehat Investasi Pasar Modal. Jakarta: Jurnalindo Aksara Grafika.
[61]. Wijaya, M. E. (2001). Pengujian Empiris Prediksi Pecking Order Theory Dan Trade Off Theory Mengenai Leverage. Tesis Program Pasca Sarjana Manajemen Universitas Gadjah Mada .
[62]. Wulandari, A. I., & Badjra, I. B. (2019). Pengaruh Profitabilitas Terhadap Harga Saham Pada Perusahaan LQ-45 Di Bursa Efek Indonesia (BEI). E-Jurnal Manajemen, Vol. 8, Hal. 1-19.
Determinants of Bank Health Level in Indonesia : How does its
implications for stock prices ?
by Turnitin Instructor
Submission date: 16-Mar-2021 06:46PM (UTC-0700) Submission ID: 1512264238
File name: IJHSSI_Reschiwati_Febri.pdf (437.47K) Word count: 9338
Character count: 50269
35 %
SIMILARITY INDEX
24 %
INTERNET SOURCES
19 %
PUBLICATIONS
21 %
STUDENT PAPERS
1 3 %
2 1 %
3 1 %
4 1 %
5 1 %
6 1 %
Determinants of Bank Health Level in Indonesia : How does its implications for stock prices ?
ORIGINALITY REPORT
PRIMARY SOURCES