DEVELOPING AN ISLAMIC FINANCIAL INCLUSION INDEX FOR ISLAMIC BANKS IN INDONESIA:
A CROSS-PROVINCE ANALYSIS
M. Mahbubi Ali1, Muhammad Rizky Prima Sakti2 and Abrista Devi3
1 International Institute of Advanced Islamic Studies (IAIS), Malaysia, [email protected]
2 Researcher, Islamic Economic Forum for Indonesian Development (ISEFID), Indonesia, [email protected]
3 Ibn Chaldun Bogor University, Indonesia, [email protected]
Keywords: Financial Inclusion, Islamic Banks, Indonesia.
JEL Classification: C33; C54; F43.
Article history:
Received : October 20, 2019 Revised : October 31, 2019 Accepted : November 6, 2019 Available online : December 27, 2019 https://doi.org/10.21098/jimf.v5i4.1098
ABSTRACT
This study measures an Islamic financial inclusion index in Indonesia based on three dimensions, namely the accessibility, availability and usage of Islamic banking services.
Additionally, it measures the relationship between the Islamic financial inclusion index and the human development index (HDI). The study found that the level of Islamic financial inclusion in Indonesia is relatively low at the national level. DKI Jakarta is the most financially inclusive province in Indonesia, followed by East Java and Nanggroe Aceh Darussalam. In contrast, East Nusa Tenggara has the lowest average Islamic financial inclusion index. The findings also revealed a positive correlation between the Islamic financial inclusion index and HDI. Those provinces with the highest Islamic financial inclusion index were also likely to have a higher HDI. The findings of the present study suggest that both policymakers and the Islamic financial industry should play a greater role in improving financial access to low-income segments, especially in the eastern part of Indonesia such as East Nusa Tenggara and Papua provinces.
Acknowledgment: This paper is part of the research project funded by the Central Bank of Indonesia – Bank Indonesia Institute under Resaerch Grandt Bank Indonesia Program 2018.
I. INTRODUCTION 1.1. Background
Since the early 2000s, financial inclusion has been a renewed concern for many governments and central banks. The World Bank’s 2017 Global Findex Database reported that around 1.7 billion people worldwide do not have an account at a financial institution or through a mobile money provider. The United Nations Development Programme (UNDP) is therefore seeking to incorporate improved financial access into its main development agenda as part of the Sustainable Development Goals (SDGs). A plethora of academic evidence confirms that financial inclusion can support the achievement of broader SDGs.
The last two decades have seen exponential growth in Islamic finance, and it has emerged as one of the fastest-growing financial sectors. According to the 2018 Global Islamic Finance Report (GIFR), the global Islamic financial industry was worth US$2.431 trillion in 2017 and registered growth of 6.02%. The industry is expected to surpass US$4 trillion by 2020.
As a business entity established within the scope of Shariah principles, Islamic finance aims to promote economic well-being, help in creating socio-economic justice and serve as a catalyst for development, in line with the spirit of the United Nations Agenda for Sustainable Development. The International Monetary Fund (IMF), in its press release dated May 9, 2018, also acknowledged that “the growth of Islamic finance presents important opportunities to strengthen financial inclusion, deepen financial markets, and mobilise funding for development by offering new modes of finance and attracting ‘unbanked’ populations that have not participated in the financial system.”
Mohieldin, Iqbal, Rostom, and Fu (2011) argued that Islamic finance addresses the issue of financial inclusion from two dimensions: Firstly, by promoting the concept of profit and loss sharing (PLS) or risk-sharing as an alternative to conventional debt-based financing. And secondly, through methods of Islamic social finance such as zakat, wakaf, infaq and qard hasan, which complement the PLS instrument.
Over the last two decades, the Islamic financial market in Indonesia has evolved and developed exponentially, emerging as an important jurisdiction in the global Islamic financial industry. The emergence of the Islamic financial market in Indonesia is now expected to play a more significant role in supporting the financial inclusion agenda through PLS-based products, Islamic micro-initiatives and Islamic social programmes. This is particularly the case as financial inclusion forms an important part of a country’s national agenda to accelerate economic growth, promote equality of income distribution, reduce poverty and achieve financial stability (Hadad, 2010). On the other hand, Indonesia has a relatively low financial inclusion rate compared to other developing countries. The World Bank’s 2017 Global Findex reported that more than half (51.1%) of Indonesian adults are unbanked. Forty-six per cent of men have an account, which is five per cent less than the proportion of women (51%) with an account. What makes this study crucial and timely is, to the best of the researchers’ knowledge, no study has so far been conducted on an Islamic financial inclusion index for the Islamic banking industry in Indonesia, especially at the provincial level. This study is also undertaken with the aim of supporting the country’s aspiration to elevate the
market share of the Islamic financial industry by increasing the level of Islamic financial inclusion. Thus, there is a need to develop an Islamic financial inclusion index in Indonesia.
Against the above background, the present study undertakes to measure the Islamic financial inclusion index in Indonesia. The remainder of the paper is organised as follows. Section 2 contains a literature review pertaining to the financial inclusion index. Section 3 provides the data, operational definitions of the variables and the calculation methods used. Section 4 presents the empirical results and discussion. Section 5 concludes the paper with a set of policy recommendations.
1.2. Objective
Specifically, the present paper aims to achieve the following objectives:
1. To measure the Islamic financial inclusion index in Indonesia based on three dimensions, namely the accessibility, availability and usage of Islamic banking services.
2. To examine the relationship between the Islamic financial inclusion index and HDI.
II. LITERATURE REVIEW 2.1. Background Theory
Financial inclusion is defined as the delivery of financial access to low-income segments of society at an affordable cost (World Bank, 2014). The term low-income segment can be taken as referring to any of “non-banked”, “non-bankable”, “not- have people” or poor people (Allen, Demirguc-Kunt, Klapper, & Peria, 2012;
Kunt & Klapper, 2013; Mohieldin, Iqbal, Rostom, & Fu, 2011). Kimutai (2015) defines financial inclusion as the provision of banking services to the unbanked population by various financial institutions such as banks and microfinance.
Financial inclusion revolves around four dimensions, namely easy access to finance for all households and enterprises, sound financial institutions, financial and institutional sustainability and healthy competition between service providers so that customers have better options (Mohieldin et al., 2011).
Since the early 2000s, financial inclusion has been the focus of renewed concern for many governments and central banks across many jurisdictions. Many embrace financial inclusion as part of their poverty alleviation agenda. A plethora of academic evidence asserts that financial inclusion can have a positive significant impact on individuals, particularly with regard to the use of a bank account. It is argued that having a bank account increases savings (Aportela, 1999), female empowerment (Ashraf et al., 2010) and consumption, as well as the productive investment of entrepreneurs (Dupas & Robinson, 2013). In contrast, the lack of a bank account leads to liquidity management and payment problems, thereby resulting in high fees associated with the use of money orders or cheque-cashing services (Lusardi, 2010). From a broader perspective, lack of access to finance for the low-income segment might trigger their entry into the “poverty trap” as they
do not have the opportunity to save when there is a liquidity excess or to borrow when they have to endure starvation (Mohieldin et al., 2011).
The spirit of financial inclusion corresponds with the philosophical foundation of Islamic finance to realise social justice and the sharing of resources among all.
The IMF, in its press release dated May 9, 2018, acknowledged that “the growth of Islamic finance presents important opportunities to strengthen financial inclusion, deepen financial markets, and mobilise funding for development by offering new modes of finance and attracting ‘unbanked’ populations that have not participated in the financial system”.
Nevertheless, relatively few studies have been conducted to examine the role of Islamic finance in financial inclusion. Hassan (2015) discussed the role of the Islamic microfinance system in India in the context of financial inclusion. According to the author, mainstream microfinance does not accommodate the needs of underserved Muslims in India. The paper summarised several obstacles faced by the mainstream microfinance institutions in improving financial inclusion: (i) high documentation and procedures, (ii) high transaction costs, (iii) inflexibility and delay and (iv) social obligation. The author believes that Islamic microfinance has a substantial role to play in the promotion of financial inclusion. Other research found that Muslim countries have a low proportion of bank accounts (27%), with only 15% of adults in sub-Saharan Africa holding accounts in formal financial institutions (Zulkhibri, 2016). The author argues that the poor in Muslim countries who lack access to financial services will continue to be trapped in poverty.
The importance of a risk-sharing system in improving financial inclusion has been studied by Zulkhibri (2016), Shaikh (2017) and Bongomin, Munene, Ntayi, and Maling (2018). Zulkhibri (2016) studied whether Islamic finance can improve financial inclusion. The author concluded that the features of risk- sharing and redistribution of wealth embedded in Islamic finance can advance financial inclusion through the promotion of microfinance and SME financing.
The promotion of risk-sharing contracts through Islamic microfinance, which are a viable alternative to debt-based financing contracts, can support the economic activity of the poor and needy groups in Muslim countries and thus improve their productivity. This was supported by Hassan (2015), who also noted that the notion of risk-sharing in an Islamic microfinance system could enhance the level of financial inclusion and promote equality. Similarly, Shaikh (2017) cited that the risk-sharing and asset-backed nature of Islamic microfinance institutions can increase the level of financial inclusion.
Mohieldin et al. (2011) argued that Islamic finance addresses the issue of financial inclusion or access to financial services from two dimensions. Firstly, by promoting the concept of profit- and loss-sharing as an alternative to conventional debt-based financing and secondly, through wealth redistribution instruments such as zakat, sadaqah (alms), waqf (endowment fund) and qard hasan (benevolent loan), which complement the PLS instrument within the poverty eradication agenda.
PLS promotes the financial inclusion agenda as it can offer affordable and fair financial access to low-income segments: the imposition of cost and the distribution of profit are based on the actual performance of the business. As a result, the optimum application of PLS will help to create an equitable distribution of
income and wealth among partners or between wealth owners and entrepreneurs, thereby presenting the concept of justice and fairness in financial dealings. Risk transfer underlying the conventional financial system, on the other hand, implies asymmetric exposure to economic risk and does not therefore promote economic justice and financial inclusion. Instead, it serves only to create a continuous transfer of wealth from entrepreneur to wealth owner, irrespective of economic downturns and business performance.
Furthermore, social finance, mandated or otherwise, is an integral part of the Islamic financial system to offer equal opportunity to financial access for low- income segments, i.e. the underserved and poor, “so that it may not (merely) make a circuit between the wealthy among you” (QS 59:7). Islamic social finance instruments help to improve those segments’ financial access via various initiatives and strategies, such as microfinance empowerment, poverty alleviation schemes and educational and entrepreneurship development programmes.
Financial technology (fintech) is the perfect device for reinforcing the role of Islamic finance in promoting the financial inclusion agenda. The use of digital finance, such as blockchain and crowdfunding, can lower transaction costs and minimise asymmetric information. Santander FinTech issued a report in 2015 estimating that blockchain could reduce the transaction costs attributable to cross- border payment, securities trading and regulatory compliance by between US$15 billion (RM62 billion) and US$20 billion per annum by 2022.
Furthermore, blockchain’s ability to transmit and record the ownership of digital assets and immutably store information — where all blockchain participants have access to the same information — might significantly reduce information asymmetries. Fintech can also open up financial access to unbanked individuals.
According to a World Bank estimate, there are approximately 240 million to 334 million people in developing economies that could participate in crowdfunding.
Fintech is also a powerful tool for widening the access to and outreach of Islamic social finance instruments such as zakah, waqf and sadaqah.
2.2. Previous Studies
Traditionally, financial inclusion has been measured as the proportion of the population covered by commercial bank branches and ATMs, the size of deposits and loans by low-income households and SMEs (Mohieldin et al., 2011). Allen, Demirguc-Kunt, Klapper, and Peria (2012) argued that the bank account is the primary indicator of financial inclusion. It can be measured using three indicators:
(i) ownership of an account, (ii) use of the account to save, and (iii) frequent use of the account (defined as three or more withdrawals per month). In a similar vein, Zins and Weill (2016), in their study, used ownership of a bank account, saving in a bank account and the use of bank credit as indicators of financial inclusion. The Global Financial Inclusion Database survey (Kunt & Klapper, 2012) investigated several factors with respect to bank account use, namely: (i) the mechanism of their use (frequency of use and mode of access); (ii) their purpose (receipt of payments from work, government or family); and (iii) barriers to use and alternatives to formal accounts (mobile money).
Furthermore, Naceur, Barajas, and Massara (2015) classified the users of financial services into two, namely household users and firm users. The following indicators were used to measure the extent of household users’ access to finance:
(i) loans from formal financial institutions; (ii) ownership of an account at a formal financial institution; and (iii) religious reasons for not having an account.
Measurement of financial inclusion for the firm was based on the following indicators: (i) the use of a bank for investment; (ii) the use of a bank for working capital; and (iii) access to finance as a significant constraint. Kimutai (2015) used various indicators to measure financial inclusion, namely daily transactions, the number of registered account holders and active account holders.
Kunt and Klapper (2013) concluded that the ownership and use of accounts were the typical financial inclusion indicators used across jurisdictions. The ownership and use of accounts are relatively easy to define and observe, which is particularly true since basic current and savings accounts share relatively common features and characteristics across countries.
Sarma (2012) introduced a method of computing an Index of Financial Inclusion (IFI) to compare the levels of financial inclusion across states or provinces within countries over a particular time period. The method fulfils the assumptions of comparability, mathematical properties and three dimensions (accessibility, availability and the use of a banking service). The indicator of accessibility represents the penetration of formal financial institutions as measured by the total of third-party deposits. The availability variable is indicated by the number of banking branches while the usage dimension includes the volume of credit/financing per total household sector. A similar study was carried out by Sanjaya and Nursechafia (2016), who measured the role of conventional banking in financial inclusion and the level of inclusive growth in Indonesia, while Umar (2017) calculated an Islamic financial inclusion index in Indonesia for Islamic rural banks (BPRS).
The present study develops the Islamic financial index in Indonesia based on the indicators advanced by Sarma (2012). It aims to fill the gap in the existing literature by measuring the Islamic financial inclusion index in Indonesia for Islamic commercial banks (BUS) and Islamic business units (UUS) based on three dimensions, namely accessibility, availability and the use of Islamic banking products and services. This study differs from that by Umar (2017) who only used Islamic rural banks as the sampling in the measurement of Islamic financial inclusion in Indonesia. It also differs from the study by Sanjaya and Nursechafia (2016), who measured the financial inclusion index based on conventional banks.
III. RESEARCH METHODOLOGY 3.1. Data
In developing the Islamic financial inclusion index, this research employs Islamic banking information and several macroeconomic indicators from across w Indonesia for the period 2014 to 2017. The information pertaining to third-party funds, total financing and the total branches of Islamic banks across 33 provinces were retrieved from the Financial Services Authority of Indonesia (OJK). The total population and regional gross domestic product (GDP regional) data were
obtained from the Central Bureau of Statistics (Indonesia). To analyse the data, we use Stata 13.0 and Microsoft Excel. Referring to Sarma (2012), we use three dimensions in measuring the Islamic financial inclusion index, namely accessibility (D1), availability (D2) and usage (D3). We also analyse the relationship between the Islamic financial inclusion index and the human development index (HDI) across 33 provinces. The HDI information was retrieved from the Central Bureau of Statistics of Indonesia. To provide a complete picture of the variables or proxies used in this study, Table 1 below contains the operational definitions of each variable.
Table 1.
Operational definitions of the Islamic Financial Inclusion Index and Human Development Index (HDI)
No Variable Description Calculation
Measurement of Islamic Financial Inclusion Index 1 Accessibility (D1)
The accessibility dimension measures
the level of Islamic banking penetration to
low-income people.
2 Availability (D2)
This dimension measures the level of availability of Islamic banking services for
use by low-income people.
3 Usage (D3)
This dimension measures the extent to which Islamic banking products and services can satisfy customers’
needs, i.e. the need for Islamic financing.
4 Islamic financial
inclusion index D1 + D2 + D3
5 Human
development index
A statistical tool for measuring overall achievement across key social and economic dimensions. The HDI ratio across 33 provinces in Indonesia,
retrieved from the Central Bureau of Statistics (Indonesia).
Source: adopted from Sarma (2012)
3.2. Model Development and Method
The Islamic financial inclusion index is constructed based on three dimensions, namely: (i) accessibility, (ii) availability and (iii) usage. The first dimension of accessibility (D1) reflects the level of penetration of Islamic banking institutions.
The availability dimension (D2) is measured by the number of Islamic banking branches. The usage dimension (D3) indicates the total Islamic banking financing
per total GDP regional. The equation below formulates the financial inclusion dimensions:
where:
wi = weight attached to dimension i Ai = actual value of dimension i
mi = lower limit on the value of dimension i Mi = upper limit on the value of dimension i
Following Sarma’s (2012) method, this study applies equal weight to each dimension (wi = 1). According to Sarma (2012), all dimensions share the same level of significance; therefore, we use a weighted value wi = 1 for all i. If a dimension has a value close to wi, this indicates an area with the highest achievement across all dimensions. As for the upper and lower limits (Mi and mi), since there are no outlier results in the case of Islamic banking in Indonesia, the point Mi represents the maximum value from the available data, while mi represents the minimum value.
Next, we calculate the values of X1 and X2.WhileX1 gives the normalised Euclidean distance of X from the worst point 0, X2 shows the normalised Euclidean distance of X from the ideal point of w. The formulas for X1 and X2 are
Eq. (1)
Eq. (2)
Eq. (3)
Eq. (4) shown in Equations 2 and 3, respectively.
The simple average of X1 and X2 is shown in Equation 4 below.
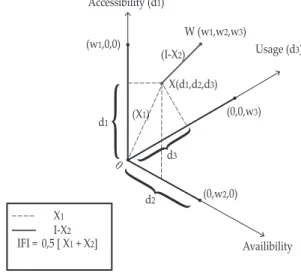
The index value of each dimension ranges between 0 and wi. A higher value of di indicates a more ideal point of dimension i. Point X = (d1, d2, d3) represents the achievement of financial inclusion for each province in Indonesia, while
Point O = (0, 0, 0) indicates the worst situation. The most ideal situation for all dimensions is represented by point W = (w1, w2, w3). Figure 1 below contains a three- dimensional graph of the three aspects of the Islamic financial inclusion index.
The final step is to calculate the financial inclusion index using the formula in Equation 5 below. The financial inclusion index formula is obtained by taking the average value of X1 and X2, which represents the position between the worst and the ideal point.
Figure 1. A Three-dimensional view of the Islamic Financial Inclusion Index Accessibility (d1)
Availibility W (w1,w2,w3) (w1,0,0)
(I-X2)
I-X2
IFI =
d1
d2
X(d1,d2,d3)
Usage (d3)
(0,0,w3)
(0,w2,0)
0,5 [ X1 + X2]
(X1)
X1
{
0 d3{ {
Source: adopted from Sarma (2012)
Subsequently, the following Equation 6 formulates the estimation model for the relationship between IFI and HDI based on Pearson’s correlation coefficient:
Eq. (5)
Eq. (6)
r = Pearson’s correlation coefficient N = Number of paired scores ƩXY = Sum of paired scores ƩX = Sum of x scores ƩY = Sum of y scores
ƩX2 = Sum of squared x scores ƩY2 = Sum of squared y scores Source: Chee, 2015
IV. RESULTS AND ANALYSIS
This section presents the empirical findings of the study with the following focus:
(i) measuring the three dimensions of Islamic financial inclusion at the national and provincial levels, (ii) calculating the Islamic financial inclusion index and analysing it across the provincial level, and (iii) analysing the relationships between the Islamic financial inclusion index and HDI across provinces.
4.1. Descriptive Statistics of the Three Dimensions of Islamic Financial Inclusion Table 2 contains the descriptive statistics of the three dimensions of Islamic financial inclusion across the 33 provinces in Indonesia. The table presents various statistical indicators, comprising minimum (min), maximum (max), average (mean) and standard deviation (std. dev). At first glance, we notice that the average values of the three dimensions of Islamic financial inclusion (accessibility, availability and usage) vary across the observed study period (2014–2017).
Table 2.
Descriptive Statistics of Islamic Financial Inclusion on Three Dimensions Accessibility (D1)
Stat. 2014 2015 2016 2017 Average
Min 0.026 0.028 0.025 0.027 0.025
Max 11.530 11.138 13.238 15.925 15.925
Mean 0.918 0.901 1.107 1.312 1.060
Std. Dev. 2.121 2.052 2.437 2.948 2.394
Availability (D2)
Stat. 2014 2015 2016 2017 Average
Min 0.102 0.096 0.094 0.094 0.094
Max 8.161 7.067 6.469 6.387 8.161
Mean 1.358 1.143 1.105 1.099 1.176
Std. Dev. 1.454 1.257 1.225 1.215 1.281
Usage (D3)
Stat. 2014 2015 2016 2017 Average
Min 1.888 1.655 1.338 1.082 1.082
Max 59.664 61.174 113.286 115.665 115.665
Mean 18.177 17.610 21.102 22.604 19.9
Std. Dev. 12.541 12.823 21.240 22.323 17.742
Source: Author’s Calculation (2018)
20 15 10 5 0
Accessibility Dimension (D1)
Bali Bangka Belitung Banten Bemgkulu Central Java Central Kalimantan Central Sulawesi DI Yogyakarta DKI Jakarta East Java East Kalimantan East Nusa Tenggara Gorontalo jambi Lampung Maluku Nanggroe Aceh Darusalam
North Maluku North Sulaw
esi North Sumatera
Papua Riau
Riau Islands Sout East Sulawesi South Kalimantan South Sulawesi
South Sumatera W
est Sulawesi West Java West Kalimantan West Nusa Tenggara West Papua West Sumatera
2014 2015 2016 2017 Source: Author’s Calculation (2018)
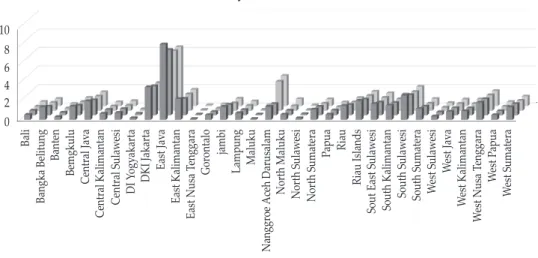
In terms of accessibility (D1), Table 2 indicates that there was a gradual increase in the average value of third-party funds of Islamic banks (including Islamic commercial banks and Islamic business units) from IDR 918 million in 2014 to IDR 1.31 billion in 2017. From 2014 to 2017, the mean value of third-party funds per 1,000 people was IDR 1.06 billion. Looking at the third-party funds of Islamic banks across provinces, DKI Jakarta appears to have the highest third-party funds of Islamic banks among all the provinces in Indonesia, followed by East Java (see Figure 1). As a comparison, DKI Jakarta has average third-party funds of IDR 12.95 billion per 1,000 people, while the figure for East Java is IDR 5.96 billion per 1,000 people. Meanwhile, North Sulawesi records the lowest figure on the accessibility level, with IDR 27 million per 1,000 people.
With regard to the availability dimension (D2), the average Islamic banking penetration per 100,000 people is 1.17 units. This is based on the notion that one (1) Islamic banking institution can serve 100,000 people in Indonesia. Needless to say, there is very low availability of Islamic banking services to meet the demand of customers. As indicated earlier, the availability dimension is measured by the total distribution of Islamic banking networks, including the operational head office, branch offices, sub-branch offices, shariah services units and cash offices.
Looking at the province level, East Java appears to have the highest Islamic banking penetration of 7.02 units per 100,000 people, followed by DKI Jakarta and Nanggroe Aceh Darussalam, with average Islamic banking penetration values of 3.13 units and 2.27 units per 100,000 people, respectively (see Figure 2). The average availability dimension of those provinces exceeds the overall average values of Islamic banking penetration by a significant degree.
Figure 2.
Accessibility Dimension (D1) across 33 Provinces in Indonesia
10 8 6 4 2 0
Availability Dimension (D2)
Bali Bangka Belitung Banten Bemgkulu Central Java Central Kalimantan Central Sulawesi DI Yogyakarta DKI Jakarta East Java East Kalimantan East Nusa Tenggara Gorontalo jambi Lampung Maluku Nanggroe Aceh Darusalam
North Maluku North Sulaw
esi North Sumatera
Papua Riau
Riau Islands Sout East Sulawesi South Kalimantan South Sulawesi
South Sumatera West Sulawesi West Java West Kalimantan West Nusa Tenggara West Papua West Sumatera
2014 2015 2016 2017
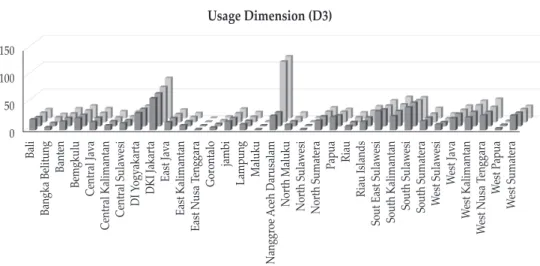
As for the usage dimension (D3), the proportion of Islamic bank financing to GDP regional (PDRB) had an average value of IDR 19.9 billion during the period 2014–2017. The proportion of Islamic bank financing covers the total financing of Islamic commercial banks, Islamic business units and Islamic rural banks. The usage dimension (D3) measures the extent to which Islamic banking institutions can provide various products to their customers, such as financing facilities, deposits, remittances, transfer and others. Also, we notice a variation in terms of the use of Islamic banking services among the 33 provinces in Indonesia.
The result from Figure 3 reveals that the average value of Islamic banking financing to GDP regional ranges between 1.54 and 70.46. Typically, Nanggroe Aceh Darussalam appears to have the highest usage of Islamic banking services with average financing of IDR 70.46 billion from 2014 to 2017, followed by DKI Jakarta and South Sulawesi with average financing of IDR 65.52 billion and IDR 41.74 billion in the period 2014–2017, respectively. East Nusa Tenggara, meanwhile, has the lowest usage of Islamic banking services with average financing of IDR 1.54 billion from 2014 to 2017. It is important to note that the conversion of Bank Aceh to a full-fledged shari’ah-compliant bank in 2016 has significantly increased the amount of Islamic banking financing in Nanggore Aceh Darussalam. Accordingly, the usage of Islamic banking services for Aceh province in 2016 showed a more than fourfold increase over that of the preceding year (2015).
Figure 3. Availability Dimension (D2) across 33 Provinces in Indonesia
Source: author’s calculation (2018)
4.2. The Islamic Financial Inclusion Index
Having discussed the descriptive statistics pertaining to the three dimensions of Islamic financial inclusion, this sub-section deals with the development of an index of Islamic financial inclusion. Table 3 below contains the minimum value (min), maximum (max), average (mean) and standard deviation (std. dev.) of each component in the Islamic financial inclusion index.
Figure 4. Usage Dimension (D3) across 33 Provinces in Indonesia
Source: author’s calculation (2018)
Table 3.
Descriptive Statistics of the Islamic Financial Inclusion Index Accessibility Index (d1)
Stat. 2014 2015 2016 2017 Average
Min 0.000 0.000 0.000 0.000 0.000
Max 0.724 0.699 0.831 1.000 1.000
Mean 0.056 0.055 0.068 0.081 0.065
Std. Dev. 0.133 0.129 0.153 0.185 0.151
Availability Index (d2)
Stat. 2014 2015 2016 2017 Average
Min 0.001 0.000 0.000 0.000 0.000
Max 1.000 0.864 0.790 0.780 1.000
Mean 0.157 0.130 0.125 0.125 0.134
Std. Dev. 0.180 0.156 0.152 0.151 0.159
Usage Index (d3)
Stat. 2014 2015 2016 2017 Average
Min 0.007 0.005 0.002 0.000 0.000
Max 0.511 0.524 0.979 1.000 1.000
Mean 0.149 0.144 0.175 0.188 0.164
Std. Dev. 0.109 0.112 0.185 0.195 0.155
Source: author’s calculation (2018)
Bali Bangka Belitung Banten Bemgkulu Central Java Central Kalimantan Central Sulawesi DI Yogyakarta DKI Jakarta East Java East Kalimantan East Nusa Tenggara Gorontalo jambi Lampung Maluku Nanggroe Aceh Darusalam
North Maluku North Sulaw
esi North Sumatera
Papua Riau
Riau Islands Sout East Sulawesi South Kalimantan South Sulawesi
South Sumatera W
est Sulawesi West Java West Kalimantan West Nusa Tenggara West Papua West Sumatera
150 100 50 0
2014 2015 2016 2017 Usage Dimension (D3)
Based on Table 3, the study finds that the usage index (D3) has the highest average value of 0.164 during the period 2014–2017, followed by the availability (D2) and accessibility index (D1) with average values of 0.134 and 0.065, respectively. These results indicate that the usage and availability dimensions play a crucial role as the determinants of Islamic financial inclusion in Indonesia. The highest average figure for the usage dimension also reveals that Islamic banking institutions in Indonesia performed well in channelling their financing to their customers. As financial intermediaries, Islamic banks provide numerous products to their customers, including financing facilities, deposits, remittances, transfer, etc. In contrast, the lowest average values are seen for the accessibility dimension of Islamic banks, suggesting that accessibility is the least important dimension in affecting the level of Islamic financial inclusion.
According to past studies (Allen et al., 2012; Beck et al., 2008; Sarma, 2012), the distance to access banking services has led to people being financially excluded.
Great distances between people and bank branches, especially in rural areas, serve as the main obstacle to financial access. Providing financial services to consumers living in rural areas is one of the main challenges facing Islamic financial institutions due to the inadequate infrastructure, low levels of IT development and regulatory restrictions on the geographical expansion of bank branches (Zulkhibri, 2016). This results in a situation where customers do not have access to a full set of Islamic banking services in a convenient manner. On this basis, the average level of the Islamic financial inclusion index from the accessibility dimension (D1) in Indonesia is relatively low, at only 0.065 (see Table 3).
Furthermore, the study observes an unequal distribution of the third-party funds of Islamic banks across the 33 provinces studied (see Figure 4). The level of third-party funds of Islamic banking in the eastern part of Indonesia is significantly lower than that in the western part. Specifically, provinces on Java island such as DKI Jakarta, West Java and East Java had the highest average third-party funds from 2014 to 2017, at IDR 130 trillion, IDR 28 trillion and IDR 21 trillion, respectively. On the other hand, East Nusa Tenggara, West Sulawesi and Gorontalo recorded the lowest average third-party funds, with only IDR 123 billion, IDR 170 billion and IDR 216 billion, respectively.
2014 2015 2016 2017 200000
150000 100000 50000 0
Third Party Funds Of Islamic Banks
Bali Bangka Belitung Banten Bemgkulu Central Java Central Kalimantan Central Sulawesi DI Yogyakarta DKI Jakarta East Java East Kalimantan East Nusa Tenggara Gorontalo jambi Lampung Maluku Nanggroe Aceh Darusalam
North Maluku North Sulaw
esi North Sumatera
Papua Riau
Riau Islands Sout East Sulawesi South Kalimantan South Sulawesi
South Sumatera West Sulawesi West Java West Kalimantan West Nusa Tenggara West Papua West Sumatera
Figure 5.
Third Party Funds (DPK) of Islamic banks across 33 Provinces in Indonesia
In a similar vein, the result reveals that the distribution of Islamic bank branches is highly concentrated on Java island (particularly in West Java, DKI Jakarta and East Java) (see Figure 5). Other provinces, particularly in the eastern part of Indonesia, have a relatively low number of Islamic bank branches. It is therefore more challenging for Islamic financial services to penetrate to the eastern part of Indonesia due to the lack of supporting infrastructure and the long distances between communities and bank branches.
Source: Financial Services Authority of Indonesia (2018)
Source: Financial Services Authority of Indonesia (2018)
2014 2015 2016 2017 400
300 200 100 0
Total Branches of Islamic Commercial Banks & Islamic Business Unit
Bali Bangka Belitung Banten
Bemgkulu Central Jav
a Central Kalimantan Central Sulawesi DI Yogyakarta DKI Jakarta East Java East Kalimantan East Nusa T
enggara Gorontalo jambi
Lampung Maluku
Nanggroe Aceh Darusalam
North Maluku North Sulaw
esi North Sumatera
Papua Riau
Riau Islands Sout East Sulawesi South Kalimantan South Sulawesi
South Sumatera West Sulawesi West Java West Kalimantan West Nusa Tenggara West Papua West Sumatera
Figure 6. The Distribution of Islamic Commercial Banks and Islamic Business Units across 33 Provinces in Indonesia
More importantly, the crux of the Islamic financial inclusion index is shown in Table 4 and Figure 6 below, respectively. Overall, the study discovers that the total average Islamic financial inclusion index in Indonesia from 2014 to 2017 was very low, at only 0.127. Accordingly, most Indonesian provinces have a low level of Islamic financial inclusion index, especially in the eastern part of Indonesia.
Nevertheless, there was a positive move in the Islamic financial inclusion index during the period 2014–2017, shifting from 0.128 in 2014 to 0.136 in 2017. This finding, to a significant extent, confirms the latest report by the Global Financial Inclusion Index (World Bank, 2018) that Indonesia was the most progressive country in terms of its financial inclusion agenda across East Asia and the Pacific region over the past three years. The World Bank (2018), in its report, also acknowledged that Indonesia saw the biggest increase in account ownership in the East Asia and Pacific region.
Table 4.
Index of Islamic Financial Inclusion across 33 Provinces in Indonesia Index of Islamic Financial Inclusion in Indonesia
Provinces 2014 2015 2016 2017 Average
Bali 0.088 0.075 0.077 0.076 0.079
Bangka Belitung 0.081 0.059 0.066 0.060 0.067
Banten 0.068 0.063 0.066 0.076 0.068
Bengkulu 0.134 0.113 0.113 0.117 0.119
Central Java 0.149 0.133 0.138 0.144 0.141
Central Kalimantan 0.055 0.053 0.047 0.061 0.054
Central Sulawesi 0.073 0.063 0.057 0.063 0.064
DI Yogyakarta 0.122 0.123 0.119 0.130 0.124
DKI Jakarta 0.552 0.533 0.580 0.643 0.577
East Java 0.491 0.450 0.436 0.459 0.459
East Kalimantan 0.149 0.124 0.126 0.129 0.132
East Nusa Tenggara 0.004 0.002 0.001 0.000 0.002
Gorontalo 0.034 0.024 0.017 0.014 0.022
Jambi 0.113 0.097 0.089 0.094 0.098
Lampung 0.065 0.055 0.055 0.058 0.058
Maluku 0.004 0.003 0.004 0.006 0.004
Nanggroe Aceh Darussalam 0.152 0.144 0.517 0.543 0.339
North Maluku 0.056 0.050 0.049 0.067 0.056
North Sulawesi 0.008 0.004 0.002 0.002 0.004
North Sumatera 0.108 0.102 0.103 0.106 0.105
Papua 0.110 0.091 0.085 0.077 0.091
Riau 0.099 0.079 0.075 0.080 0.083
Riau Islands 0.152 0.133 0.150 0.149 0.146
South East Sulawesi 0.189 0.163 0.163 0.172 0.172
South Kalimantan 0.158 0.155 0.169 0.198 0.170
South Sulawesi 0.257 0.247 0.232 0.230 0.242
South Sumatera 0.109 0.094 0.087 0.101 0.098
West Sulawesi 0.049 0.036 0.035 0.041 0.040
West Java 0.113 0.113 0.113 0.115 0.113
West Kalimantan 0.119 0.122 0.141 0.146 0.132
West Nusa Tenggara 0.171 0.163 0.167 0.193 0.173
West Papua 0.034 0.028 0.029 0.028 0.030
West Sumatera 0.150 0.136 0.130 0.125 0.135
Average Total 0.128 0.116 0.128 0.136 0.127
Source: author’s calculation (2018)
As for the Islamic financial inclusion index at the province level, DKI Jakarta recorded the highest average Islamic financial inclusion index for 2014–2017, at 0.577. During that period, DKI Jakarta recorded the greatest increase in Islamic financial inclusion, moving from 0.552 in 2014 to 0.643 in 2017. East Java and Nanggroe Aceh Darussalam occupied the second and third ranks of Islamic financial inclusion with average values of 0.459 and 0.339, respectively. Apparently, East Java was able to occupy the second position in the Islamic financial inclusion index due to it having the highest Islamic banking penetration per 100,000 people (see Figure 2). Meanwhile, as argued earlier, the conversion of Bank Aceh into a full-fledged shari’ah-compliant bank in 2016 led to a remarkable increase in the Islamic financial inclusion index score in Nanggore Aceh Darussalam. In contrast, East Nusa Tenggara had the lowest average Islamic financial inclusion index score, at only 0.002. This was mainly due to it registering the lowest Islamic banking penetration and usage of Islamic banking services in the province. Figure 6 exhibits the top 10 rankings for the Islamic financial inclusion index in Indonesia.
Figure 7.
Top 10 Index of Islamic Financial Inclusion in Indonesia Top 10 of Index of Islamic Financial Inclusion
0.7
0 0.1 0.2 0.3 0.4 0.5 0.6
Central Java DKI Jakarta East Java Nanggroe Aceh Darusalam Riau Islands South East Sulawesi Suoth Kalimantan South Sulawesi West Nusa Tenggara West Sumatera
2014 2015 2016 2017 Source: author’s calculation (2018)
4.3. The Islamic Financial Inclusion Index and Human Development Index The following sub-section investigates the correlation between the Islamic financial inclusion index and HDI across 33 provinces in Indonesia. Information pertaining to the HDI was retrieved from the Central Bureau of Statistics (Indonesia). Table 5 depicts the distribution of HDI across the 33 provinces from 2014 to 2017.
Table 5.
Human Development Index across 33 Provinces in Indonesia Human Development Index in Indonesia
Provinces 2014 2015 2016 2017 Average
Bali 72.48 73.27 73.65 74.30 73.43
Bangka Belitung 68.27 69.05 69.55 69.99 69.22
Banten 69.89 70.27 70.96 71.42 70.64
Bengkulu 68.06 68.59 69.33 69.95 68.98
Central Java 68.78 69.49 69.98 70.52 69.69
Central Kalimantan 67.77 68.53 69.13 69.79 68.81
Central Sulawesi 66.43 66.76 67.47 68.11 67.19
DI Yogyakarta 76.81 77.59 78.38 78.89 77.92
DKI Jakarta 78.39 78.99 79.60 80.06 79.26
East Java 68.14 68.95 69.74 70.27 69.28
East Kalimantan 73.82 74.17 74.59 75.12 74.43
East Nusa Tenggara 62.26 62.67 63.13 63.73 62.95
Gorontalo 65.17 65.86 66.29 67.01 66.08
Jambi 68.24 68.89 69.62 69.99 69.19
Lampung 66.42 66.95 67.65 68.25 67.32
Maluku 66.74 67.05 67.60 68.19 67.40
Nanggroe Aceh Darussalam 68.81 69.45 70.00 70.60 69.72
North Maluku 65.18 65.91 66.63 67.20 66.23
North Sulawesi 69.96 70.39 71.05 71.66 70.77
North Sumatera 68.87 69.51 70.00 70.57 69.74
Papua 56.75 57.25 58.05 59.09 57.79
Riau 70.33 70.84 71.20 71.79 71.04
Riau Islands 73.40 73.75 73.99 74.45 73.90
South East Sulawesi 68.07 68.75 69.31 69.86 69.00
South Kalimantan 67.63 68.38 69.05 69.65 68.68
South Sulawesi 68.49 69.15 69.76 70.34 69.44
South Sumatera 66.75 67.46 68.24 68.86 67.83
West Sulawesi 62.24 62.96 63.60 64.30 63.28
West Java 68.80 69.50 70.05 70.69 69.76
West Kalimantan 64.89 65.59 65.88 66.26 65.66
West Nusa Tenggara 64.31 65.19 65.81 66.58 65.47
West Papua 61.28 61.73 62.21 62.99 62.05
West Sumatera 69.36 69.98 70.73 71.24 70.33
Average Total 67.96 68.57 69.16 69.75 68.86
Source: Indonesia Statistic Bureau (2018)
Consistent with the findings for the Islamic financial inclusion index, DKI Jakarta is the leader in human development progress among other provinces in Indonesia. This is plausible since Jakarta, as the capital of Indonesia, has a more comprehensive infrastructure, a better education system and adequate healthcare facilities. On average, DKI Jakarta recorded an HDI of 79.26 during the period 2014–2017. In contrast, Papua had the lowest average HDI at only 57.79. Although
the government has paid serious attention to the development of infrastructure projects in Papua, its HDI level remains far behind that of Java island.
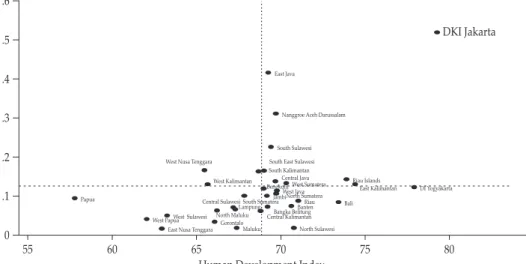
Looking at the Pearson’s correlation and scatter plot in Table 6, we can infer that the Islamic financial inclusion index is significant, displaying a positive correlation with the HDI. The correlation coefficient of 0.4332 significant at the 10% level shows a positive correlation between the two indexes. In other words, the high level of Islamic financial inclusion leads to an increase in the level of human development capacities. Provinces with high scores on the Islamic financial inclusion index are likely to have higher HDI. As shown in Figure 7, DKI Jakarta, East Java and Nanggroe Aceh Darussalam, which together make up the top 3 for Islamic financial inclusion, are likely to have a better HDI. This finding suggests that the presence of Islamic banks in Indonesia contributes positively to economic growth, promotes better access to education and increases the standard of living.
Table 6.
Pairwise Correlation
IFI HDI
IFI 1
HDI 0.4332* 1
Figure 7. Scatter Plot of IFI Index and HDI across 33 Provinces in Indonesia
West Java Banten
DKI Jakarta
DI Yogyakarta Central Java
East Java
Bengkulu Jambi
Nanggroe Aceh Darussalam
North Sumatera West Sumatera
Riau South Sumatera
Bangka Belitung
Riau Islands
Lampung South Kalimantan West Kalimantan
East Kalimantan
Central Kalimantan Central Sulawesi
South Sulawesi
North Sulawesi Gorontalo
West Sulawesi
South East Sulawesi West Nusa Tenggara
Bali
East Nusa Tenggara Maluku Papua
North Maluku West Papua
0 .1 .2 .3 .4 .5
.6 Index of Islamic Financial Inclusion
55 60 65 70 75 80 85
Human Development Index Source: author’s calculation (2018)
V CONCLUSION AND RECOMMENDATIONS 5.1. Conclusion
This study has measured Islamic financial inclusion in Indonesia based on the three dimensions of accessibility, availability and usage of Islamic banking services. Overall, the study concludes that the level of Islamic financial inclusion in Indonesia remains low, particularly in the eastern part of the country, although the trend over the period of the study showed a positive increase. The measurement of the Islamic financial inclusion index across the 33 provinces also indicates that DKI Jakarta had the highest average score with respect to Islamic financial inclusion, followed by East Java and Nanggroe Aceh Darussalam. In contrast, East Nusa Tenggara had the lowest average score on the Islamic financial inclusion index.
In particular, there was a gradual uptrend in the accessibility aspect from 2014 to 2017, as reflected by the average values of third-party funds of Islamic banks (Islamic commercial banks and Islamic business units). Here, DKI Jakarta had the highest rank for accessibility, followed by the East Java region. In contrast, North Sulawesi was the region with the lowest level of accessibility. In terms of the availability dimension, the study reveals that, on average, there is one (1) Islamic banking institution to serve up to 100,000 people in Indonesia. East Java appears to have the highest Islamic banking penetration level, followed by DKI Jakarta and Nanggroe Aceh Darussalam. As for the usage dimension, there was variation among the 33 provinces in Indonesia in terms of the use of Islamic banking services. Nanggroe Aceh Darussalam recorded the highest usage of Islamic banking services, followed by DKI Jakarta and South Sulawesi. On the other hand, East Nusa Tenggara saw the lowest usage of Islamic banking services.
On the whole, the study found that both the usage and availability dimensions played a more instrumental role in Islamic financial inclusion in Indonesia than the accessibility aspect.
The study also found that the Islamic financial inclusion index has a positive correlation with the HDI. The correlation coefficient of 0.4332 significant at the 10%
level signifies a positive correlation between the two indexes. In other words, the high level of Islamic financial inclusion leads to an increase in the level of human development capacities. Provinces with a high score on the Islamic financial inclusion index are likely to have higher HDI. In this regard, DKI Jakarta leads in human development progress among other provinces in Indonesia. In contrast, Papua has the lowest average HDI.
5.2. Recommendations
The findings of the study suggest the following:
1. The government should pay serious attention to increasing the usage and availability aspects of Islamic financial inclusion, especially in the eastern part of Indonesia, such as East Nusa Tenggara and Papua, through supportive regulation and infrastructure.
2. The government should also provide a conducive legal and regulatory framework, such as incentives, to create a level playing field for the Islamic financial industry in support of the country’s financial inclusion agenda.
3. The government should consider Islamic finance as the main engine for
developing the country’s economy, increasing wealth and prosperity and promoting better access to education. This is particularly true given the positive correlation between the IFI and HDI.
4. The Islamic financial industry should play a greater role in improving financial access for the low-income segment by providing adequate supporting infrastructure so that services can be easily accessed by all, including the underserved and poor.
5. Further empirical research using primary data is needed in order to develop a better understanding and a more objective measurement of the financial inclusion index in Indonesia. The use of other analytical tools such as Structural Equation Modelling (SEM) and Analytic Network Process (ANP) will provide more input to the regulators and IFIs for use in formulating appropriate policies and strategies aimed at enhancing the level of financial inclusion in Indonesia.
REFERENCES
Allen, F., Demirguc-Kunt, A., Klapper, L, & Peria, M. S. M. (2012). The Foundations of Financial Inclusion: Understanding Ownership and use of Formal Accounts. Policy Research Working Paper 6290. The World Bank Development Research Group Finance and Private Sector Development Team.
Bongomin, G. O. C., Munene, J. C., Ntayi, J. M., & Maling, C. A. (2018). Nexus between Financial Literacy and Financial Inclusion: Examining the Moderating Role of Cognition from a Developing Country Perspective. International Journal of Bank Marketing, 36(7), 1190-1212.
Chee, J. (2015). Pearson’s Product Moment Correlation: Sample Analysis. University of Hawaii at Mānoa School of Nursing.
Dupas, P., & Robinson, J. (2013). Savings Constraints and Microenterprise Development: Evidence from a Field Experiment in Kenya. American Economic Journal: Applied Economics, 5(1), 163-192.
Kimutai, B. J. (2015). Factors Influencing Financial Inclusion in Rural Kenya: A case Study of Kenya Commercial Bank Agent Outlets in Marakwet West Sub County.
(Unpublished master’s thesis). University of Nairobi, Kenya.
Kunt, A. D., & Klapper, L. (2012). Measuring Financial Inclusion: The Global Findex Database. Policy Research Working Paper. The World Bank Development Research Group. Finance and Private Sector Development Team, April 2012.
Kunt, A. D., & Klapper, L. (2013). Measuring Financial Inclusion: Explaining Variation in Use of Financial Services across and within Countries. Brookings Papers on Economic Activity, Spring 2013.
Mohieldin, M., Iqbal, Z., Rostom, A., & Fu, X. (2011). The role of Islamic Finance in Enhancing Financial Inclusion in Organization of Islamic Cooperation (OIC) Countries. Policy Research Working Paper 5920. The World Bank Development Research Group. Finance and Private Sector Development Team, December 2011.
Naceur, S. B., Barajas, A., & Massara, A. (2015). Can Islamic Banking increase Financial Inclusion? IMF Working Paper WP/15/31, February 2015.
Sanjaya, I., & Nursechafia (2016). Keuangan inklusif dan Pertumbuhan Inklusif:
Analisis Antar Provinsi di Indonesia. Buletin Ekonomi Moneter dan Perbankan, 18(3).
Sarma, M. (2012). Index of Financial Inclusion – A Measure of Financial Sector Inclusiveness. Berlin Working Papers on Money, Finance, Trade and Development, No.7, p.1-34.
Umar, A. (2017). Index of Syariah Financial Inclusion in Indonesia. Buletin Ekonomi Moneter dan Perbankan, 20(1).
Zins, A., & Weill, L. (2016). The Determinants of Financial Inclusion in Africa.
Review of Development Finance, 6, 46-57.