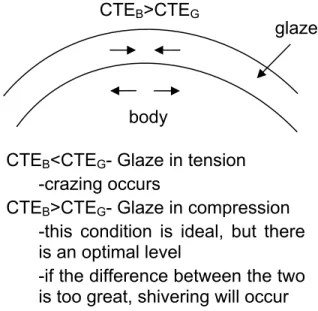
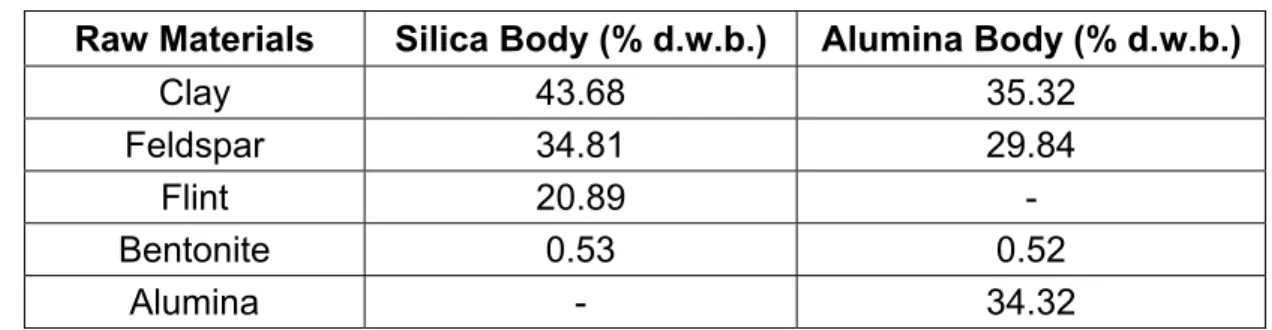
Glaze thickness and glaze composition were systematically varied to study their effects on the mechanical strength of two commercial porcelain bodies, an aluminum body and a silica body. The present work examined the effects of glaze thickness and thermal expansion mismatch between body and glaze, through systematic variations of the amount of silica in the glaze, on the mechanical strength of commercial porcelain bodies.
Literature Review
- Coatings & Strength
- Role of Glaze Oxides
- Glaze/Body Interactions
- Fractography of Whitewares
- Mist/Velocity Hackle, Mirrors, and Fracture Origins
- Wallner Lines
- Hackle
- Previous Fractography Findings of Glazed Whitewares
- Fracture Mechanics
- Weibull Statistics
Feinberg7 varied the amount of CaO in the glaze to change the thermal expansion of the glaze, and thus different levels of glaze compression. The thermal expansion of the glaze will actually increase significantly in the presence of undissolved quartz particles.
Initial Glaze Studies
Glaze Matrix
Pyrometric-Cone-Equivalent (PCE) Test
Measurement of Coefficient of Thermal Expansion (CTE)
A non-contact laser dilatometer (Experimental Model, Orton, Inc., Westerville, OH) was also used to verify the results. The main advantage of this type of dilatometer is that there is no deformation of the sample, at high temperatures, due to the force exerted on the sample by the push rod of the measuring system.
Sample Preparation
- Sample Forming
- Glaze Preparation
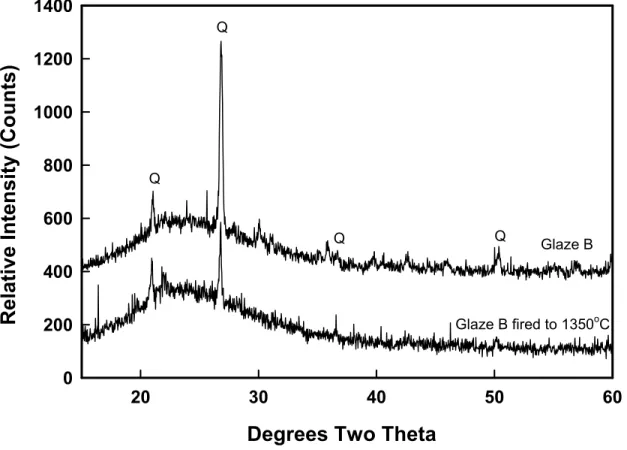
- Glaze B Fired to 1350°C
- Glaze Application
- Loading Rate
- Four-Point Flexure
Glazes C, D, E and F were mixtures of base glaze and glaze A and base glaze and glaze B. All UMFs were calculated based on chemical analysis (ACME Analytical Labs LTD., Vancouver, BC) of the sample. Chemical analysis was performed using ICP-AES (Inductively Coupled Plasma-Atomic Emission Spectroscopy) by digestion of the samples with lithium borate.
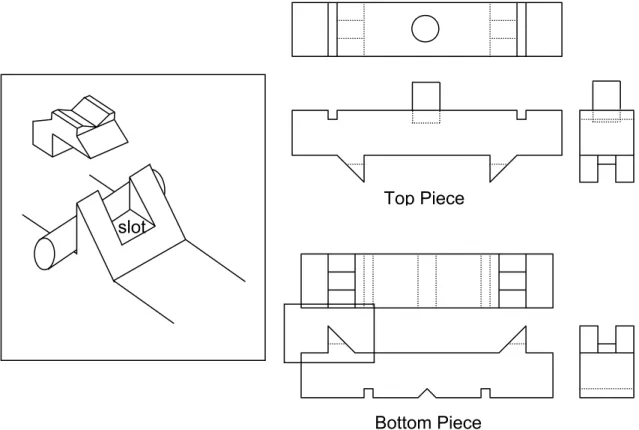
A 50 wt% slurry was prepared and ground in a ball mill for 12 hours to reduce the particle size of the frit. The standard procedure ASTM C1161-9436 was used, although the loading rate was varied for testing the unglazed samples to check the accuracy of the test. The loading rollers are allowed to roll freely to eliminate frictional restrictions.37 Figure 2.2 shows the new fixture used, while Figure 2.3 is a schematic representation of the fixture with an enlargement of the cradle diagram.
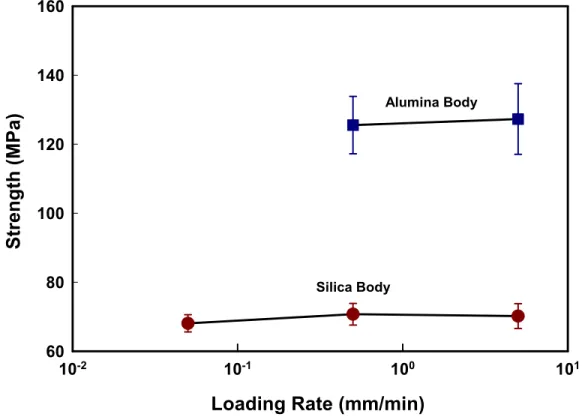
Effect of loading rate on mechanical strength of alumina body and silica body.
Measured Glaze Stress Levels
Property Measurements
Young’s Modulus and Poisson’s Ratio
Bulk Density Measurements
Fractography Analysis
Scanning Electron Microscope (SEM) Analysis
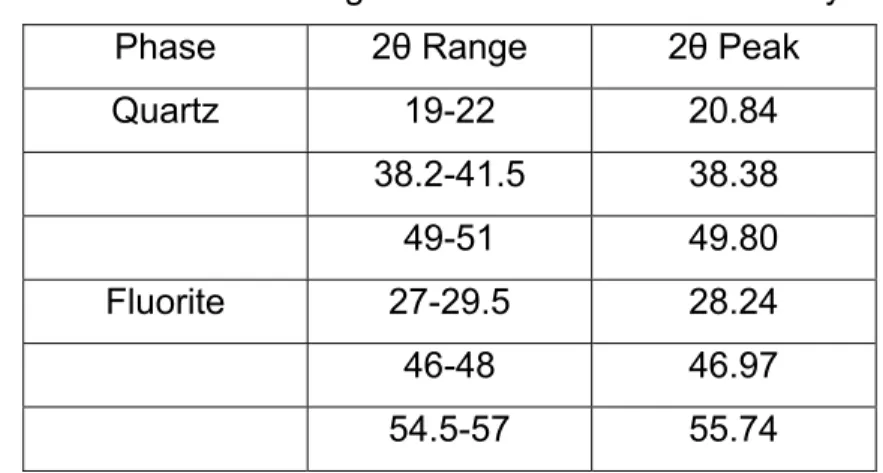
X-Ray Diffraction (XRD)
Qualitative XRD
Quantitative XRD
- Sample Preparation
- Profile Fitting
- Percent Quartz Calculation
The powder was then manually mixed with 10 wt. % of fluorite in an aluminum oxide sieve and with a pestle. To ensure complete homogeneity, the powder was then manually mixed wet using acetone and a Teflon spatula and, once dry, ground again. The powder mixture was then analyzed by XRD (Siemens D500 Goniometer, CuKα radiation, Alfred University, Alfred, NY).
The following parameters were used in the Jade profile fitting function (Version 6.0, Materials Data, Inc.). Vertical background was set to 0%, background fitting was linear, Kα2 peaks were included, and individual profile peaks were used. The area intensity from the characteristic quartz peaks was added together and then divided by the combined area intensity of the fluorine peaks.
The addition of the internal standard "dilutes" the sample, and thus the result given by the calibration curves.
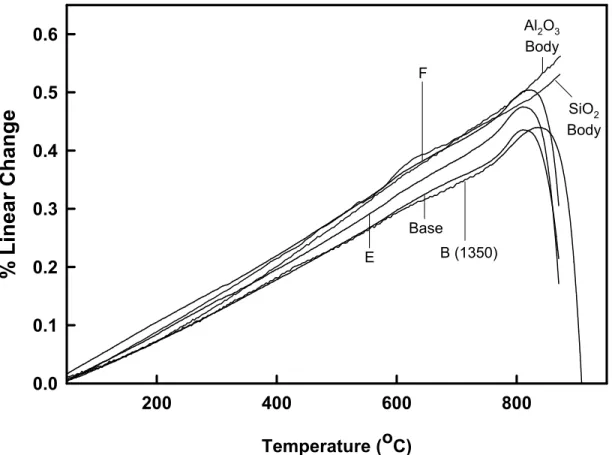
Determination of Coefficient of Thermal Expansion Values
CTE as a Function of Composition
Qualitative XRD Analysis
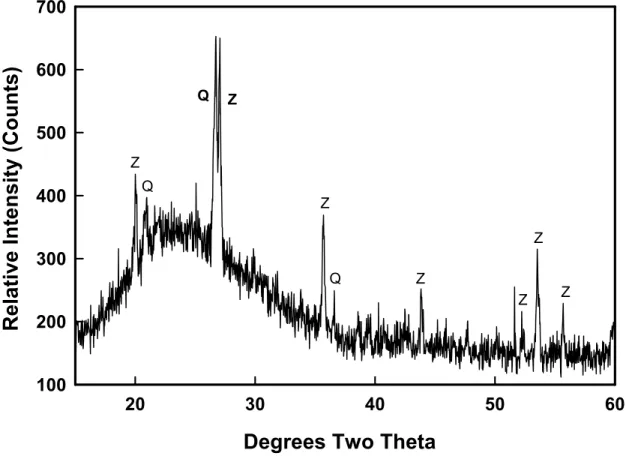
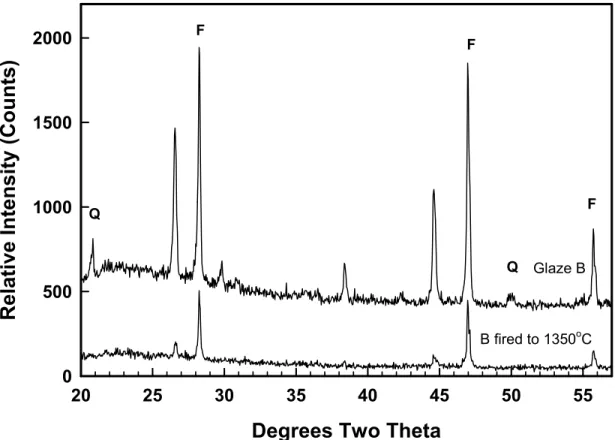
XRD was used to determine if any undissolved quartz was present in the glaze. The XRD pattern of Glaze B fired to 1350°C showed the presence of only a small amount of undissolved quartz. Glazes C, D, E, F and the base glaze all showed the presence of zircon as the crystalline species.
Glaze A had no crystalline species present, as shown by the large amorphous hump found for the XRD pattern. XRD pattern of glaze B showing the presence of undissolved quartz and XRD pattern of glaze B fired at 1350°C with a negligible amount of undissolved quartz present. In both cases, a significant amount of quartz is present, indicating that not all of the quartz particles were dissolved during firing.
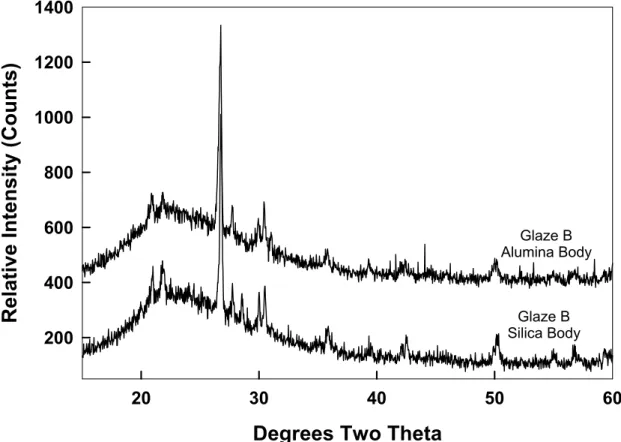
XRD pattern of glaze B applied to the alumina and silica bodies showing the presence of undissolved quartz particles.
Quantitative XRD Analysis
Strength Testing
Effect of Glaze Composition
- Silica Body
- Alumina Body
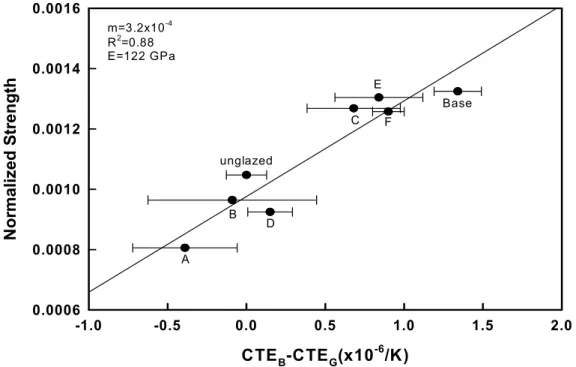
- Effect of CTE Mismatch on Normalized Strength
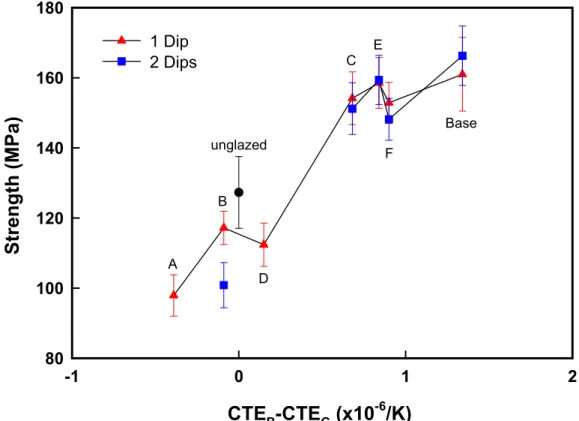
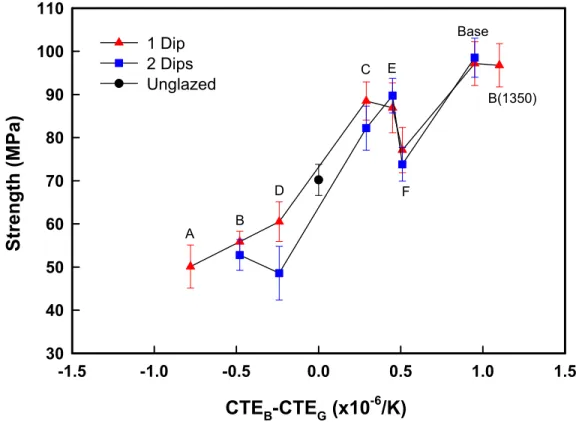
The amount of compression present in the glaze correlated with the strength of the sample for the samples once immersed, except for one glaze. Bars glazed with glazes A, B and D gave strength values lower than those of the unglazed samples. Figures 3.11 and 3.12 show how a thermal expansion mismatch affects the measured strength when the strengths are normalized to the Young's modulus of the silica body and the alumina body, respectively.
The strength of the samples for each body has been normalized to the respective Young's modulus for each body. This was done because the Young's Modulus of the body contributes to the overall strength of the piece. It is shown that when the strength of the pieces has been normalized to the Young's Modulus of the respective body, both bodies behave similarly.
The effect of thermal expansion mismatch between the body and gloss when the measured strength is normalized to the Young's Modulus of the silica body.
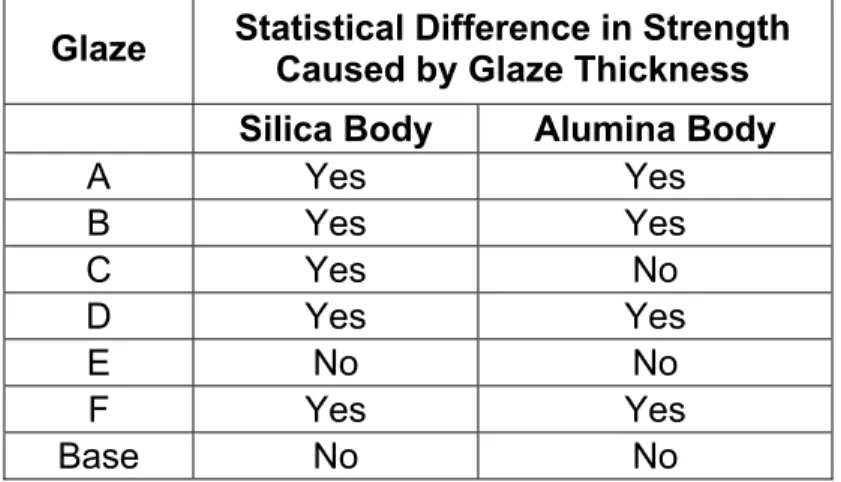
Effect of Glaze Thickness
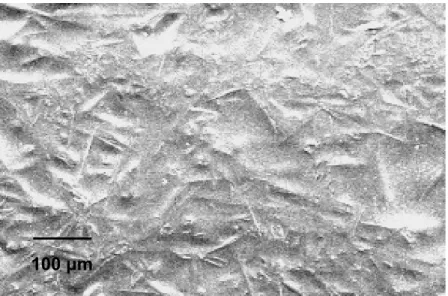
SEM photomicrograph of crystal growth seen on the glaze surface of Glaze A, dipped twice on the alumina body. The bars dipped twice with Glaze D on the alumina body showed the same type of crystal growth as the bars dipped twice with Glaze A, but to a lesser extent. Again, the sticks single dipped with Glaze D on the alumina body showed no crystal growth.
SEM photomicrograph of crystal growth found on the surface of Glaze D, double dipped, on an alumina body. No significant amount of crystal growth is observed, although a small amount of zircon is present.
Stress Calculations
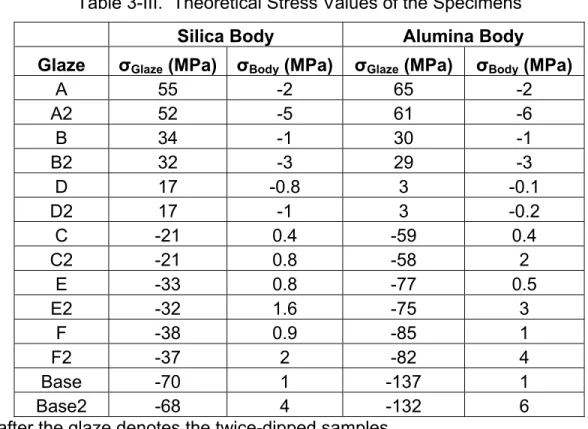
Theoretical Stress Levels
T=temperature difference between Tg of the glaze and the temperature where the voltage is measured. The specimens with the base glaze have the greatest amount of stress present in the glaze, and those with glaze A have the lowest for the alumina body. The samples dipped twice, which therefore have a greater glaze thickness, have less stress in the glaze simply because the amount of stress is spread over a larger volume.
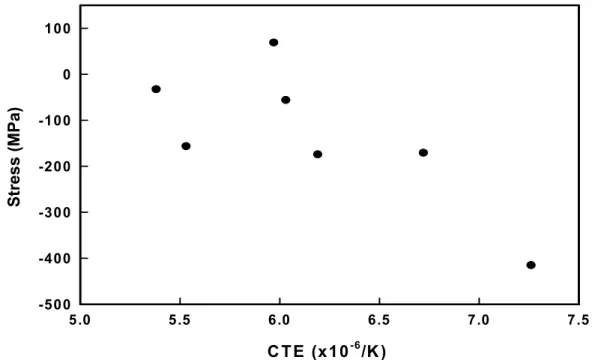
Figures 3.17 and 3.18 show how the amount of stress in a glaze depends on the thermal expansion mismatch between the glaze and the body, for the silica body and the alumina body, respectively. The greater the amount of mismatch, the greater the amount of tension in the enamel. This is because the tension in the body is distributed over a larger volume than in the enamel.
Theoretical stress levels present in the glaze based on the thermal expansion mismatch between the glaze and the silica body.
Measured Glaze Stress Levels
Calculation of residual glaze stress levels for silica body samples determined using the "warp test" method. In these figures it can be seen that the samples glazed with glaze A distort the greatest amount, indicating the greatest amount of residual stress present in the glaze.
Fracture Analysis
Comparison of Fracture Surfaces of the Bodies
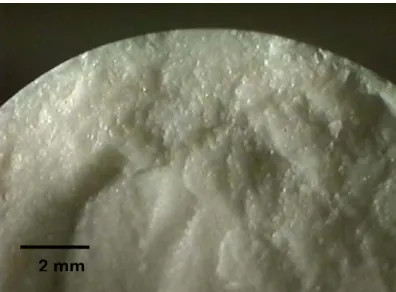
A low-magnification optical image of a high-strength silica sample dipped with the base glaze, showing a distinct mirror surrounded by fogging, with the fracture origin at the center of the mirror. A low-magnification SEM image of a typical fracture surface of a low-strength alumina sample dipped with glaze B, where the entire fracture surface is mirrored. The high strength alumina body samples had very distinct mirrors with surrounding hackle and fracture origins located near the center of the mirror.
The mirrors were generally small, because the samples had high strength, and the strength is inversely proportional to the square root of the radius of the mirror, as shown in Equation 1. A low magnification optical image of a typical fracture surface of a high strength aluminum oxide body sample, dipped with the base glaze.
Comparison of Glaze Thickness for Each Body
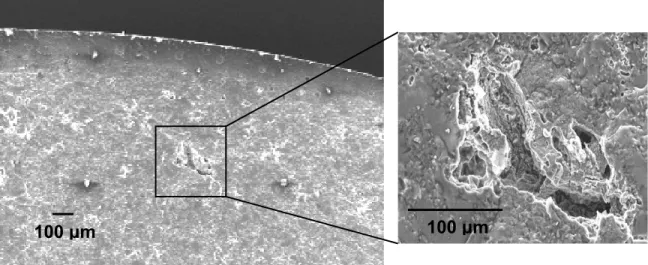
SEM photomicrograph of a typical fracture origin for alumina body specimens showing the base glaze, once immersed. Low magnification optical micrograph and a high magnification SEM micrograph of a typical fracture origin for alumina body specimens with the base glaze, twice immersed. The decrease in strength of the twice-immersed samples is attributed to the fact that the fracture origin is larger than that of the once-immersed samples.
SEM micrograph of pores at the glaze/body interface as a strength-limiting crack for alumina-bodied specimens with glaze C once dipped. SEM micrograph of a glaze bubble as a strength-limiting crack for double-dipped alumina body specimens with glaze C. Fracture origin characterization of alumina body samples Glaze type Crack location Crack size (µm).
Samples double-dipped with glazes A and D on the alumina body were exceptions as these samples showed a much wider spread in the strength data.
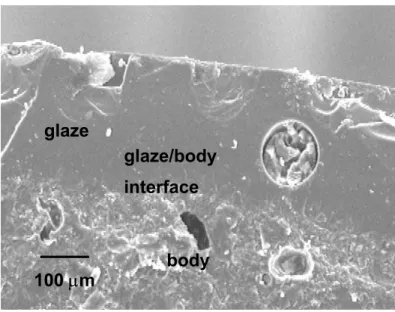
Glaze/Body Interface
Using flexural testing and fractographic analysis, the effect of multiple glaze variables on the mechanical strength of two commercial porcelain bodies was characterized. As the amount of thermal expansion mismatch between the glaze and the body increased, the strength of the specimens increased. It has been shown that the strength of a piece can be predicted if two things are known: (1) the amount of thermal expansion mismatched by the body and glaze and (2) the Young's Modulus of the body.
Therefore, it would be beneficial to determine how thermal expansion mismatch affects the strength of several commercial porcelain bodies. Funk, "Pressure Glazed Strengthening of High Strength Porcelain"; B.S. 34; Improving the Mechanical and Electrical Strength of Porcelain", Lampron, "Differences in Strength in Glazed and Unglazed Ceramic Systems as a Result of Interfacial Silica Grain Impurities"; M.S. Bopp, "Strengthening of Glass-Ceramics Using Compression Glazes," J. Thiess, "Influence Glaze Composition on Mechanical Strength of Electric Porcelain," J. Koenig, "Effect of Glaze on Vitreous China Body Properties," J. Feinberg, "Effect of Glaze Load on Mechanical Strength of Electric Porcelain"; M.S. Pinto, "Effect of Quartz Particle Size on Porcelain Strength" ; Carty, M.S., Alfred University, Alfred, NY, March 2003, private communication.
Hasselman, "Relation of Flaw Size to Mirror in the Fracture of Glass," J. Freiman, "Prediction of Fracture Energy and Flaw Size in Glasses from Measurements of Mirror Size," J. McKinney, "Relation of Fracture Mechanics to Mirror Surfaces of Fractured Brittle Materials," J. Quinn, "Design Data for Engineering Ceramics: A Review of the Flexure Test," J. Peterlik, "Relationship of Strength and Defects of Ceramic Materials and their Treatment by Weibull Theory," J. Rivera, " Effekt af produktionsparametre på variationen af industrielle porcelæns styrkeværdier," Ceram.