and
II. AN "ULTRA-SPECTROMETER tt TECHl\JI~UE FOR INFRA- RED BANDS
Thesis
by
Martin Summerfield
In Partial Fulfillment of the Requirements for the Degree of Doctor of Philosophy
CALIFORNIA INSTITUTE OF TECHNOLOGY
Pasadena, California 1941
TABLE OF CONTENTS ACKNOWLEDGEJVIENT
SUMNIARY AND INrRODUCTI ON
I. EFFECT OF PRESSURE ON INFRA-RED ABSORPTION OF OZONE
Page 1 2
1. On the Broadening of Spectral Lines
3
2. The Effect of Pressure on Band Absorption
q
3. The Measurement of Ozone Band Absorption I 2..
4. Theory of Band Absorption and Comparison
with Experimental Results
/q
II. ULTRA-SPECTRO~.IETER TECHNIQ.UE FOR IID"RA-RED BAl-J1JS
5. The Ultra-Spectrometer Idea
6. Spectrometer Measurements of Ozone Band Absorption
?. The Density Contour of the 9.6~Band
8. The Structure of the Ozone Molecule
9. Possible Applications and Limitations of :viet hod
10. Further Problems
APPENDIXES~ A toG.
SYMBOLS AND NOTATION
FIGURES AND GRAPHS / 1 to zq
REFERENCES
2.2
zt
2Cf 31 the ..3b3'1
iJ 3 58
5~
88
I would like to thank all those people who helped make this thesis possible. In partic- ular, I am grateful to ~r. I.
s.
Bowen for his continued encouragement and interest, to Dr.w.
Elsasser for many valuable discussions, and especially to Dr. John D. Strong, who not only suggested and guided this work, but by his con- tagious enthusiasm encouraged my love for re- search.
SUivll;IlillY AND INTRODUCTI ON
In the course of developing a method for determin- ing the height of the atmospheric ozone layer, it became necessary to determine the effect of total pressure on the absorption of radiation by the ozone band at 9.6~.
Accordingly, the transmission of ozone was rneasured with a reststrahlen receiver whose response curve was centered near 9.6~ . This was done at seven pressures between 6 mm. and 722 mm. with ozone thicknesses ranging up to 5 mm.
The proportionality of absorption to the square root of the thickness at low pressures suggested that the mechan- ism was Lorentz broadening. The possibility of using the dependence of band absorption on thickness as an ultra- spectrometer technique made it desirable to repeat the measurements with spectral resolution.
vj i th these experimental results, it was found possible to deduce a value of the effective spacing of the lines in the band, and in this way a "line-density contourn of the ozone 9.6p. band was obtained. .lhis density contour indica- ted that the bc..nd had a central branch, which served to strengthen tne isosceles triangle model of the ozone mole- cule.
The name "ultra-spectrometer ' was adopted to emphasize that the technique yields the spacing of the lines in a band when thst spacing is far smaller than the available spectral resolving power. It was suggested by analogy with the ultra-rnicroscope, an instrm~ent that detects particles smaller than the available optical resolving power.
The importance of this technique as an aid in the iden- tification of band types is readily appreciated when it is realized that all molecules but the simplest possess spectra unresolvable by present-day spectrometers. ,,li thout adequate resolving power it is,difficult to deduce the rotational structure of a band, and unless this is known, it is impos- sible to assign the bands in a spectrum to specific vibra- tional modes. Hence, a "line-density contour" obtained with the ultra-spectrometer method may be decisive in the analysis of an infra-red spectrum.
2
I 1 EFF£C11 OF PRESSURE ON INFRA-BED ABSORPI'ION OF OZ01~
l. On the Broadening of Spectral Lines.
The effect of pressure on infra-red band absorp- tion is a result of the influence of pressure on the widths of the individual spectral lines. The status of present-day knowledge of the broadening of spectral lines is covered in the recent review by lvlargenau and vlatson ( 1 ) from which the following remarks are taken.
The width of spectral lines can be attributed to combinations of the following factors:
1. Radiation damping.
2. Doppler effect.
3. Resonance broadening.
4. Broadening by forces of Van der Naals type.
5. Broadening by molecules with permanent electric fields.
6. Lorentz broadening.
To determine which of these types is applicable to the broadening of the ozone lines, we have to examine these widths quantitatively.
The first type, t ae so-called natural line width, depends only on the electromagnetic field of the isolated molecule and hence is independent of pressure. It is quite small for transitions obeying the usual selection
-6 -1
rules, being of the order of 10 em. in the band being
investigated.
The Doppler effect, at ordinary temperatures, re- sults in a width of about 10-3 cm.-l in the region of
10 ~ ,
smaller by about one-half than the Lorentz width at the low- est pressure, 6 mm. Strictly speaking, the Doppler width is not negligible. However, the Doppler distribution is a very close one, and even when it exceeds the other types in width, it can be neglected in the wings of the lines. In our appli- cation, the relation between absorption and thickness of ozone is dependent almost exclusively on the shape of the wings of the lines. Therefore, it is not surprising that this relation, at 6 rmn. pressure, is in agreement with the Lorentz type. (See Section 4.).
Resonance broadening is due to the interaction be- tween similar molecules: in this case, the mutual effect of neighboring ozone molecules. It would be expected that the degree to which the line width is attributable to resonance effects would be dependent on the concentration of ozone in the ozone-oxygen mixture. The highest concentration used was about 40%, while the most important results are derived from the measurements on concentrations below 15%. Further, accord- ing to Margenau and Watson (loc. cit. p.40) the interactions between like molecules generally seem to affect infra-red lines in about the same manner as interactions between unlike mole- cules. There was no experimental evidence for ·any ~nomalous
behavior in the ozone-ozone interaction, in these experiments.
molecules carrying no permanent polar fields is called Van der ~laals broadening. In general, it results in con-
siderable line asymmetry because of actual alteration of the energy levels during the close collision. This type is dependent on the square of the gas density and does not become comparable with Lorentz broadening until high densi- ties (several atmospheres pressure) are reached. (See
Margenau and Watson, loc. cit. p.45). Hence at low pressures, Lorentz broadening would be expected to predominate.
If the foreign gas used to control the pressure con- sists of molecules with strong permanent polar fields, the ac- tion of these fields produces what is called Stark-effect broadening. Since, however, oxygen is not such a gas, we can ignore this mechanism.
According to Margenau and Vatson (loc. cit. p.40) it is Lorentz broadening that is largely capable of explaining line-breadths in near infra-red spectra. This conclusion is derived from va.rious experiments in the photographic region, and probably holds in the non-photographic, near infra-red.
Of course, the Lorentz mechanism is not different in nature from the other "typesrr of molecular interaction--Resonance, Van der ~laals, Stark-effect. It is merely a convenient way of describing one term in the complete expression for the total width of a line. It was first derived by Lorentz by considering that the process of absorption (or emission) is
interrupted at random intervals by collisions between mole- cules. He thereby introduced the concept of an "optical collision diametern, which for most gases is of the order of 10 A.U., and is larger than the kinetic-theory diameter ob- tained from viscosity or diffusion experiments.
The shape of a spectral line due to this mechanism is given by the Lorentz formula:
~So< (1)
~
=(.Y - ~t +
0(2.where ,.,JL is the absorption cS is the total intensity of the line defined by oefficient at frequency lT, and
-- ~df~
0( is1
the half-width of the line.
~he half-width is given by:
o(
=
_L(2:tr.kT)~n. z. M+m '\~
n- f · Mf'Yl l
( 2)where~ is the optical collision diameter,
11
1 is the number of molecules per unit volume,f1
and m are the masses of theperturbing and absorbing molecule, respectively,~is Boltzmann's constant, and
T
is the absolute temperature.It is readily seen that the half-width varies direct- ly with the total pressure and inversely with the square-root of the temperature.
The applicability of collision broadening theory to H20 band spectra in the infra-red has been discussed by
Elsasser (2
) who concludes "that collision broadening is prac- tically the only cause of line width under atmospheric condi- tions". The reasoning could be applied to
o
3 as well.Matheson ( ) has measured the increase of band absorption with thickness for the CO 4.66~band, and con- cludes that the results are in agreement with the Lorentz shape.
A further question that cannot be overlooked is
the effect of pressure on the total intensity of a spectral line, for unless we are sure of the constancy of line inten- sity, the dependence of transmission on pressure cannot be used to determine line widths.
-+0'0
The total intensity of a line, defined
as_~jkJ~ ,
depends on the transition probability and the equilibrium population of the molecular energy levels. ~he former de- pends on the form of the wave-function and hence, on the field of force; the latter depends on the energies of the levels and the tempereture of the gas. In the case of colli- sion broadening where the forces introduced by neighboring molecules merely affect the phase of a radiative transition,
it is hardly probable that the wave-function is changed
appreciably. Changes in the wave-functions serious enough to affect the transition probabilities would be expected at
large densities, where considerable line as~nmetry would also be introduced. Since the experiments were conducted at con- stant temperature, the population of the states was unaffec- ted. Therefore, on theoretical grounds, the total intensity of the lines would be independent of pressure.
Unfortunately conclusive experimental work on the subject has not been done. G. Becker(4
) examined the depen-
dence of line intensity on pressure in the HCL 3.5JUband and concluded that it is independent of pressure. His work is perhaps open to the objection that his resolution was not as complete as he thought. Further evidence of the con- stancy of line intensity can be found in the asymptotic approach to constant absorption at higher pressures, in the present work on ozone, and in the work of E. von Bahr (5
) on
8
2. The Effect of Pressure on Band Absorption.
The qualitative hypothesis, that the increase of band absorption with increasing pressure is due to the broad- ening of the individual lines of the band, was first proposed by Chr. Fuchtbauer( 6 ) in 1911. Ladenburg and Reiche(?) fol- lowed up this suggestion in 1913 with a mathematical analysis of the phenomenon.
To get a qualitative conception of the process, we consider a uniform band of lines at a low pressure so that the line-widths are much smaller than the separation, as in Fig. 1~. Allow the pressure to increase until the band looks like Fig. lQ. The maximum intensity decreases while the width increases so as to preserve the same total intensity, the area under each "line''• That the absorption in case lh. will be greater than in la is evident, because the re-distribution of the intensity has enabled the wings of the line to absorb more radiation than the reduced center will transmit. As the gas pressure increases, the lines start to overlap, Fig. 1~, and the total absorption continues to increase, but now more slow- ly because part of the line intensity acts in a spectral region already covered by a neighboring line. Finally, as in Fig. 1~,
the lines have been greatly broadened by high pressure, and the overlapping is so complete th&t the composite intensity curve is flat. In this case, the absorption is at its highest, and higher pressure can merely slightly broaden the band as whole, and similarly, only slightly increase the absorption.
Recapitulating, the increasing pressure causes the
absorption (of a constant thickness, of course) to increase rapidly at first, then more slowly, and finally to level off.
This behavior was first observed and systematical- ly studied by E. von Bahr, a student of K. Angstrom, during the Years 1909 to 1912 (5' 8' 9). Fi g. ~
~
i s repro uce d d f rom her 1910 paper; it shows the increase in absorption withpressure for
o
3 , HCL, N2o4 ,so
2 , andNo
2• It may be remarked here that Fig. 2 contains the germ of the ultra-spectrometer method. The correlation between the steepness of approach to10
the maximum absorption and the moment of inertia of the absorb- ing molecule suggested the connection between the shape of the curve and the closeness of the lines in the band.
Similar studies of this pressure-effect were made by Hertz(lO) in 1911 and Wimmer(ll) in 1926. ·The former studied the C02 band at 14.?~ . The latter measured the absorption of the
co
2 4.3)Aband under varying pressures of A, N2, air, and H2• Theco
2 results are similar to the results of E. von Bahr.The phenome~on of band absorption can be discussed in terms of departures from Beer's law: (l) the absorption is dependent on total gas pressure, and (2) the absorption is not, in general, an exponential function of thickness. The dependence on gas pressure has been explained on the basis of pressure-broadening of the rotational lines. The depar- ture from the exponential law is a result of the varying ab-
sorption coefficient in the band. Obviously, the dependence on thickness will be determined, at small thicknesses, main- ly by the absorption coefficient at the central regions of the lines; at large thicknesses, by the wings of the lines;
at intermediate thicknesses, by an naveraget' absorption co- efficient. Effectively, then, the "absorption coefficient"
varies with thickness.
A quantitative discussion of these departures from Beer's law will be found in Section 4.
3. The Measurement of Ozone Band Absorption.
In this section the experimental apparatus and procedure will be described.
The object was to measure the absorption of the ozone 9.6~ band at varying ozone thickness* and under several different pressures. The necessary measurements were the total gas pressure, the thickness of ozone in the absorption cell, and the infra-red transmission at
9.6~ .
The pressure was measured with an ordinary U- tube mercury manometer for pressures above 26 mm., and a 10 X 1TcLeod gauge for lower pressures.
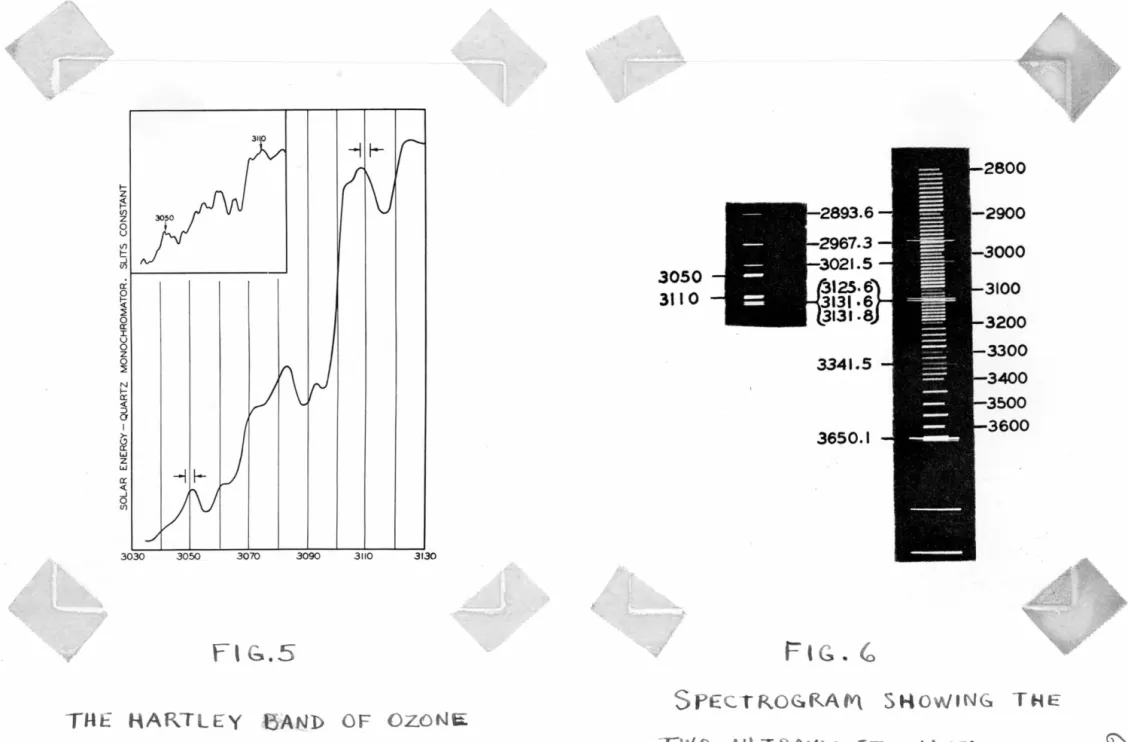
The thickness measurement was based on the absorp- tion at 3110 A.U. and 3050 A.U. in the Hartley band of ozone, where the absorption coefficients have been experimentally investigated and ~eer's law is obeyed.
The 9.6~ absorption was measured simultaneously with an apophyllite reststrahlen receiver whose response curve centered nicely on the ozone band.
The total pressure was controlled by the addition of oxygen. ~cccrding to experiments quoted by ~argenau and
*
The "thicknessn of the absorbing gas is defined to be the path length of' the gas layer reauced to ?66 mm. pressure&nd 0°C.
12.
and \ tson (loc. cit. p.40), the effects of foreign gas pressures show no anomalous departures from Lorentz broad- ening in the infra-red. This was lso found true in the C02.
experiments, with N2 and air, of ·Timmer (ll), In a·dition, no significant difference was found in this research when, in two measurements, air instead of cxygen was added to the ozone.
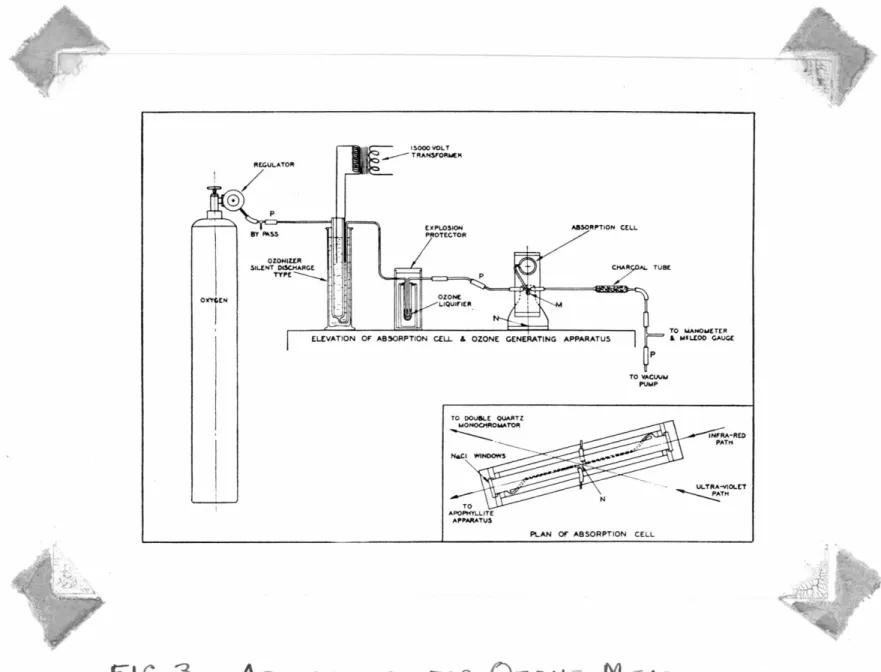
The mixture of oxygen and ozone was produced by a silent-disoh rge ozonizer from Linde ozygen (99.5 02, 0.5 N2) end was introduced into a 36-inch glass cell fitted with
3-ineh optically worked N Cl windows, Fig. 3. The manom ters ere conn oted to the cell through a charooa.l filter tube to protect the mercury against oxidation; a similar connection was provided tor the pump. In the inlet line was inserted a li uid air condenser for freezing out the ozone from the
pproximately 5% mixture produoed by the ozonizer, thus obtain- ing concentrations up to 40% in the eell.
The oell could rotate about a vertical axis to alter- nate between the ultra-violet path and the infra•red path. In
a~ ition, it 1 s pivoted on a horizent 1 a is to alternate be- t een the in•beam nd out-of-beam positions, thus m ldng
possible control measurements of the eouroe lntensity. Flex- ible ocnneotions were made with Koroseal tubing
(l
2) which re- sisted oxidation sufficiently to withstand several weeks of exposure, hereas ordinary rubber tubing would disintegrate in a few minutes. ·rhe use of stopcocks and the consequentl'f
contamination by grease vapors was avoided by the use of pinch-clamps on the Koroseal connections.
The infra-red measurements were made with a
reststrahlen receiver fitted with five apop~yllite reflec- tors, the sensitive element of which was an evacuated ther-
(13) mocouple nblackened" with finely powdered crystalline quartz A KI plate served as a window to the thermocouple cell. The se- lectivity of apophyllite and the degree of elimination of scat- tered radiation is demonstrated by the fact that a clear glass plate interposed in a beam of sunlight reduced the response to 1/4% of the uninterrupted reading. Clear glass is opaque to the 9.65~ apophyllite reststrahlen but freely transmits the visible and near infra-red. fhe response curve of the
(13)
instrument, measured wi t.h a grating spectrometer and en- closed globar source, is shown in Fig. 4, superimposed on the ozone 9.6~ band, which was measured with the same spectro- meter, similar thermocouple and similar source.
The source of infra-red radiation was a globar rod heated to about 1000° C, and enclosed in a water-cooled jacket to reduce temperature ,variations and blacken its emission.
The intensity was held constant to less than 1% over a period of an hour by two parallel-connected iron-filament ballast tubes (type UV-876). The radiation was collimated by a 3-inch off-axis parabolic mirror.
A quartz-bulb tungsten lamp provided a continuous
source of ultra-violet radiation. A Hilger-Iviuller double quartz monochromator was used. to isolate the proper wave- lengths. The radiation emerging from the monochromator fell on a sodium photocell in a quartz. bulb, the· current then being amplified(l4
) and indicated by an L&N portable galvanometer. Two quartz lenses collimated and focussed the beam on the entrance slit. ·rhe current through the lamp% was controlled by a Raytheon 250-watt transformer, resulting in a steady intensity that was constant to within
1% during a measurement, even during the busiest part of the day.
The determination of the ozone thickness is based on the Hartley band absorption where there is no pressure- effect and Beer's law applies. Two bands of about 6 A.U.
width at 3050 and 3110 A.U. were selected, as shown in Fig.5, which is an intensity curve of the solar radiation passed by the atmospheric ozone. The two bands are also shown in l!'ig. 6, in comparison with the mercury spectrum. The upper spectrum illustrates the functioning of the monochromator: a number of bands at various wavelength settings are compared with the mercury spectrum.
are:
The symbols used in the calculation of the thickness
p.-
1 ,)'(-2.. -
the absorption coefficients at 3050,3110 A.U. respectively.
1 I -
the intensity transmitted by the ozona.I I 2.
cell in the beam, at the two wavelengths.
the intensities with the ozone cell out of the beam.
X -
the ozone thickness.f( -
the ratio of I 2 to I 1I
o o1\
0- the ratio of z.to I ,
the intensities transmitted by the empty cell.
t,c, tz.c -
the transmission of the rock-salt windows at the two wavelengths.Rc. -
the ratio oft2.c
tot ,c
The transmitted intensities are:
I
=I
10- )A'XI IC. (3}
Dividing,
R.
=l
= ~ 10()-t•-,M-L)X (4)I, . I,c
To correct for long term variations in source inten- si ties, the cell was pushed out of the beam at each measure.- ment of R.
Io
z. (5)I o
I
I.e.
-r: t,c.
( 6)Izc. = r; tz.~
>From ( 4}, ( 5} and (6) ,
R
=Ro R.c.
I 0 <,,~u., -~2-) X (?)Therefore, X _ I
~---~
RRR (8)- p,-A2-~a o <:..
The best value of ( ? -.1o.s-o-
p
3110 ) was taken as 1.50 + .10 ~~· ~ course, the thickness might have beenmeasured at one wavelength only but a survey* of the various
)
determinations of Hartley band coefficients showed that the absolute values differed greatly, but all the investigators were in close agreement on the relative values.
R0 was measured at various times during the re- search and was found to be quite constant at 0.977. R0 was measured as a control at each determination of the thickness:
it was about 1.52. These measurements were accurate to about 1%, and although {~, - ~~ ) is in doubt by as much as 10%, the relative thicknesses, and consequently all the conclusions of this study, are affected only by the lower figure.
The 9.6]U measurements were made i n the following way. The transmission of the ozone and cell was determined from the ratio of the intensities with the cell alternately in and out of the beam. 'l'his was then corrected for the transmission of the empty cell, T0 (about 0.83), to obtain the transmission of the ozone itself,
1ru.
Because the ozone slowly decayed as the measurements progressed, the following regi~ was adopted. First the infra- red transmission was measured, rocking the cell in and out of the beam. Then the cell was rotated to the ultra-violet path, and R was measured with the cell in, then R0 with the cell out, and again R with the cell in. Finally the infra-red trans-
*The survey of the literature was made by Dr. K. Watanabe. He subsequently changed his "best value" to 1.40 on the basis of· the work of Ny and Choong (15}, but the calculations in this thesis are made with 1. 50, the sole exception being ~·igs. 7 ,7o..,3,Cf.
mission was again measured. Thus, the sequence was T, R, R0, R, T. In calculating, the two T's were averaged, the
two R' s were average,d, and then T. av. , R. av. and R0 were applied to the computation of the thickness and the infra- red absorption.
In this way, a series of measurements at different ozone thicknesses was made under the same total pressure.
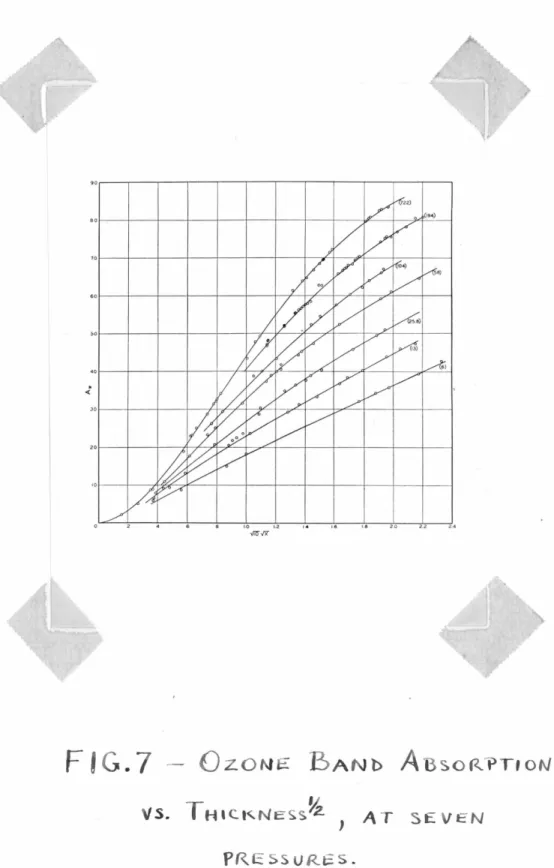
~his was repeated at pressur~s of ?22, 194, 104, 58, 25.8, 13.0, 6.0 mm. The thicknesses ranged up to about 5 mm. A typical page of data for one point is shown in Appendix B.
The results are shown in fig. ? , where
A
1rthe infra-red absorption, is plotted against the square-root of the thickness,
X ,
in em. A cross-plot of the variation of absorption with pressure is shown in :b'ig. 8, at different thicknesses. The curves are compared with the straight linesv'l .
F
arepresenting A --....
p
1 rn 1 ~. 1 .18
The calculation of band absorption has been treated by several authors: Ladenburg and Reiche (?) in 1913,
(3) ' (2 16)
Matheson in 1932 and ~lsasser ' in 1938. The re- sults of the calculation described herein are those of Elsasser.
Let us consider a band of uniformly spaced, equal lines, each having the Lorentz shape. If the spacing is
cl
and the thickness of absorbing gas )( , then the absorption, defined as the fraction removed from the incident beam1is
+~
A = * fi ' - e.-r<- X) Jy
( 9)The absorption coefficient varies with frequency according to the equation:
(10) (See Sec. 1.}
For very small thicknesses, the absorption is proportional to t hickness:
A~ S x
(ll)At pressures low enough so tnat the lines do not overlap appreciably, tbe following equation holds for large thicknesses:
A
(12)Equation (12) is the asymptotic expansion of formula ( 9} at small d._ o( and large
X •
ilhenX
is in themoderate range used here, Elsasser has shown, (See Appendix D) that (12) should be replaced by the approximation,
(
~2 So<x)z + ~n..
iw+erceffo{_ (13)
The square-root relation is uue essentially to ab- sorption in the wings of the lines, the core being practically opaque. Fig. ? shows that the absorption at 6 mm. pressure is proportional to the square-root of the thickness. This may be regarded as direct support for the underlying hypothesis of Lorentz broadening, for the Lorentz shape is the only one that can produce this result.
At higher pressures this approximation fails, for when the half-width is comparable with the separation, the transmission is closely represented by:
(14}
This exponential relation holds more closely as
tanh~o(
nears unity, that is, for values of~ 0( about .3 and larger.
In the case of the ozone band,
~
reaches .3 at20 ·
about 100 mm. pressure (See E:lec. ? for the vo.lue of the line spacing). In this range, the absorption should be approximate- ly an exponential function of thickness, approaching Beer's law, but the absorption coefficient depends on the pressure.
At still higher pressures, ?22 mm. for example, the value of tanh ~ is unity, and the formula becomes
S X (15)
T
-===e cc-
This gradual approach to the exponential law as the pressure increases is verified by the curves of Fig. ?a, where the data of ll'ig. ? are plotted on logarithmic scale.
They also illustrate the asymptotic apprrech t o a constant absorption coefficient. If we bear in mind that the analy- sis is based on an "ideal bandn while the experimental data apply to a band composed of lines of irregular intensity and spacing, the agreement seems quite good.
To show how the absorption increases with pressure and l evels off asymptotically, A was plotted against p for several thicknesses, in Fig. 8. These curves may be compared with those of E. von Bahr, Fig. 2. 4ccording to equations
(2) and (12), the absorption at low pressures should increase with the square-root of the pressure. To test this, log A is plotted against log p, in l!'ig. 9. The slope over the range 6 mm. to 194 mm. is approximately 1/4.
Attention had been drawn to this fourth-root rela-
t o {1?)
lOll as being in disagreement with the collision broaden- ing explanation of the pressure-effect. The nanomalya may, however, be exaggerat~d. The theoretical square-root rela- tion is limited to low pressures, and indeed, the experimental points at the two lowest pressures show a slope of 1/3. 'I'hus, the curves may be just emerging from the square-root region, the 6 mm. curve being the only one which is strictly a square- root curve in Fig. ?. Appendix E contains further remarks on the p1/4
relation.
II. ULTRA-SPECTRChiETER 11ECHNIQ.UE. FOR INFRA-RED BANDS
5. The Ultra-Spectrometer Idea.
The basis of the ultra-spectrometer technique is a correlation between the shape of the pressure-effect curve and the closeness of the lines in the band.
If a constant thickness of absorbing gas is subjec- ted to increasing pressure, the absorption increases, rapid- ly at first, then more slowly, and finally "saturating".
This process has been described in $action 2. Saturation occurs when the lines have so broadened and overlapped that the composite absorption coefficient curve is quite level. Obviously, the closer the lines, the smaller the pressure required to attain saturation.
This relationship between "saturation pressure"
and the density of lines in the band is obtainable from Fig. 2. If we list the bands in order of decreasing satura- tion pressure, they form the following sequence: HCL 3.~ ,
No
2 6.1JA , o
39. 6 r , so
2 ? .4J-L , N2o
4 5.? ~ • This is roughly the order of increasing molecular moment of inertia and probably increasing line density.Used as a technique, the pressure-effect curve can yield information as to the line spacing in a new band. If the saturation pressure is low, the lines are close together;
if it is high, they are wide apart.
Of course this qualitative method has its limita- tions. The most obvious is the absence of any very definite
criterion for determining the saturation pressure exactly. A further limitation is that the saturation pressure de- pends not only on the line spacing, but on such factors as the optical collision diameter a•Jthe mass of the molecule.
It was found possible to avoid these difficulties by applying the equations of Sections 1 and 4 to obtain a numerical value of the line spacing. This line spacing will be calculated at various wavelengths in the band. The pressure-effect curves obtained with a spectrometer will be used for this purpose. In the next section these measure- ments will be described.
6. Spectrometer Measurements of Ozone Band Absorption.
The object of this experiment was to measure the dependence of the ozone 9.6~ absorption on total pressure and ozone thickness, as a function of wavelength.
The same cell and auxiliary equipment used in the previous experiment was used in this. The ozone thickness could not be directly measured, but had to be calculated on the basis of the reststrahlen results, Fig. 7, because both the Hilger Inonochromator and the reststrahlen receiver were in use at the time at Palomar Observatory for ozone height determinations.
The radiation form an enclosed globa~ rod heated to approximately 1000° C (lS) was focussed by an aluminized spherical mirror on the center of the cell, and then fo-
cussed again by an opposite optical system* on the spectrometer slit.
A grating spectrometer fitted with a thermocouple receiver was used to measure the spectral intensity of the beam. The layout of the apparatus is shown in Fig. 10.
. ( 13)
The spectro~raph, described prev1ously had an
·F /3 optical system and an echellette grating**. The lines wev-e_
ruled 19.63 ~ apart over an area approximately five inches
*
The symmetrical optical arrangement, Fig. 10, distorts the image less than the anti-s~nmetrical one. See reference {19).**The grating was loaned by Prof. R. W. Vfood to Dr. Strong, who permitted it to be used in this research.
square, with the flare at 14~ in a Littrow arrangement.
The entrance and exit slits were each opened to a width corresponding to a spectral interval of .038)A at 9.6~.
By visual examination with white light, it was determined that the off-axis aberrations were smaller than the slit- width. Therefore, the resolution was probably about .06~
at 9.6~ , or a power of 160.
The radiation emerging from the exit slit was focussed by an elliptical mirror on a thermocouple of Bi-Sn and Bi-Sb wires coated with Th02 power and a thin lacquer binder. The thermocouple chamber was plli~ped by charcoal in liquid air: at "black vacuum" the sensitivity was 15 times that at atmospheric pressure. A rock-salt plate covered the aperture to the chamber. Rock-salt is non-selective at 9.6~ .
A reflector of sodalith was used in front of the entrance slit to isolate the 9.6~adiation from the much more intense short-wave radiation. To eliminate the small
amount of short-wave radiation passed by the sodalith reflec- tor (about 10% of the ,total), a Hubens shutter composed of a 1/10 mm. mica sheet and a compensating wire screen was used. The reflection curve of sodalith at 4?0 incidence and the
transmission curve of mica at normal incidence are shown in Fig. 11, together with the ozone band and the radiation from a black body at about 1000° C.
Insulation of the spectrometer with aluminum foil was found sufficient to avoid appreciable drift of the galvan-
ometer: intensity measurements could be repeated to less than
1%.
The voltage fluctuations of the line were reduced with a Raytheon stabilizing transformer. Constancy of the globar temperature was insured by draft protection of the surrounding water-cooled copper cylinder.The procedure for taking absorption measurements was to fill the cell with a mixture of ozone and oxygen at a determined pressure, and record the absorption in steps of .0?~ (1/2 mm. on the micrometer screw) across the band.
'.2he curves forward and bc.ckward were averaged to compensate for the gradual decay of ozone. 1hen the mixture was dilu- ted at the smae pressure, and the process repeated; and so on, until the ozone was almost gone. In this way, a series o1 absorption contours of different thicknesses at five different pressures, was obtained: 6.0, 13.0, 25.8, 50.0 and 722 rnm. The resu1 ts are shown in Figs. 12-16. A typical data page is described in ~ppendix B •
.:-.fter each absorption contour was obtained, the corresponding thickness of ozone was computed in the follow- ing manner. ~ach con~our was weighted with the response curve, Fig 4, of the reststrah1en receiver described above. The area under this weighted absorption curve represents the absorption that would be measured by the reststrah1en receiver.~ With
2(,
*
The necessi t.Y. ?f numerically calculating the weighted absorp- tion was ~b~~7~a by the kina loan by Dr. f. Elsasser of his integrating machine capable of computing , f2F(x) ~(x) d.x . F(x) was the experimental absorption curve; ~(x),
theapophyllite response curve.
this rt-absorption n, the ozone thickness could be read off the curves of Fig. 7.
Possible errors involved in this calculation were carefully investigated, and the combined probable error may be set at 2%. In aQdition, the method was checked for con- sistency by the following test: half the ozone was removed from a certain initial amount in the cell, and the calculated thickness before and &fter were found to be in the ratio of 2:1, allowing for a little decay. Thus, the relative thick- nesses are quite accurate; hence, also the pressure- effect curves, and the relative line-densities. The uncertainty in the absolute line-densities is still governed by the uncer- tainty of the Hartley band coefficients, ± 5%.
The curves of Fig. l? show the chru1ges in the absorp- tion contour of the same thickness of ozone at increasing pressures. The most significant effect of total pressure on band c..bsorption can be uemonstrated in terms of departures from Beer' s law. Figures 18 - 23 illustrate the n&ture of the deviations.
The first tl~ree of these figures are logari thrnic plots on which Beer' s law would be a straight line. It is readily seen that the exponential law fits closest at ?22 mm.., where "saturation~' has set in. The deviations become progres-
sively larger at lower pressures.
The second three are square-root plots, testing the square-root relation (13) . At 6 mm. pressure, while the
widths of the lines are still small compared with the separ- ation, the curves &re fairly straight. The deviations from straightness become more pronounced at higher pressures.
The curves of Figures 18 - 23 confirm rather well the calculations of bection 4. The low pressure data (6 mm.) are in accord with eq_uation (13); the high pressure dat.a
(722 mm. } agree with equation (14).
pressure with the square-root equation, and the ?22 mm. data with the exponential law, suggested the application of the band absorption formulas and the Lorentz line-width equation to the calculation of the ''eff'ecti ve line spacing". Vle call it the "effectiven spacing because the formulas are derived for bands of equally intense lines equally spaced. Such con- ditions do not exist in an ~ctual band.
The equations to be used bre the following:
From p. 6, ( 16)
From p. 19, A 2 {S o<X}l/2 (1?)
d
Trom p. 20,
sx
T -
e a:-
(18)From equation (16) the half-width of a spectral line can be c~lculated except for tne uncertainty in the mag- nitude of the radiation cross-section. Since
p
is about10 A. U., we may compute- 0( to within a small numerical fac- tor, c, probably between 1 and 5 for most gaseous molecules.
Applying equation (1?) to the 6 mm. data in Fig. 21, we see that the slope of the straight lines is
Therefore, (slope 6 ) 2 4
s
-x 0(,d d
O(t denotes the half-width at 6 mm.. pressure.
1
2 (S 0(
6)2/d.
(19}
If we sub- stitute the value of
o<,
from equation (16), we obtain thenumerical value of S . c •
d d
The quantity S/d can be obtained by applying equation (18) to the slope of the logarithmic plots of the 722 mm. data, Fig. 18.
Then,
t>lope 722
-=-
Sd
(20)
30
Combining (19} and (20}, we get a value of d I 0 or d , as we shall call it. d1 is the effective line spacing di- vided by a numerical factor between 1 and 5. ~le can intro- duce the term nline density·' by dividing d' into 10 em-• •
(10 em.-' is approximately the spectral width resolved by the spectrometer. ) Fig. 24 shows the variation of this line density across the ozone 9.6~band.
This density contour shows most spectacularly what has been achieved by this ultra-spectrometer technique: we are able to count the number of lines within a narrow, barely resolvable spectral interval, even when there are as many as two hundred lines in that interval!
8. The Structure of the Ozone Molecule.
Attempts to deduce the structure of the ozone mole- cule have been made by several investigBtors, the most recent being that of Hettner, Pohlman and Schumacher (20). The
troubles which beset all these investigators, other than that of manipulating ozone, can be reduced to two: the difficulty of purifying ozone from other gases, chiefly oxides of nitro- gen, and the lack of the necessary resolving power to analyze the rotational structure.
We may remark here that the use of the present tech- nique could have aided in solving both difficulties. First, by applying the technique to obtain curves like those of E. von Bahr, Fig. 2, the bands due to a heavy molecule like N2
o
5 could have been distinguished from those of the 03 mole-cule. The lower saturation pressure of the closely-spaced bands would have revealed N2 05 • And second, the lack of reso- lution could have been overcome by the determination of a
density contour of the band, as described in ~ec. 7.
The highest resolution ever applied to the analysis
' (21) h . i
of the ozone spectrum was that of Gerhard , w o 1.nvest - gated the structure of the 9.6~ band with a spectrometer slit width of 0.3 em-' • (Burs is 6.3 cm- 1 .) His spectrum is shown in Fig. 25. Gerhard decided that the ozone molecule is isosceles with an apex angle less than 60°. Such a mole- cule would exhibit the following fundamental vibrations:
\T, -
v:
2..-
}.[ 3
-
a central-branch type,
a central-branch type, ~ probably ~ \(, • a doublet type.
where, as usual,
\J;
is the "breathing" frequency, \T2 is the "bending" frequency, andY;
is the unsymmetrical twist- ing frequency.The long-wave half of the 9. 6
p
band was called ~because of its apparent doublet contour. The short-wave branch of the same band was called ~ because its contour could be taken for a central-branch type.
to correspond to the observed 7.4)A band.
Y"; was supposed
Gerhard' s evidence was upset by the discovery of H.P.S. {.loc. cit. ) that the 7.4)A- band was due to N2
o
5, animpurity arising from the presence of nitrogen in the elec- trical discharge. These authors made a thorough survey of the infra-red spectrum of ozone from l )A to 27)A with a prism spectrometer that could resolve 0.1 )A at 10 ~ • Fig. 26 is reproduced from their paper.
In discussing the new evidence, H. P.
s .
dealtwith all the possibilities:
The symmetric linear model was discarded because its selection rules would not permit the observed combina- tion bands.
The unsymmetric linear model was discarded because the only possible perpendicular vibration, the 14 )A band, did not exhibit a null-branch. Also, Gerhard' s spectra did did not indicate the required uniformly spaced lines.
The equilateral triangle was discarded because the observed bands could not be explained in terms of only one
32
active fundamental frequency.
The next simplest type was the isosceles triangle.
Their calculations yielded the fol lowing possibilities:
(1}
v;
= q-"~r (D) v:z... = I '/.I (D) VJ -= 4.7S"(-z..) o( ~ ~2.0) J ,)
{2)
"·
= Cj.Ct,5r (z) , ¥2..::::: IJ.~(z) j y3 -==- IL/. 4 (D) >o<-=
ZI.Sa(3) )l; -=
q.,
5 _}-A (D) y 7.. = I 3. ~ ( D) y3 -= I «t. 4 (z) , C>(= 32.5°( 4)
Y,
~ LJ,lo 5" r (z) , Y4=1-..,.~ z.) , )13 -= '3.8 (1>) ) o( -= 2S..3°(5)
y;
= Cf.l, S,..u- (D) y-l. = /'f. '-1 (D) JY3 =
11.~ (z), o<.. -= 35".$"0( 6) Y; =
'-1.7S"r
(z.)v'"
-=- <l.G.S(z), Y; = .~.1 (D) I eX -=- I <{ .::> -o(The apex angle is 2- o< ; D denotes doublet type, Z denotes central-branch type.)
(1) was declared improbable because of the unex- pected large intensity of ~ • (2), (3), (4) and (5) were declared improbable because they required the binding between closer atoms to be weaker than that between more separated atoms. This objection was also pointed out by Badger and Bonner (22}
•
H.P.S. concludeu that (6) was the best possibility because:
(aJ The relationship ,of the bond forces was reasonable.
(b) rrhe ~ frequency, 4. 75 )A- , should be close to the fre- quency of the oxygen molecule, 6.3 ,u- •
(c) The 14.1 )A bo.nd is clearly a D-type band.
(d) Gerhard_' s spectrum of the ~. 6 )A- band might be inter- preted to represent a Z-type band, but of this they are not too certain.
(e) The mean molecular heat, 300-476° K, is computed to be 9.8 cal., in fair agreement with 10.9 cal. measured by Lewis and Elbe.
The investigation here reported is not extensive enough to check the interpretations of all the bands. Had the experimental work been extended to other ozone bands, this check could have been obtained.
We can draw two conclusions, however, that uecid- edly strengthen the analysis made by H.P.S. The first is that the design&tion of the 9.6~ band as a Z-type band is in agreement with our line density contour, Fig. 24. rhe increase of almost 50% in density at the central maximum indicates an overlapping of the band by a cemtral branch.
Of course, the amount of this increase should not be taken too literally, it is modified by the ratio between the inten- sities of the overlapping branch and the other lines of the band.
The second conclusion is such as to support the re-
34
jection of the linear model. The line spacing in the br8.nches on either side is approximately .06 em - 1 , on the basis of an estimated optical cross-section of 10 A.U. It is not to be expected, therefore, that the true line spacing in these side branches would be different from .06 cm- 1 by more than a factor of 2. Now, the moment of inertia of a linear ozone molecule would probably be about 100 x lo-40 gm. em • 2 .Accord-
ing to the formula, /J)l =~/41T~Ic
,
this would result in a line spacing, outside the~-branch,
of 0.8cm ~
1 It is exceedingly difficult to reconcile this with the approximateasymmetric rotator model, for each rotational level is split into (2j
+
1) levels, greatly increasing the number of transitions. ~rue, it could also in~icate an equilat- eral triangle configuration, but this was ruled out by other evidence, above.9. Possible Applications &nd Limitations of the Method.
The ultra-spectrometer technique can be used in several ways to interpret molecular spectra~
Before examining an infra-red band in detail, the measurement of the variation of absorption with pressure can serve to distinguish a band due to a heavy molecule from the spectrum of a light one. t'ig. 2 illustrates how bands of heavier molecules saturate at lower pressures than those of lighter molecules. Conversely, the magnitude of the satura- tion pressure can be of use in detecting impurity bands when the impurity is much heavier or lighter than the gas being studied.
The next. most useful attack, is to compute an approximate value of the effective line spacing. This can be done by measuring the variation of the absorption with thickness in the square-root region (at a low pressure) and again in the exponential region (high pressure) . Either a low power spectrometer or a reststrahlen receiver can be used for this purpose. If the value of the spacing turns
out to be much smaller than that computed from
L1
y= Jt./LJ-rrz.I
c_ Jit can be concluded th&t the j-levels are not single but multiple. This would indicate a perpendicular band of a symmetrical-top molecule, or a band of an asymmetrical-top molecule. The band would probably not be~ong to a linear
or spherical molecule, nor would it be the parallel band of a symmetrical top. Of course, allowance must be made for
possible large line densities in certain portions of the band even if the j-levels are single. For example, a cen- tral branch would introduce a large line density, or a band of a linear molecule with large vibration-rotation interac- tion might have a region of line convergence or parabolic return of the rotation lines. If the "effective"spacing is too large by a factor of two or three, the discrepancy may easily be due to fluctuating intensities in the rotational lines arising because of nuclear symmetries. In the limit- ing case, the effective spacing would equal the spacing be- tween the lines of dominant intensity.
Further information about the band structure can then be deduced from a complete density contour of the band.
As shown in this research, a central-branch band may be dis- tinguished from a doublet type. The ultra-spectrometer
method does not necessarily require as much work as was done in this thesis. Reduced to essentials:
1. Determine the appropriate region of pressure-saturation and the pressure region in which the square-root law ob- tains: the high ~nd the low pressure regions.
2. Measure the variation of absorption with thickness at one high pressure and at one low pressure.
3. Calculate from the slopes of the two curves the ratio of half-width to spacing, and using the calculated Lorentz width, obtain the spacing.
The methoa obviously has certain limitations. For
instance, an unduly large (or small} collision diameter may be lead to a too large (or too small) value of the
spacing. But this does not invalidate the comparison be- tween line spacings in different parts of the band, or possibly, between bands of the same molecule.
The method is also affected by fluctuations in line intensities. Another weak spot is the uncertainty of applying the calculations to the wings of the band where intensities are sharply dropping off.
A more serious limitation is the possibility that other line-broadening agencies are present: for example, at high temperatures or at very low pressures the Doppler width becomes comperable with the Lorentz width, or, in the case of molecules with strong fields, Van der Waals or Stark- effect broadening may enter. But even these factors do not destroy the usefulness of the method. The qualitative con- clusion, that those portions of the band in which the lines are more closely spaced will exhibit the more rapid pressure saturation, cannot be denied. If other types of broadening do enter, it is only the quantitative result that is uncer- tain. These other types of broadening can be detected, more- over, by the square-root test: at low pressures, it is the Lorentz shape which causes the absorption to be proportional to the square-root of thickness.
tional line spacing of a band, the effect of pressure on band absorption is applicable to the problems of absolute intensi- ties Lnd of line shapes.
The subject of the intensities of lines and bands is one that has been considerably neglected. This is so, partly because of the greater difficulty of measuring intensities, and partly because the theory of transition probabilities has not been developed as vigorously as that of transition frequen- cies. However, it may be expected that both the theoretical and experimental study of spectral intensities will be stimula- ted when science turns to the problems of matter under extreme or unusual conditions.
For example, some aspects of electric arcs are attract- ing the attention of banq spectroscopists: it is found, for instance, by means of the relative intensities of lines and bands, that the popu~ation distribution among the molecular states shows an anomalous departure from temperature equili-
(23}
brium. Of similar interest is the state of gases at high temperature and pressure that exists in the internal combus- tion engine. The development of high temperature by explo- sions and combustion o~ fuels is a field where spectroscopic stuuies of the transfer of energy into rotational and vibra- tional states are of interest. Perhaps the population of the states of a gas going through a shock-wave can be studied in
this manner. Applied physics is full of problems for the band spectroscopist interested in spectral intensities.
The present work is not directly applicable to all of these fields, but it does show how reliable inten- sity measurements may be made at ordinary conditions. The gas in question h&s merely to be subjected to increasing pressure by means of a neutral gas until the lines have broadened sufficiently for the pressure-effect to become negligible. Then, as shown in this paper, the absorption becomes exponential and the absorption coefficient may be integrated to obtain the total intensity of the band.
The subject of line shapes, especially in the infra-red, can also be treated by these methods. The ques- tion of what shape a line has, and what the broadening agen- cy is, can be studied by measuring the dependence of band
{ 3)
absorption on thickness and pressure. Matheson has shown in this marmer that the 4. 7_)-J- band of CO is composed
of lines having the Lorentz shape. In this thesis, the agree- ment
or
the curves of Fig. 21 with the square-root law indi- cates a Lorentz shape ,for theo
3 9.6JUL band.Other types of mo~ecules can be studied similarly.
It would be of interest to see the deviations, if any, from Lorentz broadenint:> in spectra of heavy molecules, molecules with peculiar symmetries, molecules with strong polar fields, etc. For instance, unpublished results of ur. John utrong on the pressure-effect of the
IIJA
vibration ofc
2 H64- o
which has been identified( } as the bending
fre~uen ce
ofthe C - C bond, indicate either that the ethane lines have- n't the Lorentz shape or that there is a background of very closely spaced lines as yet unrevealed by the spectrometer. However, more work has to be done on this. Another anomalous
(25)
case is that of the HCN band at l.;U- • 'l'he line width has been found to increase with pressure more rapidly than the Lorentz theory, and is much greater with HCN pressure than an equivalent air pressure. It has not yet been explained.
Line shapes can be studied in still another way.
v~
e may ca 11 it a tri'est for .:.>imi lari ty of LineShape s~
Considera band of lines of possibly varying intensities but constant spacing. Assume the v&riation of line intensity across the band is slow enough that the lines within the slit widt~ are of practic8.lly the same intensity. Then, if at a given
pressure all the li.:.1es have the same shape except for the in- tensity factor (i.e. , the same half-width, etc. ), the varia- tion of absorption with thickness at the different wavelengths will be similar. That is, if the curve at the center of the band is represented by,A1
=
f(x) , the edge of the band will be represented by A2 ~
f
(c. x) • Proof of this, and the appli- ccttion of the test to the ozone band are given in Appendix G.Obviously, the most frui tful application of this method is to the simpler gases, whose molecular bands have smooth intensity distributions and fairly constant spacings. For instance, the similarity of lines could be studied in CO, or
co
2, or the 10~bands of the methyl halides, etc.
In conclusion, we have shown the possibility of using the effect of pressure on band absorption as an ultra- spectrometer technique to aid in the analysis of infra-red
~pectra, greatly extending the usefulness of low power spec- trometers. We have also shown how spectral intensities can be determined, and suggested applications to physical prob- lems. Finally, band absorption experiments can be used to examine line shapes.