One such mystery is how the size of the nanoparticle tunes its ability as a catalyst. To begin to understand how size affects the ability of the nanoparticle as a catalyst, two different series of nanoclusters were observed. Unlike previous studies, all the nanoparticles in the series have the same ligand to minimize ligand effects and concentrate on the effect of size.
The results suggest that as the size of the AuNM increases its ability as a catalyst, so does it, implying that these studies could potentially be used to guide the design of efficient fuel cells. However, when precision nanoparticles were synthesized and studied, it was noticed that when metal nanoparticles are smaller than 3 nm, other factors, such as quantum size, begin to influence the behavior of the nanoparticle. Once the overall structure of nanoparticles of different sizes and shapes was determined, it would be possible to learn how ligands protect the core; understand material properties at the atomic level through correlation with structure; and further discuss size dependence and shape control, etc.7 Although the precise formula for a nanocluster can be determined, the question of how the size of the nanoparticle tunes the catalyst still remains.
Thiol Protected Clusters
Introduction
In alkaline media, however, the half-reactions may be written slightly differently, but they mean essentially the same thing. Because the oxygen reduction reaction is one of the most kinetically difficult components of efficient devices, they must operate under very small overpotentials close to zero. However, in practice this is difficult to find, as the reaction is both irreversible and energetically demanding, requiring the selective and efficient transfer of 4 electrons, where large overpotential values may be required.
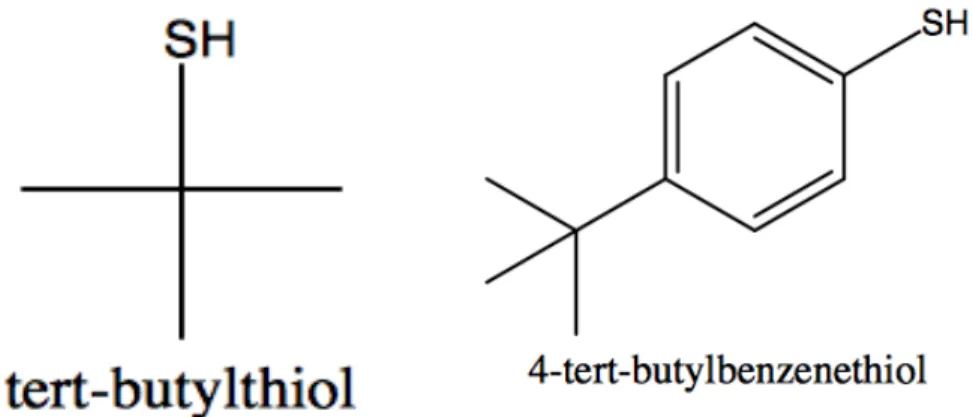
When ORR chemistry is done using platinum as a catalyst, the platinum catalysts help promote the reaction to occur through the 4-electron orbital, which in ORR chemistry is how catalysts are compared, as the most efficient catalysts oxygen via the 4-electron orbital over the 2-electron orbital. When ORR chemistry is done using platinum as a catalyst, the platinum catalysts help promote the reaction that occurs through the 4-electron pathway, which in ORR chemistry is how catalysts are compared since the most efficient catalysts oxygen via the 4-electron orbital over the 2-electron orbital. The figure above is of the structures of the ligands used in the two series.
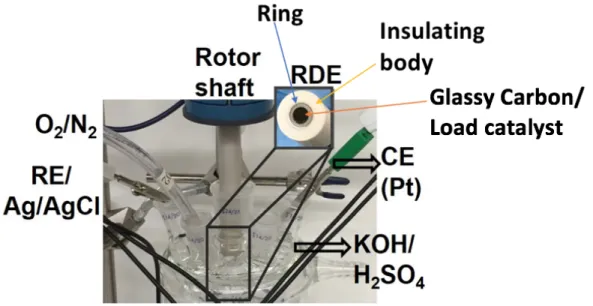
KOH is used for all ORR experiments, while H2SO4 can be used for hydrogen evolution reactions (HER). The yellow arrow points to the insulating body, which is the white part of the electrode. OCP is a measure of the potential when no current flows through the cell and is used to model the equilibrium state.
In the mixed kinetic diffusion regime of the ORR, the kinetics can be described by Koutecký-Levich (K-L) analysis of the data and expressed as:16. Plot of inverse current vs inverse square root of electrode rotation rate from the K-L equation gives linear lines where the inverse of the slopes gives the values of B in equation 4 from which the number of transferred electrons (n) can be calculated.
Materials and Methods
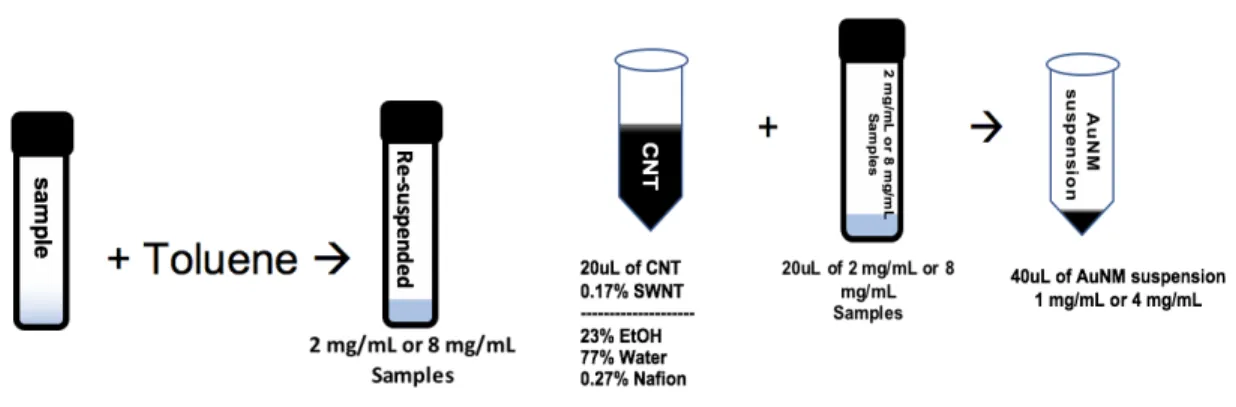
The AuNM/SWNT suspension was cast onto the RDE and dried under N2 gas until it was completely dried and appeared as a thin film. The figure above shows a visual representation of the sample preparation process and is shown to clarify the methods mentioned above and below for both batches. For Series 2, all samples were prepared by Arjun Sakthivel of the Dass Research Group.
To prepare a sample for testing, one of the samples was collected and then resuspended with toluene to a concentration of 2 mg/mL. Equal amounts of sample and CNTs were then added and briefly sonicated and vortexed. After vortexing, 10 uL of the AuNM/SWNT suspension was cast onto the RDE and dried under N2 gas until it was completely dried and appeared as a thin film.
After all samples were completed, industry standard Pt/C was prepared and also tested under the same conditions so that comparisons could be made. Therefore, for series 1, Pt/C was also suspended in toluene at a concentration of 2 mg/mL and for series 2 at a concentration of 8 mg/mL. 20 uL of the Pt/C mixture was added to an Eppendorf and then 20 uL of the CNT-free mixture was added.
From here, the same procedure used for the samples was used for Pt/C, with all ORR experiments performed in the same manner. All data were then graphed together so that they could be compared with each other and the Pt/C.
Results and Discussion Series 1
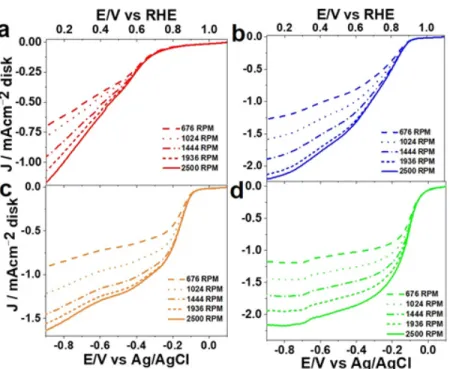
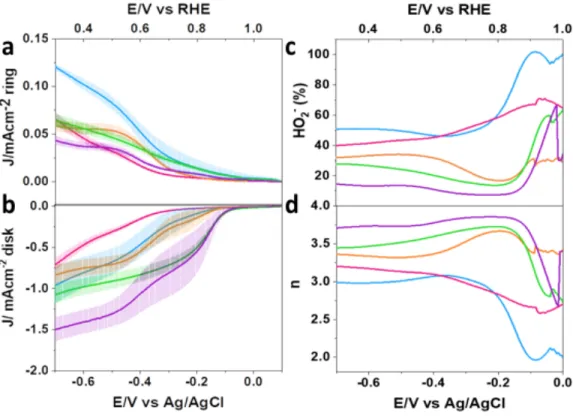
Based on the findings, it is believed that most of the oxygen is being reduced via the 2-electron pathway that produces the peroxide anion. Graph a is the ring data graph while graph b is the disk data graph. Based on the plots in Figure 7, the range of linearity was determined so that linear K-L plots could be constructed.
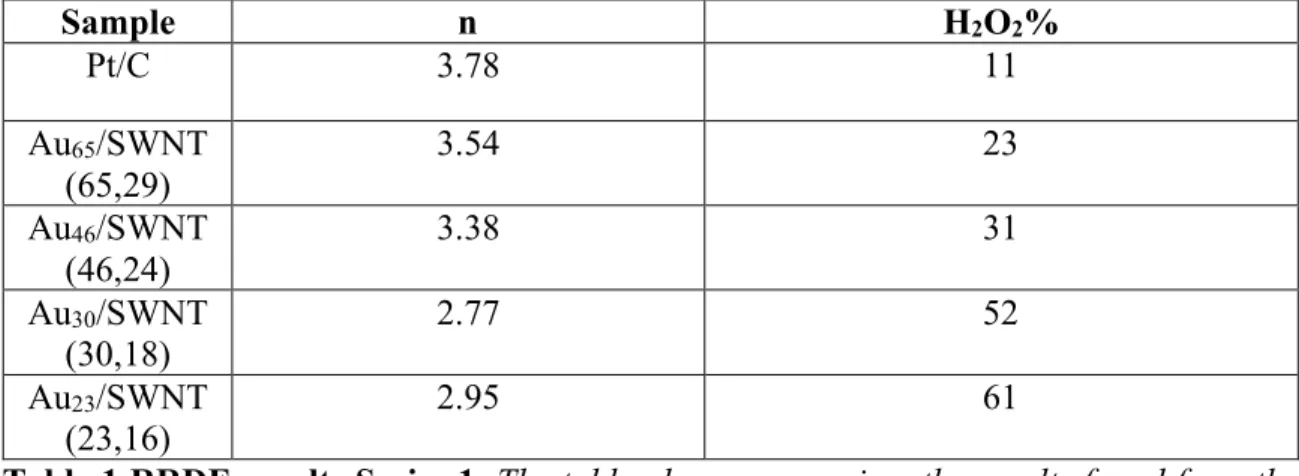
The KLRDE plots shown in Figure 7 were then linearized by plotting the inverse square root of the rotational speed against the inverse current density in amperes. In the linear region, the slope of the line, the intercepts, and equations 3, 5, and 6 can be used to calculate the equilibrium rate constant of electron transfer, peroxide production, and electron transfer. In general, this means that the largest sample transfer rate constant was about 23 times larger than that of the smallest and about twice as large as that of the next smallest, while the two larger catalysts were very similar.
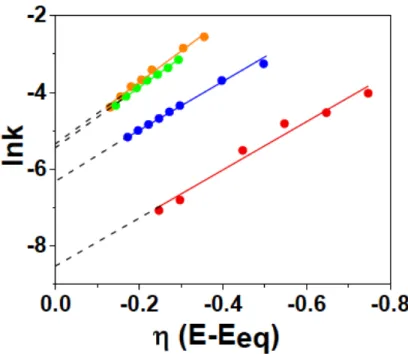
These plots were then used to create the linear Koutecký-Levich plots shown in Figure 8. The figure above is a lnk vs 𝜂 plot for the data from the K-L plots in Figure 8. The intersections of the lines come corresponds to lnk0 and the slope area is proportional to the transfer coefficient 𝛼.
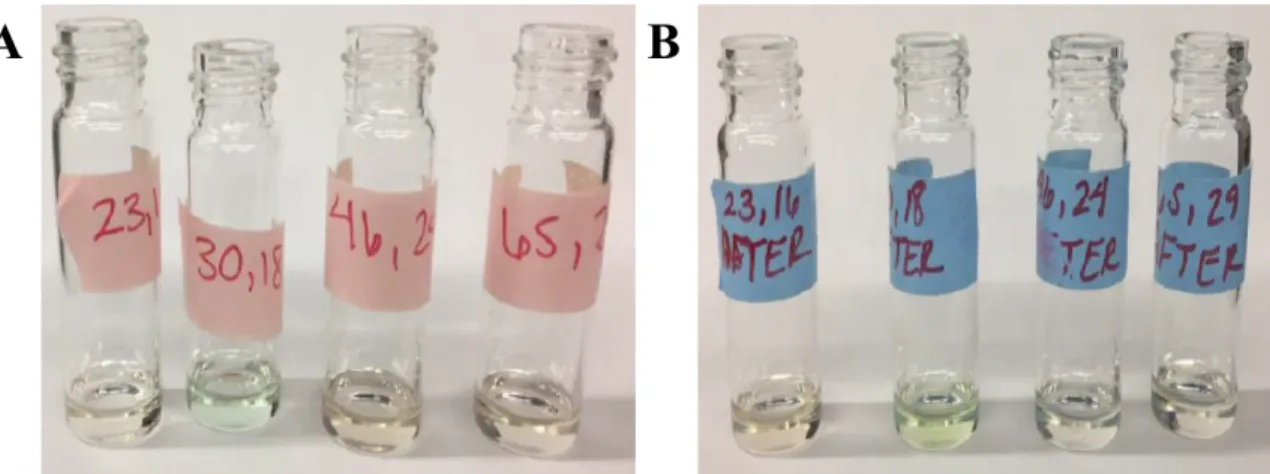
In comparison to all the samples tested, a control was also run under the same conditions. Since the solutions matched in color, it was determined that the sample remained unchanged after catalysis as shown in Figure 10.
Results and Discussion Series 2
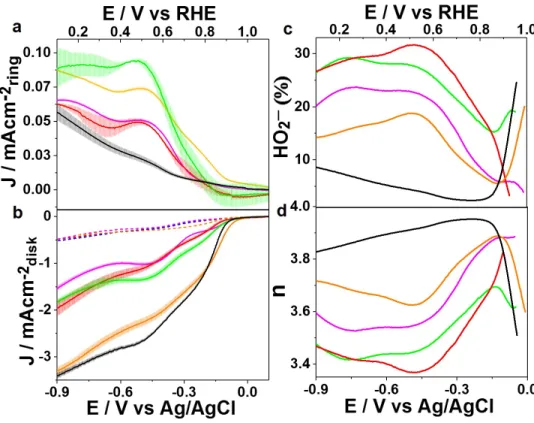
Au133, showed Eonset values of 0.92 V and 0.94 V, respectively, which fall between the largest and smallest sized AuNMs in a manner indicative of size correlation. Graph a is a graph of ring currents, while graph b is a graph of disc currents. Plots c and d show the number of electrons transferred and the percentage of HO2- calculated from eqs 1 and 2 and plotted in the Eonset potential window up to 0.064 V (vs. RHE).
Although various factors of the metallic core, including the stability, core size, and surface-to-volume ratio play a critical role in determining the resulting catalytic behavior, the ligand environment can tune. Furthermore, both transfer rate constant and overpotentials show a tendency for the smallest nanocluster to show both the largest rate transfer constant and the smallest overpotential value. In general, parts of the data such as overpotential and transfer rate constant suggest that the trend for this particular series appears to be that the smallest cluster shows the greatest activity, which is in contrast to the results from Series 1.
For the low overpotential range, all the slope values are close to the theoretical value of 59 mV/des29 which corresponds to a two-electron transfer which is the rate-determining step (RDS). It is possible that in the low overpotential region the RDS of the ORR process is controlled by the transfer of two electrons from the AuNM electrocatalysts to the substrate O2. In the high overpotential region, slope values for Au44 could not be obtained due to the diffusion-controlled nature of the K-L plots Tafel slopes in this window.
Since it is desirable for the development of efficient ORR electrocatalysts to operate under diffusion-controlled conditions with minimal dependence on reaction kinetics, it can be concluded that Au44 is promising as a potential ORR electrocatalyst. In Figure 15 above, the overvoltage values have been used to produce a graph where the slope of the lines allows the transfer coefficient to be calculated. The chronoamperometry graph above shows the endurance of the catalysts over a tested period of 6 hours at a constant potential of 0.46 V.
To test the durability of the catalytic converters from the original set, chronoamperometry was used.
Conclusion
After a test period of 6 hours with little or no change in current density, it was concluded that all the catalysts during the test period showed stable current density at 0.46 V. This data suggests that the catalysts are durable throughout the test period and is shown in Figure 16. Furthermore, the largest NM only requires an overpotential of 80mV to reach a current density of -1 mA/cm2 with a rotation speed of 2500 rpm.
However, the smaller NM requires 680 mV to achieve a similar current density under the same conditions. The data suggest that AuNM with larger size produces higher ORR activity compared to that of smaller one. However, while these results presented here are similar to what was recently produced by Jin and co-workers on a different series of AuNMs,29,30,31 they contradict previous ORR studies where larger size NMs small showed the highest catalytic activity.32. 33.
For batch 2, the initial batch of Au28, Au44, Au133, and Au279 showed that there were some size correlations that were found, with the largest NM Au279 showing the highest onset potential and being the most selective for O2 reduction resulting in ~90% . Since Au279 has an onset potential of 0.96 V, higher than that of the commercial 20% Pt/C sample and other industrial catalysts, it is suggested that Au279 may have potential as a good ORR catalyst. However, upon reanalysis using the more mathematically sound method of linear K-L plots and the modified Au28, Au36, Au133, and Au279 series, the findings strongly contradicted each other.
It was found that for the modified series and the reanalyzed data, in some cases the smallest nanocluster showed the highest activity, such as with the smallest overpotential value and the largest transfer rate constant. Moreover, in terms of electron transfer and peroxide production, the two medium-sized clusters exhibit the highest electron transfer and lowest peroxide production.