These events significantly affect the welfare of the United States and the rest of the world, but are largely external to the United States. These topics are discussed in several new sections and case studies in the business and finance section of the text.
International Trade Policy
The Globalization of the World Economy
The world is rapidly globalizing and this presents many opportunities and great challenges to the nations and people of the world. We begin our study of international economics with a brief overview of the globalization revolution taking place in the world today.
A We Live in a Global Economy
CASE STUDY 1-1 The Dell PCs, iPhones and iPads sold in the United States are anything but American. Kraemer, ''Dell Computer: Organization of a Global Production Network'' and ''Globalization of the Personal Computer Industry: Trends and Implications'' Working Paper, Irvine, CA: Center for Research on Information Technology and Organizations (CRITO ), University of California, Irvine, 2002; “The Laptop Trail,” The Wall Street Journal, June 9, 2005, p.
B The Globalization Challenge
The Automobile Labeling Act of 1992, which requires all automobiles sold in the United States to indicate what percentage of the automobile's parts are domestic or foreign. Ford designs its cars in six countries (US, UK, Germany, Italy, Japan and Australia), has manufacturing facilities in 30 locations (3 in North America, 3 in South America, 7 in Asia and 17 in Europe) and employs more workers outside the US.
International Trade and the Nation’s Standard of Living
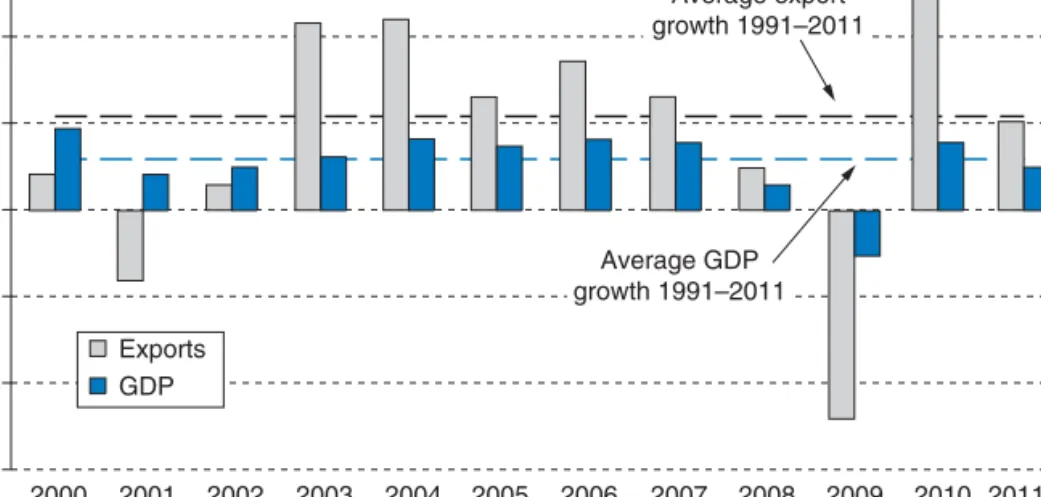
This has certainly been the case for the United States during the past four decades (see Case Studies 1-4). CASE STUDY 1-4 Increasing Importance of International Trade to the United States After remained at between 4 and 5 percent dur-.
The International Flow of Goods, Services, Labor, and Capital
For example, if the United States stimulates its economy, some of its citizens' increased demand for goods and services spills over into imports, which stimulate the economies of other countries that export those goods. On the other hand, an increase in US interest rates is likely to attract funds (capital) from abroad and increase the international value of the dollar.
A The International Flow of Goods and Services
Finally, trade negotiations that reduce trade barriers across countries may lead to an increase in exports of high-tech goods (such as computers) and thus to an increase in employment and wages in those industries in the United States, but also to an increase in importing footwear and textiles, thereby reducing employment and wages in those sectors. So we see how closely connected, or interdependent, nations are in today's world and how government policies aimed at solving purely domestic problems can have significant international repercussions.
B The International Flow of Labor and Capital
International Economic Theories and Policies
A Purpose of International Economic Theories and Policies
International economic theory also examines the effectiveness of macroeconomic policies under various types of international monetary arrangements or monetary systems. These contributions prove the vitality and importance of the international economy as a special branch of the economy.
B The Subject Matter of International Economics
Starting with the simplifying assumptions just mentioned, international economic theory examines the basis for and the gains from trade, the reasons for and the effects of trade restrictions, policies aimed at regulating the flow of international payments and receipts , and the effects of these policies on a people's welfare and on the welfare of other nations. International economic relations differ from interregional economic relations (i.e. the economic relations between different parts of the same nation), which therefore require somewhat different tools of analysis and justify international economics as a distinct branch of economics.
Current International Economic Problems and Challenges
In studying the pure theory of international trade in part one (chapters 2-7) we see that the best policy for the world as a whole is free trade. The United States faces deep structural imbalances in the form of excessive spending and inadequate national savings.
Organization and Methodology of the Text
A Organization of the Text
Part Four (Chapters 16–21) examines the various mechanisms for adjusting balance of payments imbalances, often referred to as open-economy macroeconomics. The reason for this is that one must understand the nature of the problem before seeking appropriate policies for its solution.
B Methodology of the Text
In Chapter 2 we begin our presentation of the pure theory of international trade and present the law of comparative advantage. Do you remember the meaning of the elasticity of demand. the law of diminishing returns.
APPENDIX
Introduction
In this chapter we examine the development of trade theory from the seventeenth century to the first part of the twentieth century. Ricardo had based his explanation of the law of comparative advantage on the labor theory of value, which was subsequently rejected.
The Mercantilists’ Views on Trade
In the first part of the twentieth century, Gottfried Haberler came to Ricardo's "rescue" by explaining the law of comparative advantage in terms of opportunity cost theory, as reflected in production possibility frontiers, or transformation curves. CASE STUDY 2-1 Munn's Mercantilist Views on Trade Thomas Munn was perhaps the most influential of the mercantilist writers, and his Treasury of England's Foreign Trade was the outstanding exposition of mercantilist thought on trade.
Trade Based on Absolute Advantage: Adam Smith
In recent years there have been disputes between the United States and the European Union (EU) over the latter's ban on American
A Absolute Advantage
Free trade would make the world's resources used more efficiently and maximize world welfare. As such, trade restrictions benefit few at the expense of many people (who will have to pay higher prices for competing domestic goods).
B Illustration of Absolute Advantage
If the United States exchanges six bushels of wheat (6W) for six yards of British cloth (6C), the United States gains 2C or saves half an hour or 30 minutes of labor (since the United States can only exchange 6W for 4C domestically) . The same six hours can produce 30°C in the UK (6 hours times 5 meters of dust per hour).
Trade Based on Comparative Advantage
With trade, the United States would specialize in the production of wheat and exchange some of it for British cloth. The fact that the United Kingdom wins far more than the United States is not important at this time.
A The Law of Comparative Advantage
The United Kingdom thus now has an absolute disadvantage in the production of both wheat and cloth compared to the United States. At the same time, the United Kingdom specializes in the production and export of fabric.).
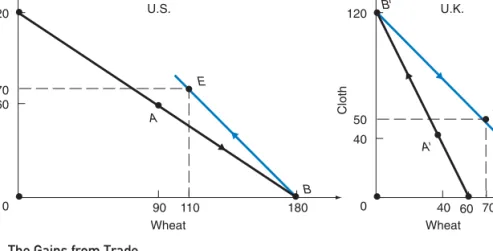
B The Gains from Trade
On the other hand, in the UK 6W=12C (in the sense that both require 6 hours to produce). To summarize, the United States wins to the extent that it can trade 6W for more than 4C of the United Kingdom.
C The Case of No Comparative Advantage
So far, the benefits of specialization in manufacturing and trade have been measured in terms of fabric. However, the profit from trade could also be measured exclusively in wheat or, more realistically, in both wheat and dust.
D Comparative Advantage with Money
From table 2.3 we can see that the dollar price of wheat (the commodity in which the United States has a comparative advantage) is lower in the United States than in the United Kingdom. As a result, the dollar price of fabric in the United Kingdom is lower, so the United Kingdom can export fabric to the United States.
Comparative Advantage and Opportunity Costs
A Comparative Advantage and the Labor Theory of Value
In particular, labor is not the only factor of production, nor is it used in the same fixed proportion in the production of all commodities. It is worth noting that Ricardo himself did not believe in the labor theory of value and only used it as a simple way to explain the law of comparative advantage.
B The Opportunity Cost Theory
Since neither of these assumptions is true, we cannot base the explanation of comparative advantage on the labor theory of value. In addition, there is usually some degree of interchangeability between labor, capital, and other factors in the production of most goods.
C The Production Possibility Frontier under Constant Costs
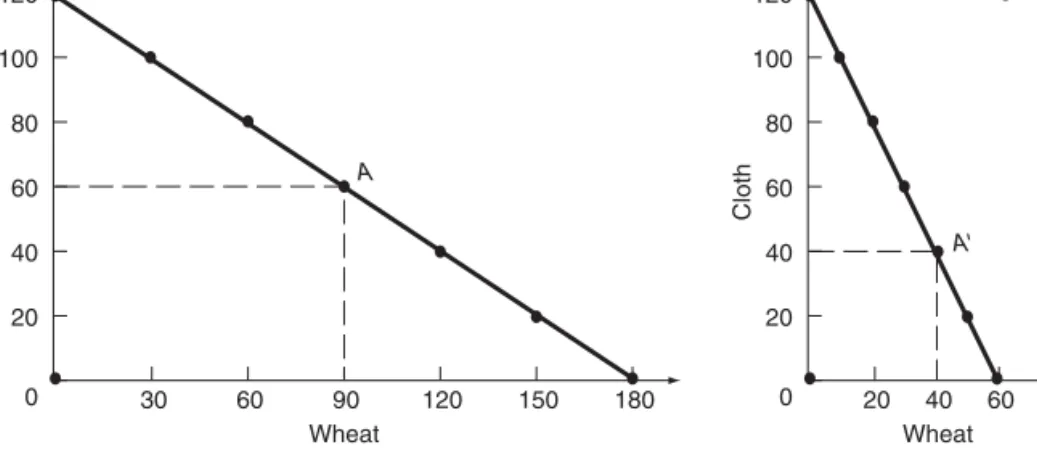
Schedule production options for wheat and cloth in the United States and the United Kingdom. Thus, the opportunity cost of one unit of wheat in the United States is 1W=2/3C (same as in Table 2.2) and remains unchanged.
D Opportunity Costs and Relative Commodity Prices
So we have constant cost in the sense that the same amount of one commodity must be given up to produce each additional unit of the second commodity. Although opportunity costs are constant within each nation, they vary between nations, providing the basis for trade.
The Basis for and the Gains from Trade under Constant Costs
A Illustration of the Gains from Trade
This means that in the absence of trade, the United States produced 90W and the United Kingdom 40W, for a total of 130W. Similarly, in the absence of trade, the United States produced 60C and the United Kingdom 40C, for a total of 100C.
B Relative Commodity Prices with Trade
Remember, in the absence of trade, the United States would not specialize in wheat production because it also wanted to consume some dust. Similarly, the United Kingdom would not specialize in cloth production if there was no trade, as it also wanted to consume some wheat.
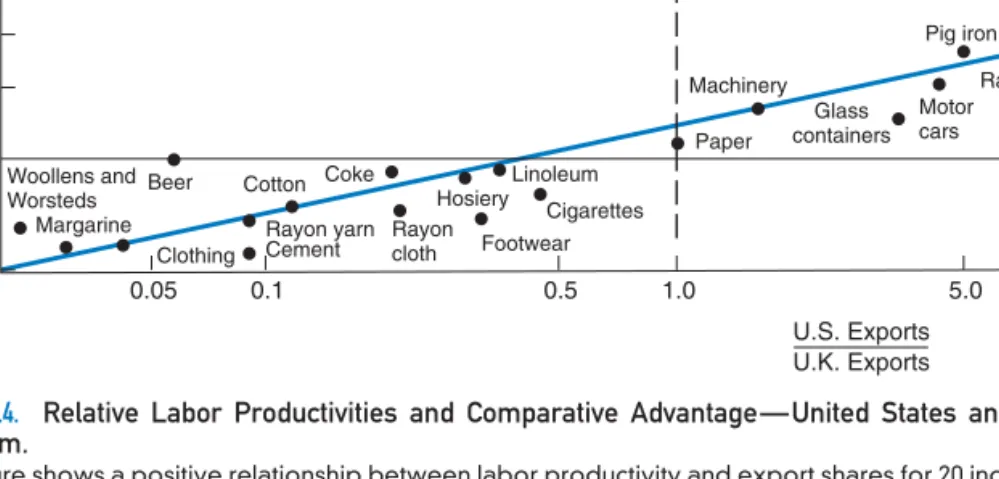
Empirical Tests of the Ricardian Model
That is, the output of the same industry in the United States and the United Kingdom is not homogeneous. On graph paper, draw the production frontiers of the United States and the United Kingdom.
Introduction
Understand how relative commodity prices and countries' comparative advantage are determined under rising costs. Explain the relationship between international trade and deindustrialization in the United States and other developed countries.
The Production Frontier with Increasing Costs
A Illustration of Increasing Costs
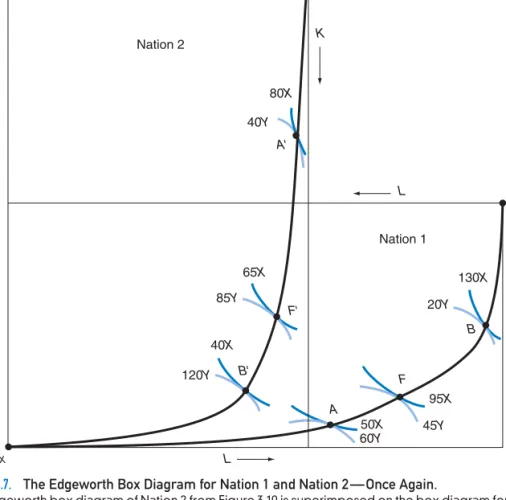
However, instead of showing this for Nation 1, we demonstrate increasing opportunity costs in the production of Y with the production frontier of Nation 2 in Figure 3.1. Thus, concave production frontiers for Nation 1 and Nation 2 reflect increasing opportunity costs in each nation in producing both commodities.
B The Marginal Rate of Transformation
As we move up from point A along country 2's production frontier, we see left-pointing arrows of increasing length, reflecting the increasing quantities of X that country 2 must give up to produce each additional batch of 20Y.
C Reasons for Increasing Opportunity Costs and Different Production Frontiers
As a result, the opportunity cost of milk will increase and the production frontier will be concave from the origin. In the real world, the production frontiers of different countries will usually differ, since virtually no country has the same factors (even if they might have access to the same technology).
Community Indifference Curves
Thus, the opportunity cost of milk relative to the amount of wheat given up is initially small. The difference in the production frontiers for Nation 1 and Nation 2 in figure 3.1 is due to the fact that the two nations have different factor endowments or resources at their disposal and/or use different technologies in production.
A Illustration of Community Indifference Curves
As the supply or availability of factors and/or technology changes over time, a country's production frontier shifts. Community indifference curves are downward or negatively sloping and convex from the origin; to be useful, they must not cross each other.
B The Marginal Rate of Substitution
A society's indifference curve shows the different combinations of X and Y that give the same satisfaction to the society or nation.
C Some Difficulties with Community Indifference Curves
However, a particular set or map of community indifference curves refers to a particular distribution of income within the country. In that case, we could not use community indifference curves to determine whether opening or expanding trade increased the nation's welfare.
Equilibrium in Isolation
Thus, trade will change the distribution of real income in the country and may cause indifference curves to intersect. Alternatively, we can make a number of restrictive assumptions about tastes, incomes, and consumption patterns that would preclude the intersection of community indifference curves.
A Illustration of Equilibrium in Isolation
A different income distribution would result in an entirely new set of indifference curves, which may intersect the previous indifference curves. On the other hand, the nation cannot achieve higher indifference curves with currently available resources and technology.
B Equilibrium-Relative Commodity Prices and Comparative Advantage
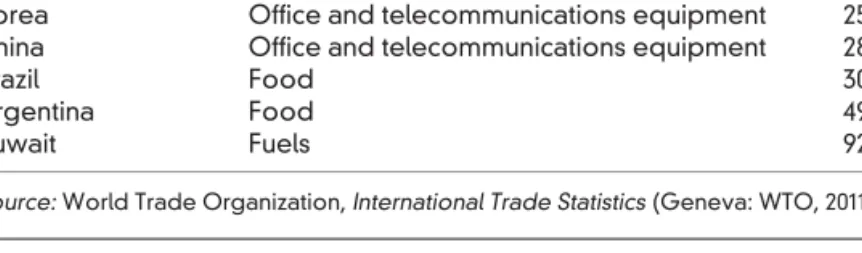
The equilibrium relative price of X in country 1 is given by the slope of the tangent line common to its production frontier and the indifference curve I at point A. Comparative advantage of the United States, the European Union, Japan, China, Brazil, and Korea in 2010.
The Basis for and the Gains from Trade with Increasing Costs
CASE STUDY 3-1 The Comparative Advantage of Larger Advanced and Developing Economies Table 3.1 gives some of the products produced. Case study 3-1 gives the comparative advantage of the largest advanced and developing market economies in manufactured goods.
A Illustrations of the Basis for and the Gains from Trade with Increasing Costs
Starting from point A (the equilibrium point in isolation), as Nation 1 specializes in the production of X and moves to its production frontier, it incurs an increase in the opportunity costs of producing X. This is reflected in the decreasing slope of its marginal production (a reduction in the opportunity cost of X, which means an increase in the opportunity cost of Y).
B Equilibrium-Relative Commodity Prices with Trade
Starting at point A, as Nation 2 specializes in the production of Y and moves up along its production frontier, it experiences rising opportunity costs in producing Y. This process of specialization in production continues up to the relative prices of goods (the slope of production frontiers ) become equal in both nations.
C Incomplete Specialization
Once the equilibrium relative price with trade is determined, we will know exactly how the gains from trade are divided between the two countries, and our trade model will be complete. The increase in consumption from point A (in autarky) to point Tre represents a gain due to exchange only.
D Small-Country Case with Increasing Costs
E The Gains from Exchange and from Specialization
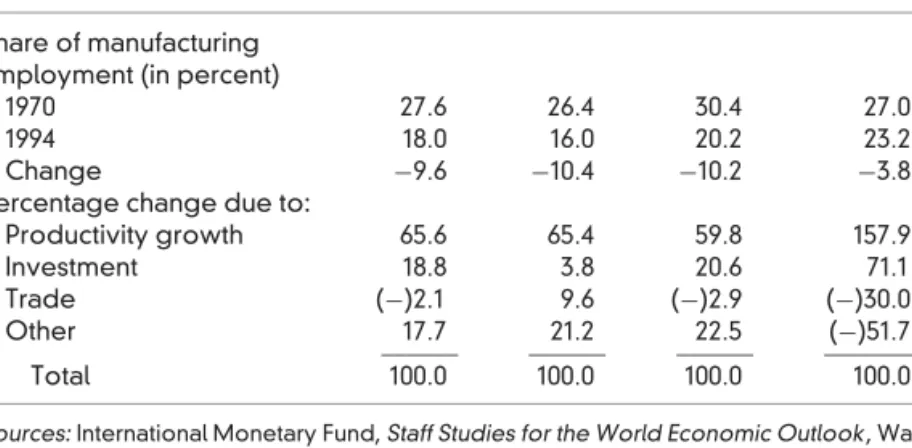
However, during the past decade, large trade deficits as well as the electronic revolution have led to far more job losses than gains in the United States. CASE STUDY 3-4 International trade and deindustrialization in the United States, the European Union, and Japan.
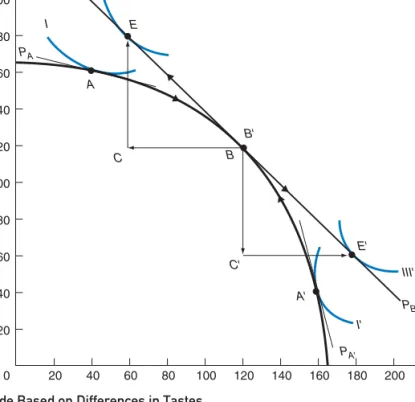
Trade Based on Differences in Tastes
A Illustration of Trade Based on Differences in Tastes
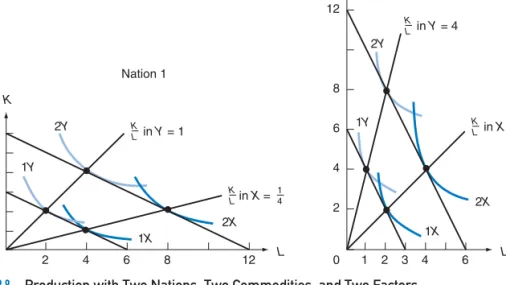
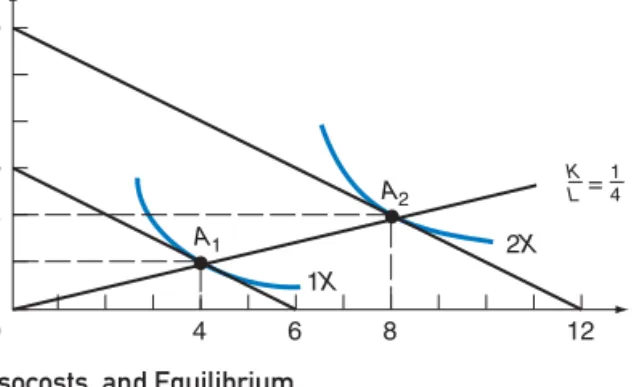
With the opening of trade, Nation 1 specializes in the production of X (and moves down its production frontier), while Nation 2 specializes in Y (and moves up its own production frontier). As a result, the K/L ratio would increase in both nations in the production of both goods.
Introduction
Show how the equilibrium price at which trade takes place is determined by supply and demand. Explain the meaning of the terms of trade and how they have changed over time for the United States and other countries.
The Equilibrium-Relative Commodity Price with Trade—Partial Equilibrium Analysis
At P2, the quantity of imports of commodity X demanded by Nation 2 (BE in panel C) is equal to the quantity of exports of commodity X supplied by Nation 1 (BE in panel A). On the contrary, at PX/PY < P2, the quantity of imports of commodity X demanded exceeds the quantity of exports supplied, and PX/PY will rise to P2.
Offer Curves
A Origin and Definition of Offer Curves
B Derivation and Shape of the Offer Curve of Nation 1
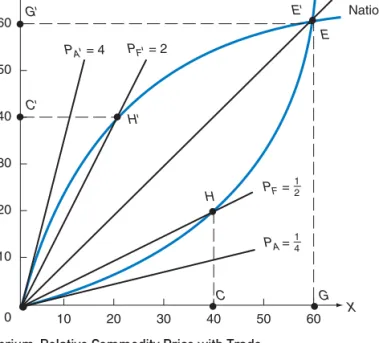
At PF=1/2 in the left panel, nation 1 would instead move from point A to point F in production, exchanging 40X for 20Y with nation 2 and reaching point H. Connecting the origin to points H and E in the right panel, we generate nation 1's supply curve.
C Derivation and Shape of the Offer Curve of Nation 2
This shows how many imports of good Y Nation 1 requires to be willing to export different amounts of good X. AtPF=2 in the left panel, Nation 2 would move instead of producing from AtoFin, exchange 40Y for 20X with Nation 1 and would reach H.
The Equilibrium-Relative Commodity Price with Trade—General Equilibrium Analysis
For example, at PF = 1/2, the 40X exported by country 1 (see point H in Figure 4.5) would lag behind the imports of good X demanded by country 2 at this relatively low price of X. This is given by the point , which is not shown in Figure 4.5, where the extended price line PF crosses the extended supply curve of country 2.). For any PX/PY<1, the quantity of exports of good X supplied by country 1 would be less than the quantity of imports of good X demanded by country 2.
Relationship between General and Partial Equilibrium Analyses
Thus, the relative price of X gravitates toward the equilibrium price of PX/PY = 1, given by point E in Figure 4.6 (same as in Figure 4.5). On the other hand, the partial equilibrium analysis of Figure 4.6, which uses D and S curves, does not take into account these repercussions and the connections that exist between the market for commodity X and the market for all other commodities in the economy .
The Terms of Trade
Going back to our Figure 4.6, we see that it shows the same basic information as Figure 4.5, and both are derived from the nations' production frontiers and indifference maps. This is important because changes in the market for commodity X affect other markets, and these can give rise to significant consequences for the market for commodity X itself.
A Definition and Measurement of the Terms of Trade
If, on the other hand, Nation 2 were small, its demand curve for Nation 1's exports of commodity X would intersect the horizontal portion of Nation 1's supply curve of exports of commodity X (near the vertical axis). This can also be shown with supply curves; see Problem 10, with the answer on the web.).
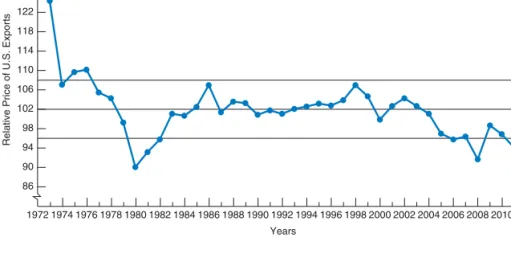
B Illustration of the Terms of Trade
CASE STUDY 4-4 Terms of Trade of Developed and Developing Countries Table 4.3 gives the terms of trade of developed countries. A detailed analysis and data on the forces determining the terms of trade of developing countries are presented in Chapter 10.
C Usefulness of the Model
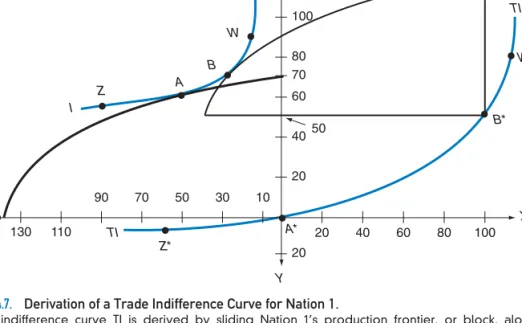
Country 1's bid curve in Quadrant 1 of Figure 4-10 is derived from its trade indifference map in Figure 4-9. Note that Nation 1's offering curve curves in the same direction as the community's indifference curves.
Introduction
The chapter concludes with Section 5.6, which reviews empirical tests of the Heckscher–Ohlin trade model. The appendix presents the formal derivation of the factor-price equalization theorem and introduces more advanced tools to empirically test the Heckscher-Ohlin trade model.
Assumptions of the Theory
A The Assumptions
B Meaning of the Assumptions
So if factor prices were the same in both countries, producers in both countries would use exactly the same amount of labor and capital in the production of each commodity. So if the relative commodity prices in the two nations are equal (as in free trade, for example), both nations X and Y will consume in the same proportion.
Factor Intensity, Factor Abundance, and the Shape of the Production Frontier
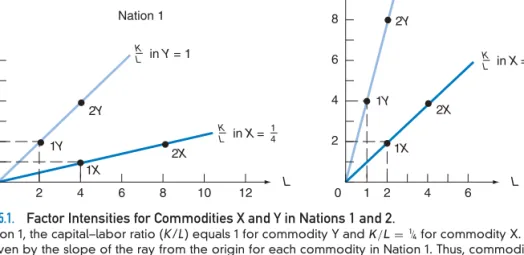
A Factor Intensity
If r/w decreased, producers would replace K with L in the production of both commodities to minimize their production costs. Producers would substitute labor for capital in the production of both commodities to minimize their costs of production.
B Factor Abundance
If the relative price of capital falls, producers will substitute Lin's production of both goods in order to reduce their production costs. We will assume this to be the case for the rest of the chapter, unless specifically stated otherwise.
C Factor Abundance and the Shape of the Production Frontier
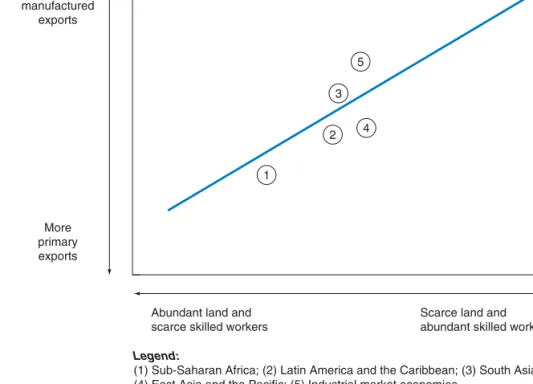
CASE STUDY 5-1 Relative Resources of Different Countries Table 5.1 shows the share of resources in the world. Japan has a relatively large (and we expect to have a comparative advantage) capital-intensive products and products that require extensive use of R&D scientists and a highly skilled workforce; the UK appears to be relatively devoid of broadly defined factors (in fact, the UK has a relative abundance of a highly skilled financial workforce).
Factor Endowments and the Heckscher–Ohlin Theory
Having clarified the meaning of factor intensity and factor abundance, we are now ready to present the Heckscher-Ohlin theory.
A The Heckscher–Ohlin Theorem
This difference in relative factor and relative commodity prices is then translated into a difference in absolute factor and commodity prices between the two nations (as detailed in Section 2.4d). It is this difference in absolute commodity prices in the two nations that is the immediate cause of trade.
B General Equilibrium Framework of the Heckscher–Ohlin Theory
In other words, the H–O theorem states that the difference in relative factor abundance and prices accounts for the pre-trade difference in relative commodity prices between two countries. The difference in the relative supply of factors that leads to the difference in relative factor prices and commodity prices is thus represented by the double lines in Figure 5.3.
C Illustration of the Heckscher–Ohlin Theory
Note that the H–O model does not require tastes, income distribution, and technology to be exactly the same in the two nations for these results to follow. Note also that the H-O theory does not require identical tastes (ie, indifference curves) in the two nations.
Factor–Price Equalization and Income Distribution
Finally, in Section 5.5e, we briefly consider the empirical relevance of the factor-price equalization theorem. The rigorous proof of the factor-price equalization theorem and of the specific factors model is presented in the appendix to this chapter and requires the tools of analysis of intermediate microeconomic theory reviewed in the appendix to Chapter 3.
A The Factor–Price Equalization Theorem
For this reason, it is sometimes referred to as the Heckscher–Ohlin–Samuelson theorem (H–O–S theorem for short). In Section 5.5c, we examine the related question of the effect of international trade on the distribution of income within each trading nation.
B Relative and Absolute Factor–Price Equalization
A more rigorous and more difficult proof of the relative factor-price equalization theorem is given in the appendix. A rigorous and difficult proof of absolute factor price equalization is presented in the appendix to this chapter, following the proof of relative factor price equalization.
C Effect of Trade on the Distribution of Income
Has international trade increased wage inequality between skilled and unskilled workers in the United States and other industrialized countries during the past two decades. According to another study, the real wage gap between college and high school graduates in the United States increased by 63 percent between 1973 and 1996.
D The Specific-Factors Model
Thus, the real wage rate in the country falls in terms of X but rises in terms of Y. With more labor being used with the given specific capital in the production of X (the nation's export commodity), the real return on capital in the production of X rises.
E Empirical Relevance
The effect of this on wages in the country is ambiguous. On the contrary, with less labor used with the same amount of specific capital in the production of Y (the nation's import-competing good), the real return to the specific capital used in the production of Y falls.
Empirical Tests of the Heckscher–Ohlin Model
A Empirical Results—The Leontief Paradox
14,010 for exports using the 1947 data (see third row of the table), Leontief got a capital/labor year for imports relative to exports of 1.30. Consequently, this interpretation of Leontius' paradox on the basis of a difference in tastes is also unacceptable.
B Explanations of the Leontief Paradox and Other Empirical Tests of the H–O Model
Additional evidence in support of the H–O model for trade in manufactured goods among the largest industrial countries was also provided by James and Elmslie in 1996, and more broadly, but still qualified, by Leamer (1993), Leamer and Levinsohn (1995), and Wood (1997). . More compelling evidence supporting a qualified or limited form of the H–O theory comes from more recent research.
C Factor-Intensity Reversal
On the other hand, as Nation 2 moves from point A to B, K/L falls in the production of both goods. Similarly, the real rate of interest (r) is also the same in both countries in the production of both goods.