An Electrochemical Assay for the Detection of DNA Polymerase Activity
This work was done as a collaboration with Joseph Stodola and Prof. Peter Burgers at the Washington University School of Medicine in St. Louis.
P. Bartels fabricated devices and performed all experiments and associated analysis. Initial versions of the integrated device were designed and tested by C. Pheeney, who assisted in design for the device described herein. J. Stodola prepared DNA polymerase and PCNA proteins, and A. Arnold purified endonuclease III.
Introduction
Electrochemical detection of enzymatic activity is of great interest for diagnostic purposes, and a range of assays have been developed for these purposes (1). Given their
importance in disease, DNA-processing enzymes make particularly intriguing targets, and assays that take advantage of DNA-mediated charge transport (DNA CT) have been successfully
employed to detect protein binding and activity (2-4). DNA CT involves the long-range transfer of electrons through the π-stacked base pairs, and is sharply attenuated in the presence of lesions or mismatches that perturb base stacking (5). By appending covalent redox probes to one end of DNA tethered to a gold electrode, it is thus possible to assess the activity of enzymes that repair lesions or modify bases (i.e., methylation) using electron transfer to the probe as a readout. With careful choice of DNA substrate and reporter, the activity of a specific enzyme can be detected even at low concentrations and from heterogeneous samples (4). Although developed for diagnostic purposes, similar systems can also be used to provide insight into fundamental biochemical processes. This is well illustrated by the used of DNA-modified gold electrodes to monitor such activities as thymine dimer repair by photolyase and DNA unwinding activity by ATP-dependent [4Fe4S] helicases (6-8).
Although electrochemical activity assays have been less frequently performed for [4Fe4S] proteins, the redox behavior of a range of such enzymes in DNA repair and replication has been extensively studied on DNA-modified electrodes (9). Earlier studies with these proteins have generally used standard in-solution activity assays with a radioactivity-based readout to assess the role of the [4Fe4S] cluster (10), but electrochemical activity assays would provide some appealing advantages. Beyond bypassing the need for radioactive reagents, electrochemical
assays provide a conveniently rapid readout (minutes to hours versus days to run and expose gels) and require no additional sample preparation steps.
Among the [4Fe4S] proteins studied recently, DNA polymerase (Pol) δ has been shown to be redox active and to undergo reversible stalling upon oxidation of the cluster to the
[4Fe4S]3+ state (11). In these electrochemical experiments, Pol δ was incubated on a gold electrode containing substrate DNA with a 9-base 5ʹ single-stranded overhang. Given this substrate design, we surmised that it might be possible to use a covalent redox probe such as methylene blue (MBʹ) tethered to the end of the overhang to report on polymerase activity. In such a system, the readout would be a change from a rapid, surface-mediated methylene blue electron transfer process before reaction to a slower, DNA-mediated process as the probe intercalated into newly-synthesized duplexed DNA after reaction. In addition to activity detection, we also hoped to use this assay as an alternative to standard gel-based assays that compare the activity of oxidized and untreated Pol δ.
Biochemical assays are ideally done with minimal usage of precious protein sample. Up to this point, most electrochemical experiments were performed on multiplexed devices
containing 16 independent electrodes separable into four quadrants (12). These devices provide the ability to work with up to four distinct monolayers in parallel in addition to providing built-in experimental replicates. While each quadrant requires only 20 μL solution, experiments
generally involved the addition of 100-200 μL bulk buffer to avoid having to move an external reference electrode between quadrants. To simplify scanning while maintaining multiplexing ability and keeping reaction volumes low, we designed an 8-electrode multiplexed chip with internally integrated Pt auxiliary and pseudo-reference electrodes.
In this work, we aimed to develop a polymerase assay with a rapid readout that could serve as an alternative to radioactivity-based assays. Furthermore, we hoped to detect differences in activity between oxidized and reduced Pol δ on this platform. To aid in these goals, we
designed and tested a new multiplexed device optimized for protein experiments.
Materials and Methods
Design and Fabrication of an Integrated Multiplexed Device
Masks for gold and Pt components of a multiplexed device with internal reference and auxiliary electrodes were designed using AutoCAD software. Multiplexed chips were patterned and cleaved from wafers containing 9 chips each using clean room facilities in the Kavli
Nanoscience Institute at Caltech. Boron-doped silicon wafers were oxidized in large batches of 25 in a Tystar furnace for 3 hours to generate SiO surfaces. Prior to patterning, all wafers were dehydrated by baking on a hot plate at 150 C for 10 minutes, after which the cooled wafers were primed for photoresist annealing by a 5-minute incubation with HMDS. S1813 positive
photoresist (Shipley) was then applied uniformly across the surface using a photoresist spinner, and wafers were immediately transferred to a hot plate and baked for 1 minute at 115 ℃ to set the photoresist. Patterning was accomplished by exposure to UV light using the g-line of a Karl- Suss mask aligner using a mask containing the pattern for the Pt or Au electrodes; exposed photoresist was then removed with a 30 second bath in basic MF19 developer followed by a 1- minute water bath, yielding the desired electrode pattern.
After the pattern was set in photoresist, the wafers were stored in the clean room until metal deposition. Metal deposition was done with batches of 8 wafers (cleaned prior to this step in a plasma chamber with 150 sccm O2 at 1 mtorr) in a CHA metal evaporator; specifically, 30 Å Ti was deposited first at 0.5 Å/s, after which 1000 Å of Pt or Au was deposited at 1 Å/s.
Following metal deposition, metal on photoresist outside of the pattern was removed by a 60 C metal lift off step carried out in PG remover. The metal lift-off step took about 1 hour for ready removal of unwanted Pt, while Au took from 1-1.5 hours for a complete liftoff. Following this step, wafers were rinsed with acetone to physically remove any remaining photoresist/metal, and
then placed in subsequent baths of acetone, water, and isopropanol. This process was performed for the Pt pattern first and was then repeated for the Au pattern.
After metal application, the wafers were coated with insulating SU-8, a negative photoresist. Wafers were dehydrated and plasma cleaned prior to photoresist application. SU-8 2002 was applied on a photoresist spinner, and the wafers were then baked for 2 minutes at 95 C.
Exposure was undertaken as before, but using the i-line UV wavelength on the mask aligner along with a mask set to expose only the Au and Pt surfaces to UV. Importantly, a post-exposure bake (2 minutes, 95 ℃) was required to prevent the complete removal of SU-8 during
development. Wafers were developed in SU-8 developer for 80 seconds, then placed in an isopropanol bath for 1 minute and dried under an inert gas (either Ar or N2). The pattern was examined under a microscope to confirm complete development and cleanliness of the surfaces, and the SU-8 pattern was then set in a 15 minute hard bake at 150 C. Finally, individual chips were cleaved from the wafers using a Dynatex scriber-breaker. Chips were stored in sealed plastic containers in a dessicator under vacuum until use.
DNA Synthesis and Purification
Initial characterization of the integrated chip platform used the following DNA substrates:
17-mer thiol: Thiol – 5ʹ– GAC TGA GTA CGG TCG CA – 3ʹ
17-mer MBʹ: 5ʹ – TMBGC GAC CGT ACT CAG TC – 3ʹ
17-mer unmodified complement: 5ʹ – TGC GAC CGT ACT CAG CT – 3ʹ
For polymerase assays, a DNA construct consisting of the following three components served as a primed DNA replication substrate:
20-mer 3ʹ thiol: 5ʹ– GCT GTC GTA CAG CTC AAT GC – 3ʹ- thiol linker
38-mer MBʹ: 5ʹ– TMBAA CAG GTT GAT GCA TCG CGC TTC GGT GCT GCG TGT CT – 3ʹ
49-mer complement: 5ʹ – GCA TTG AGC TGT ACG ACA GCA GAC ACG CAG CAC CGA
AGC GCG ATG CAT C– 3ʹ
Comparisons of this substrate with fully duplexed DNA used the same components but included a 58-mer complement with the following sequence:
58-mer complement: 5ʹ – GCA TTG AGC TGT ACG ACA GCA GAC ACG CAG CAC CGA AGC GCG ATG CAT CAA CCT GTT A – 3ʹ
Unmodified DNA was purchased from IDT, and phosphoramidites for modified DNA were purchased from Glen Research. The 3ʹ thiol linker used for these reactions was 3-oxahexyl-1- thiol, a higher-yielding modification of the 6 carbon linker typically used for 5ʹ thiol
modifications. All DNA synthesized in lab was made using an ABI DNA synthesizer employing standard phosphoramidite chemistry.
DNA oligomers were removed from CPG beads by 8-hour incubation in NH4OH at 60 C, then rinsed, filtered, and dried on a speed vacuum. DNA was then dissolved in 600 μL 5 mM sodium phosphate buffer with 50 mM NaCl (pH 7.0) and purified with HPLC using a PLRPS column with a gradient of ACN and 50 mM NH4OAc (5-75% ACN/95-25% NH4OAc over 30 minutes). Collected DNA was then dried on a lyophilizer, and the 5ʹ DMT group was removed by 25-minute incubation in 250 μL of an 80% aqueous acetic acid solution followed by EtOH precipitation. DNA was again dried on a speed vacuum, and purified by another round of HPLC
(5 – 15% ACN/95 – 85% 50 mM NH4Ac over 35 minutes). DNA strands containing a disulfide modifier were reduced using 100 mM DTT (45 minutes, RT), skipping the acetic acid step. DTT was removed on a NAP5 column, and the oligomers were HPLC purified.
MBʹ-modified DNA was prepared by activation of the MBʹ-acid to an NHS ester followed by coupling to 5ʹ-amino-modified DNA synthesized. For activation, 0.022 mmol N- (carboxypropyl)methylene blue (MBʹ) was added to a scintillation vial and mixed with 0.045 mmol N,N’-dicyclohexylcarbodiimide (DCC) and 0.045 mol N-hydroxysuccinimide (NHS) in DMF. This reaction was stirred overnight at RT in the dark. The resultant NHS-ester was then dried under vacuum and re-dissolved in a minimal amount of DMSO, after which it was added in 10-fold excess to fully purified 5ʹ-amino-modified DNA in NaHCO3 and placed on a shaker overnight. The resultant MBʹ-modified DNA was isolated from unreacted MBʹ on a NAP5 column and HPLC purified as described above.
Protein Expression and Purification
Yeast DNA polymerase δ 01 (exo-) and PCNA and E. coli endonuclease III (EndoIII) were expressed and purified according to previously published protocols (10, 12).
3H-Incorporation Assay for DNA Polymerase Activity
For independent confirmation of Pol δ activity, we used a standard DNA polymerase assay based on incorporation of 3H-labeled dTTP into calf thymus DNA; the same assay was also used as to test activity on the MBʹ-modified DNA substrate used for electrochemistry (13- 15). Reactions consisted of 200 nM Pol δ in the presence or absence of 2 μM PCNA was added to a reaction mix (50 μL final volume) consisting of 8 mM MgCl2, 1 mM DTT, 25 mg/mL BSA, 2 mg/mL calf thymus DNA, 400 μM dATP, dCTP, and dGTP, 100 μM dTTP, and 800 cpm/pmol [5-methyl 3H]-dTTP and 10% glycerol v/v in 50 mM Tris-HCl (pH 8.0). Reactions with Klenow
fragment exo- (New England Biolabs) were run alongside as a control. dNTPs and Klenow fragment were purchased from New England Biolabs (NEB), calf thymus DNA was purchased from Sigma Aldrich, and radiolabeled dTTP was from Perkin Elmer.
Reactions were run at 37 ℃ for 30 minutes, and quenched by addition of 100 μL chilled 100 mM sodium pyrophosphate and 1 mL 10% TCA in EtOH. Quenched reactions were left on ice for 10 minutes, and DNA was isolated by filtration on Whatman GFC fiberglass filters and rinsed twice with 2 mL 1 M HCl, once with 1 mL 50 mM sodium pyrophosphate and once with EtOH. Acid insoluble radioactivity (DNA)was then quantified using liquid scintillation counting in 0.4% 2,5-bis(2-(5-tert-butylbenzoxazolyl)) thiophene (BROT) in toluene.
Electrochemistry-Based DNA Polymerase Assay
All DNA SAMs were formed overnight at RT on integrated multiplex chips, and backfilled for 45 minutes with 1 mM 6-mercato-1-hexanol in 5 mM phosphate buffer with 50 mM NaCl and 5% glycerol v/v. Surfaces were then washed ten times in the same buffer.
Initially, surfaces were scanned immediately after backfilling, but, in order to obtain more comparable monolayer structure before and after reaction, later surfaces were incubated at 37 ℃ for 30 minutes. This incubation led to more directly comparable signals before and after reaction, likely due to a final surface reorganization and removal of any unbound MBʹ DNA. In all cases, initial scans were performed in the same buffer, then rinsed 5 times and scanned in TBP buffer (5 mM sodium phosphate, pH 7.0,50 mM NaCl, 4 mM spermidine, 4 mM MgCl2, 0.5 mM EDTA, and 10% glycerol v/v). After scan rate dependence was taken in TBP buffer, the surface was rinsed 5 times in reaction buffer (50 mM Tris-HCl, pH 8.0, 50 mM NaCl, 10% glycerol v/v), scanned, and the process was repeated.
Reaction mixes (20 nM Pol δ 01, 2 μM PCNA, 8.0 mM MgCl2, and 400 μM dNTPs in reaction buffer) were prepared on ice, and 20 μL was added to each quadrant of an integrated multiplexed device. Initially, surfaces were scanned with enzyme immediately after addition and after reaction to observe differences, but, as nothing critical occurred at these points, these scans were later eliminated to achieve more accurate reaction times. The surface was then placed in a 37 ℃ incubator or on a bench at RT for a set time, and the reaction mix was removed and the surface rinsed in activity buffer. Scan rate dependence was taken again, and the surface was finally rinsed and scanned in TBP buffer. For oxidation experiments, reactions were run at RT in a glove bag under a 5% H2, 95% N2 atmosphere. In all cases, DNA synthesis was quantified by subtraction of the charge under the MBʹ reductive peak at 500 mV/s before reaction from the same peak after reaction.
Electrochemical Replication Product Analysis by HPLC
After the completion of all scans, the surface was incubated at 90 ℃ and copiously washed with TBP buffer to remove DNA. DNA from multiple surfaces was pooled and run through a PLRPS column using the . As controls, stock DNA representing unreplicated and full- length products were run prior to the surface samples to confirm that these substrates elute at distinct times.
Bulk electrolysis
To oxidize the polymerase, 100 nM Pol δ and 1000 nM PCNA were added to a gold rod electrode, and a potential of 0.412 V vs NHE was applied until the curve leveled off. The amount of protein oxidized was determined by integration of the curve, and subtraction of the same curve obtained with buffer alone.
Results and Discussion
Characterization of a Multiplexed Chip with Internal Reference/Counter Electrodes
In order to minimize solution volume while maintaining ease of scanning and multiplexing capacity, we designed and fabricated a multiplexed chip containing internally integrated Pt reference and auxiliary electrodes (Figure 7.1). To make room for the
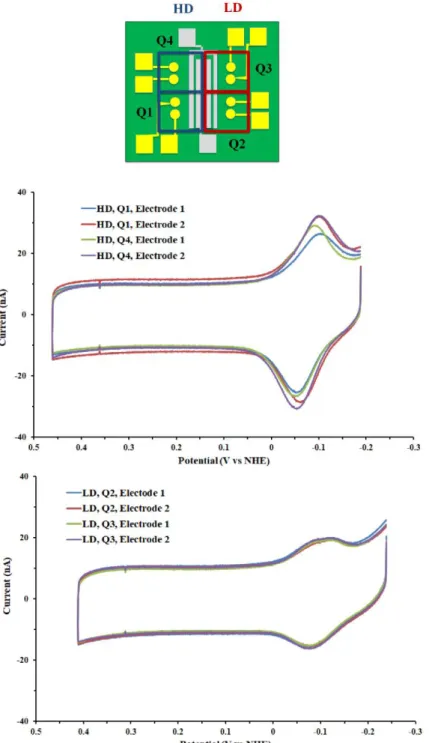
reference/auxiliary, this new device had only 8 electrodes versus the 16 of the standard multiplexed chip. To test the functionality of this new design, we performed CV experiments with a 17-mer MBʹ-modified DNA duplex. The sequence used is identical to one previously employed in general characterization of the standard device (16). To ensure that electrochemistry was similar under all conditions, DNA monolayers of two types were examined: high density (assembled with 100 mM MgCl2) and low density (no MgCl2) (17, 18). On LD monolayers, covalent MBʹ in particular possesses more flexibility and signals primarily through the electrode surface, while HD monolayers enforce more rigid packing and facilitate DNA-mediated
signaling (19).
Upon scanning, the same pattern seen previously is observed on integrated chip
electrodes, and electron transfer kinetics as determined from Laviron analysis were equivalent (5 - 10 per second in both cases); this result is consistent with CT rates limited by tunneling through the alkane-thiol monolayer and agrees with previous results (19). DNA surface coverage was calculated by Ru(NH3)6 titration, which yielded about 20 pmol/cm2 for low-density monolayers and 30 pmol/cm2 for high density monolayer, as expected (17, 18, 20). As determined using a MBʹ midpoint potential value of -75 mV vs NHE, potentials were shifted 100 mV negatively relative to Ag/AgCl, although this was consistent across all electrodes and multiple devices and
can be attributed solely to the use of a Pt pseudoreference. Critically, variability is remarkably low both within and between separate quadrants (Figure 7.2).
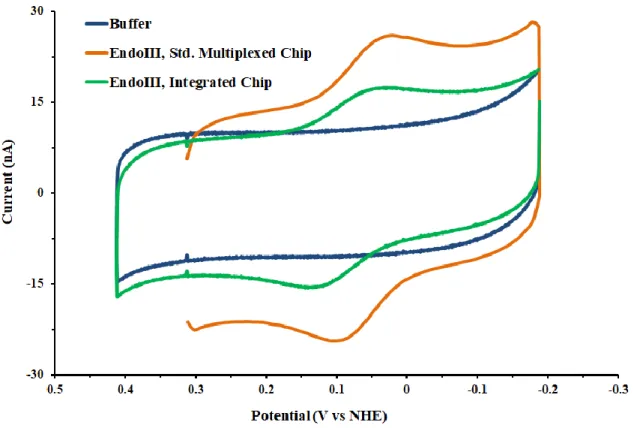
To confirm that protein electrochemistry was also unperturbed on these devices, we next repeated the CV experiments using 50 μM EndoIII in storage buffer (20 mM sodium phosphate, pH 7.5, 150 mM NaCl, 0.5 mM EDTA, 20% glycerol v/v). For protein experiments, we used the same 17-mer DNA duplex from initial characterization, but with an unmodified complement to the thiol strand. As expected, EndoIII showed a reversible signal with the same electrochemical properties on both devices (Figure 7.3), confirming their utility for protein experiments (12).
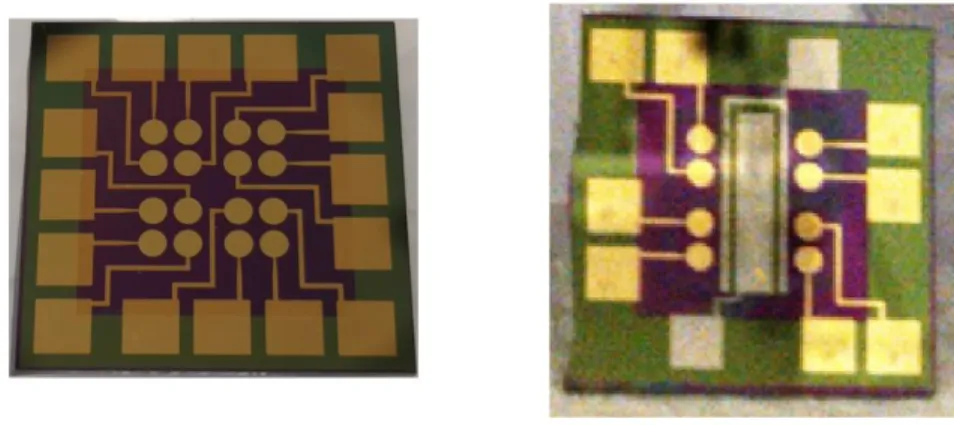
Figure 7.1 A standard 16-electrode multiplexed chip (left) and an 8-electrode chip with internal Pt reference and auxiliary electrodes (integrated chip; right). Both devices use a gold working electrode, although the area of each electrode is slightly lower on the integrated device in order to make room for the reference/auxiliary electrodes.
Figure 7.2 Electrochemistry of a 17-mer DNA duplex on an integrated chip. (top) DNA films on one half of the device were prepared in the presence of 100 mM MgCl2 to generate high density (HD) surface packing, while the others were assembled with no MgCl2 for standard low-density (LD) packing. (center) Cyclic voltammetry (CV) of MBʹ-modified DNA in quadrants one and two (both HD). (bottom) CV of MBʹ-modified DNA in quadrants one and two (both LD). As expected, signals are larger on HD films, and variability is minimal both within and between quadrants of a given type of DNA film. CV scans were taken at 100 mV/s scan rate, and experiments were performed in TBP buffer (5 mM sodium phosphate, pH 7.0, 50 mM NaCl, 4 mM spermidine, 4 mM MgCl2, 0.05 mM EDTA, and 10% glycerol v/v).
Figure 7.3 50 μM EndoIII on a standard multiplexed chip (orange) and an integrated chip
(green) at 100 mV/s scan rate. Experiments were all performed in storage buffer (20 mM sodium phosphate, 150 mM NaCl, 0.5 mM EDTA, 20% glycerol v/v).
Electrochemical DNA Polymerase Assays Using a MBʹ Probe
Once the integrated chip was fully tested, we proceeded to design an assay to report on DNA polymerase activity at the electrode surface. The general design of this assay relies on the making the distinction between surface-mediated and DNA-mediated MBʹ signals (19). In our design, covalent MBʹ on the end of a single stranded overhang would be expected to have high flexibility and give a surface-mediated signal characterized by rapid electron transfer rates. Once duplex extension occurred following incubation with Pol δ under replication conditions, this flexibility would be lost and intercalation into the base stack would be favored, resulting in slower, DNA-mediated signals (Scheme 7.1).
Before working with protein, it was first necessary to verify the occurrence of a
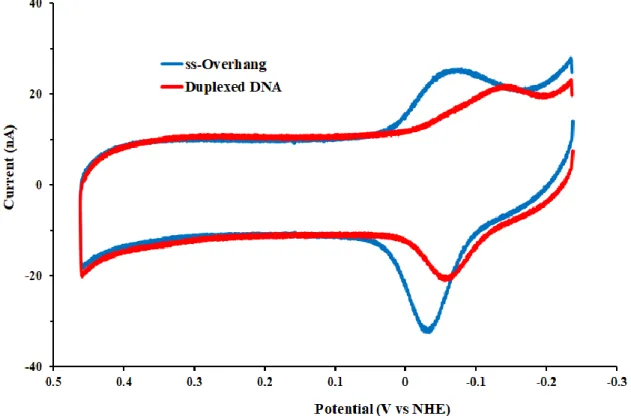
difference in the signals from DNA with an overhang and fully duplexed DNA. To address this issue, we prepared a suitably large DNA polymerase substrate with MBʹ appended to a modified dT by either a 6-carbon or 3-carbon linker. In addition, we tested both HD and LD monolayers to identify the optimal conditions, and ran electrochemistry in TBP buffer and polymerase reaction buffer (50 mM Tris-HCl, pH 8.0, 50 mM NaCl). Intriguingly, a noticeable difference was observed, although only on HD monolayers in TBP buffer (Figure 7.4). Under these conditions, MBʹ signals on overhang DNA overlap closely and have electron transfer rates of ~30 s-1, consistent with the probe ending up partially buried in the monolayer. In contrast, fully duplexed DNA shows a split reductive peak, with the lower potential peak being much larger and showing slower kinetics (~5-10 electrons s-1), in agreement with previous studies of duplexed DNA with covalent MBʹ (19).
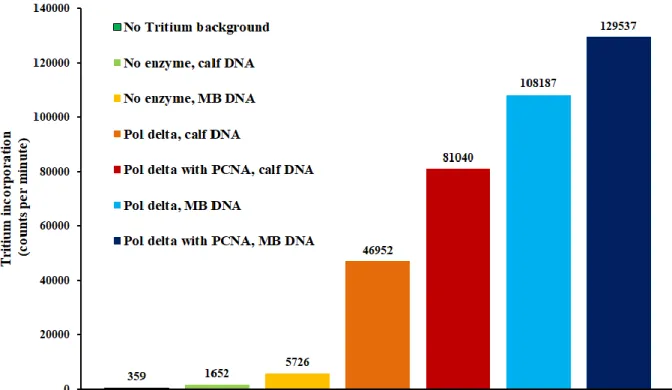
Having confirmed that duplexed and overhang DNA can be distinguished, we next confirmed polymerase activity using a 3H-dTTP incorporation assay. This assay was performed
with activated (partially DNase digested) calf thymus DNA using 200 nM Pol δ 01 (exo-) in the presence or absence of 2 μM PCNA. Pol δ 01 was used to prevent exonucleolytic degradation of surface-bound DNA by the 3ʹ - 5ʹ proofreading site of the polymerase. Since PCNA stimulates processive DNA synthesis, which is more relevant to the in vivo situation, we hoped to see much greater 3H incorporation with PCNA present. As expected, all polymerase reactions gave counts significantly above baseline, confirming that the enzyme was active (Figure 7.5). In addition, PCNA did stimulate synthesis to a quantifiable extent, although the differences were not as substantial as those seen on gels using much larger single-stranded substrates (10, 11). After verifying enzymatic activity, we repeated this assay with our MBʹ DNA substrate (lacking a thiol in this case) to ensure that the probe does not interfere with polymerase activity. These assays were run in parallel with those containing calf thymus DNA for a more direct comparison.
Fortuitously, Pol δ activity was equivalent or greater on MBʹ DNA relative to calf thymus DNA (Figure 7.5).
Having performed all of the necessary characterization, we proceeded to try an
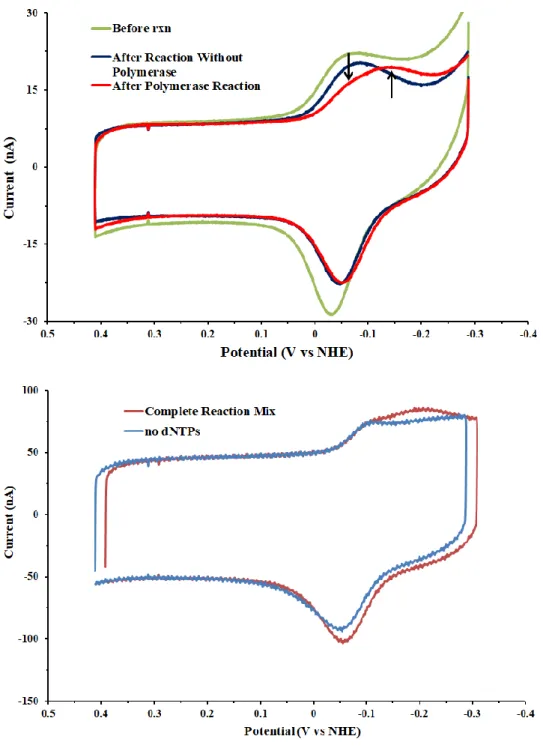
electrochemical assay with Pol δ. Because the amount of DNA present on an electrode is much less than in our solution assays, we lowered the polymerase concentration to 20 nM for these assays to prevent saturation. Initial reactions were run for 30 minutes at 37 ℃, after which sodium pyrophosphate and EDTA were added and the surface washed to remove enzyme. No polymerase was added to half of the device, although the treatment was otherwise identical. As MBʹ coupling is most efficient in TBP buffer, we scanned in TBP prior to reaction, washed in polymerase reaction buffer prior to enzyme incubation, and performed a final set of washes in TBP buffer prior to a set of post-reaction scans. Remarkably, surfaces with polymerase added showed the same split reductive signal seen in fully duplexed DNA, while those which lacked
polymerase did not change after the reaction (Figure 7.6). It should be noted that signals were smaller in all cases following the reaction and extensive washing, but losses were not great. In any case, the no-enzyme control and reaction surfaces changed by about the same extent, so the effect of losses could be easily accounted for. To confirm that the differences were caused by polymerase reaction rather than other factors such as surface passivation by quenched protein mixes, we repeated reactions in the absence of dNTPs. For these experiments, polymerase was added to each quadrant, while half of the chip lacked dNTPs. Following reaction, complete mixes showed the same MBʹ signal change observed before, while no appreciable differences occurred in the absence of dNTPs (Figure 7.6).
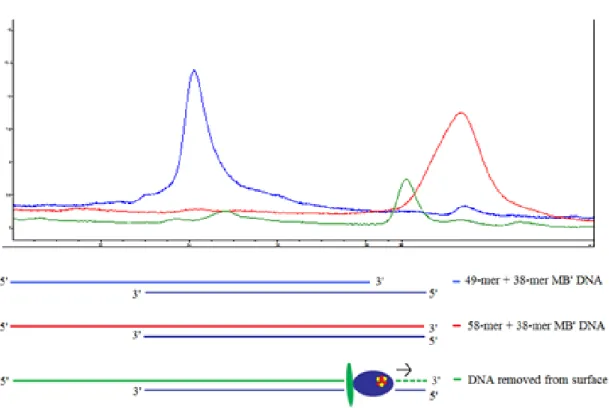
As a final control, we removed DNA from post-reaction surfaces by heating to 90 ℃ and running the resultant DNA through an HPLC column. For comparison, we separately ran an
“unreplicated” 38-mer/49-mer duplex and a full-length 38-mer/58-mer duplex (not from electrodes) to confirm that these strands eluted at different times. On a PLRPS column, the unreplicated control substrate elutes around 24 minutes, while the full-length duplex elutes around 32 minutes (Figure 7.7). DNA removed from electrodes elutes around 30 minutes, with minor peaks at 24 and 32 minutes, consistent with a significant degree of replication (Figure 7.7).
The slightly earlier elution relative to fully duplexed DNA may be due to failure to incorporate dNTPs at or near the MBʹ-modified dT; nonetheless, all of our controls are consistent with the occurrence of DNA synthesis at the electrode surface.
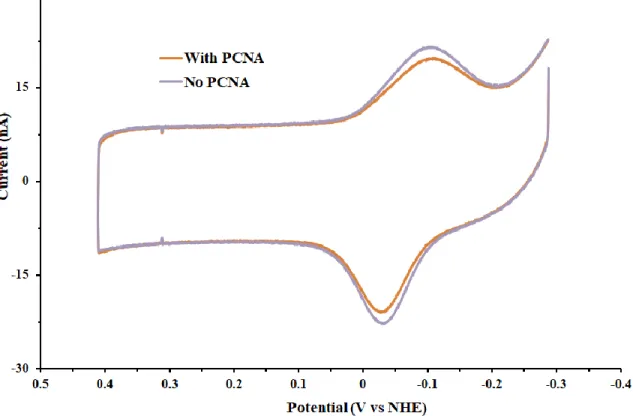
Once we were confident that activity could be observed, we attempted to see if we could use this assay to distinguish basal polymerase activity from the more biologically relevant PCNA-mediated activity. In standard gel assays, PCNA is required for the effective synthesis of substrates larger than several nucleotides. When we tested both conditions on our
electrochemical platform, however, no differences were apparent (Figure 7.8). Although
disappointing, this was not entirely surprising. Even in solution assays, the effect of PCNA was not as dramatic as that seen on gels, most likely as a consequence of the single-stranded DNA region being so short relative to a typical substrate (10, 11). That no difference occurs on an electrode may be due to the fact that HD DNA on the electrode is less accessible to PCNA-Pol δ complexes. Furthermore, with only one DNA end available for the clamp to slide on, PCNA may have been even less stimulatory without the ability to rapidly slide from substrate to substrate.
Overall, basal DNA synthesis appears to dominate on electrodes, which is not ideal but still does not preclude further analysis of polymerase activity.
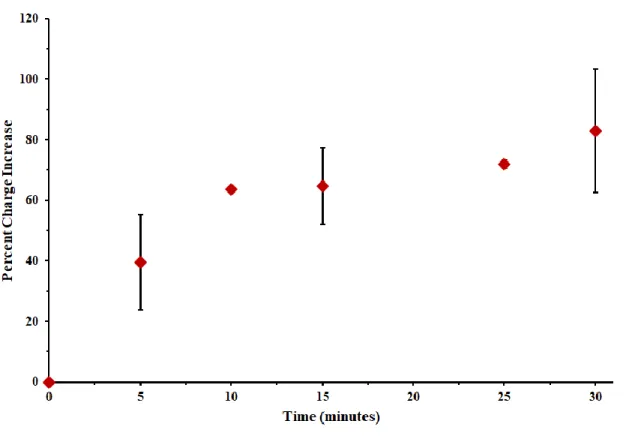
With these initial results in hand, we next aimed to generate a time course for reaction to enable quantification of reduced vs oxidized Pol δ activity in future experiments. Because MBʹ signals are most readily quantified in TBP buffer, reaction progress could not be observed in real time. To generate a time course, we thus prepared chips with three quadrants for reaction and one control, and incubated at 37 ℃ for 0, 5, 10, 15, 25, or 30 minutes prior to quenching.
Quantification was performed by taking the area under half of the second reductive peak and multiplying by 2; background was then subtracted using a control quadrant with no polymerase added. Finally, the % increase in secondary peak charge was plotted over time as an indicator of reaction progress. After all time points had been assessed, it became clear that reactions were largely complete by 10 minutes at 37 ℃ (Figure 7.9).
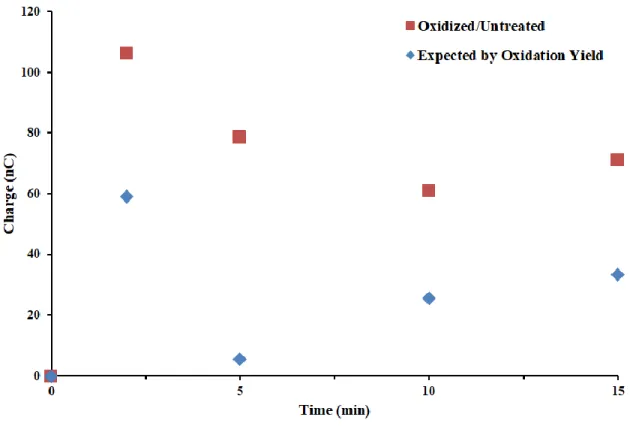
Convinced that we were seeing polymerase activity on an electrode that could be quantified over time, we attempted to compare oxidized and reduced Pol δ activity levels.
Initially, oxidation by bulk electrolysis was attempted in one quadrant containing unmodified DNA on the same integrated device as reactions were performed; however, electrolysis yields
were inconsistent and often low (as low as 5% in some cases), likely due to low chances of oxidizing an entire sample from one of two electrodes. A further problem arose when it became clear that under anaerobic conditions, the Pt reference potential wandered, moving positive hundreds of mV after 1-2 hours; with MBʹ present, this could be corrected, but it was nonetheless an undesirable result. Overall, it was clear that integrated devices (or any multiplexed electrode) are unsuitable for bulk electrolysis, so we moved forward using electrolysis on a separate, single gold rod electrode as described in 11. Yields were much improved in this case, and DNA
synthesis by oxidized Pol δ was found to be lower than untreated samples by the electrochemical assay, as expected. However, a time course failed to reveal a consistent pattern in activity
differences (Figure 7.10).
The discrepancy between these results and those seen by conventional gel-based assays is almost certainly attributable to the limitations of the electrochemical system. Specifically, the infeasibility of using longer single-stranded overhangs precludes observations of biologically relevant, PCNA-mediated processive DNA synthesis. This is particularly problematic, as oxidation is more limiting to processivity than the ability to synthesize DNA at all, and 9 nucleotides is likely near the limit at which a difference can be detected. Second, DNA surface coverage can vary between chips and is not easily controlled, meaning that the amount of DNA in each assay differs, unlike in solution reactions which use known concentrations of all
components. Third, what DNA is present is spread between two electrodes that do not entirely cover a quadrant, making protein contact more random than would be the case in solution.
Finally, multiplexed chips cannot readily be incubated at higher temperatures in a glove bag, so reactions are limited by slow diffusion. Overall, the fact that a difference was consistently seen is
remarkable, but the unfavorable features of this platform far outweigh its potential benefits for monitoring activity differences of this type.
In summary, we have designed a multiplexed device suitable for working with low volumes and demonstrated that it is possible to observe polymerase activity on this surface.
However, the Pt pseudoreference requires close monitoring, as the potential is prone to wander especially under anaerobic conditions. Furthermore, limits in the size and amount of DNA that can be distributed on a surface are not optimal for the study of highly processive polymerases, as illustrated by the ineffectiveness of PCNA in stimulating Pol δ on the electrode while having the opposite effect on the same substrate in solution. These limitations combine to make this assay design far less suitable for studying the effects of oxidation on [4Fe4S] DNA polymerases than we initially hoped. However, while this assay did not meet expectations, we were able to monitor non-processive DNA synthesis over time; only efforts to see finer details caused problems. Thus, while processive polymerases are best studied by traditional assays, a similar electrochemical assay might be useful for other proteins like telomerase, which do not synthesize hundreds of nucleotides at a time. Finally, it is also possible that this or a similar assay could be adapted to study DNA repair proteins, which require only a target site and are not limited by a need for extensive quantities of single-stranded DNA.
Scheme 7.1 Electrochemical DNA polymerase activity assay. Before replication, DNA with a MBʹ reporter tethered to the 5ʹ end of a single-stranded overhang signals primarily through the electrode surface, which is characterized by rapid electron transfer kinetics. The addition of polymerase and/or the sliding clamp PCNA followed by dNTPs is expected to allow extension of the primed DNA. Once the proteins are removed, the fully duplexed DNA now favors MBʹ intercalation into the base stack, leading to slower electron transfer kinetics than those seen through the surface.
Figure 7.4 CV of MBʹ-modified Pol δ substrates. DNA with a single-stranded overhang (blue) exhibits a single reductive peak with low peak splitting and rapid electron transfer rates. In contrast, fully duplexed DNA (red) shows a split reductive peak, with the primary peak showing marked splitting and slower electron transfer rates. Scans were taken at a scan rate of 100 mV/s in TBP buffer (5 mM sodium phosphate, pH 7.0, 50 mM NaCl, 4 mM spermidine, 4 mM MgCl2, 0.5 mM EDTA, 10% glycerol v/v).
Figure 7.5 Data from a representative 3H incorporation assay. 3H-labeled dTTP was used to record DNA synthesis, and Pol δ activity with (red) and without PCNA (orange) on a standard calf thymus DNA substrate was compared with the same MBʹ substrate used for electrochemical activity assays, but lacking a thiol (blue). Significant activity was observed on both, showing that the polymerase was active and unimpeded by the presence of MBʹ under any conditions. Assays included 200 nM Pol δ 01, 2.0 μM PCNA, 8.0 mM MgCl2, 25 mg/mL BSA, 2.0 mg/mL calf thymus DNA or 6.0 μM MBʹ DNA, 400 μM dATP, dCTP, and dGTP, 100 μM dTTP, 800 cpm/pmol [5-methyl 3H]-dTTP and 10% glycerol v/v in 50 mM Tris-HCl (pH 8.0)
Figure 7.6Polymerase reaction at an electrode. (top) Before reaction, CVs all match those observed previously for DNA with a single-stranded overhang (green), while a second reductive peak develops after incubation with 20 nM Pol δ (red), consistent with the formation of fully duplexed DNA. If no polymerase is added, the overall CV signal form does not change (blue).
(bottom) Excluding dNTPs from the reaction mix does not produce a secondary peak, supporting the assertion that DNA synthesis is being observed at the electrode surface. Reactions were performed with 20 nM Pol δ 01, 2.0 μM PCNA, 8.0 mM MgCl2, 400 μM dNTPs, and 10%
glycerol v/v in 50 mM Tris-HCl, pH 8.0. Scans shown were taken at 100 mV/s (top) or 500 mV/s (bottom) in TBP buffer (5 mM sodium phosphate, pH 7.0, 50 mM NaCl, 4 mM spermidine, 4 mM MgCl2, 0.5 mM EDTA, 10% glycerol v/v).
Figure 7.7 HPLC traces from DNA removed from an electrode by heating. DNA with an intact overhang, representing unreplicated DNA (blue trace), and fully-duplexed DNA (red trace) were run as controls. The DNA from the electrode (green trace) eluted at about the same time as the full-length DNA, suggesting that it had been extended by the polymerase. HPLC gradient was 5 – 15% ACN/95 – 85% 50 mM NH4Ac over 35 minutes at a flow rate of 2 mL/min.
Figure 7.8 Polymerase reactions at a DNA-modified electrode are unaffected by PCNA.
Conditions were as follows: 20 nM Pol δ 01, 0 or 2.0 μM PCNA, 8.0 mM MgCl2, 400 μM dATP, dCTP, dGTP and dTTP, and 10% glycerol v/v in 50 mM Tris-HCl (pH 8.0)
Figure 7.9 Time course for Pol δ replication reaction at 37 ℃ on an electrode. The percent of MBʹ secondary reductive peak charge increase at 500 mV/s scan rate is plotted and normalized for surface coverage. Reaction is largely complete by 10 minutes in the presence of 20 nM Pol δ 01. Reaction conditions were as follows: 20 nM Pol δ 01, 2.0 μM PCNA, 8.0 mM MgCl2, 400 μM dATP, dCTP, dGTP, and dTTP and 10% glycerol v/v in 50 mM Tris-HCl (pH 8.0).
Figure 7.10 Activity following Pol δ oxidation by bulk electrolysis. The percent of untreated activity is shown in red, while blue denotes the amount of synthesis expected based on oxidation yield. While a difference is apparent at later time points, it is not as large as that seen in gel- based assays in which processive, PCNA-mediated synthesis is dominant. Overall, the use of a short single-stranded region and likely saturation by Pol δ make this type of assay unsuited to quantification on an electrode. Reaction conditions were as follows: 20 nM Pol δ 01, 2.0 μM PCNA, 8.0 mM MgCl2, 400 μM dATP, dCTP, dGTP, and dTTP and 10% glycerol v/v in 50 mM Tris-HCl (pH 8.0).
References
1) Drummond, T.G..; Hill, M.G.; Barton, J.K. Electrochemical DNA Sensors. Nat.Biotech.
2003, 21, 1192 – 1199.
2) Furst, A.L.; Hill, M.G.; Barton, J.K. DNA-Modified Electrodes Fabricated Using
Copper-Free Click Chemistry for Enhance Protein Detection. Langmuir, 2013, 29, 16141 – 16149.
3) Muren, N.B.; Barton, J.K. Electochemical Assay for the Signal-On Detection of Human DNA Methyltransferase Activity. J. Am. Chem. Soc. 2013, 135, 16632 – 16640.
4) Furst, A.L.; Barton, J.K. DNA Electrochemistry shows DNMT1 Hyperactivity in Colorectal Tumors. Chem. & Biol. 2015, 22, 938 – 945.
5) Arnold, A.R.; Grodick, M.A.; Barton, J.K. DNA-Mediated Charge Transport: from Chemical Principles to the Cell. Cell Chem. Biol. 2016, 23, 183 – 197.
6) DeRosa, M.C.; Sancar, A.; Barton, J.K. Electrochemically Monitoring DNA Repair by Photolyase. Proc. Natl. Acad. Sci. USA 2005, 102, 10788 – 10792.
7) Mui, T.P.; Fuss, J.O.; Ishida, J.P.; Tainer, J.A.; Barton, J.K. ATP-Stimulated, DNA- Mediated Redox Signaling by XPD, a Repair and Transcription Helicase. J. Am. Chem.
Soc. 2011, 133, 16378 – 16381.
8) Grodick, M.A.; Segal, H.M.; Zwang, T.J.; Barton, J.K. DNA-Mediated Signaling is Necessary for Genomic Integrity. J. Am. Chem. Soc. 2014, 136, 6470 – 6478.
9) Bartels, P.L.; O’Brien, E.; Barton, J.K. DNA Signaling by Iron-Sulfur Cluster Proteins.
pp. 405 - 423 in Iron-Sulfur Clusters in Chemistry and Biology, 2nd ed. (ed. Rouault, T.), 2017, DeGruyer, Berlin/Boston.
10) Netz, D.J.A; Stith, C.M.; Stumpfig, M.; Kopf, G.; Vogel, D.; Genau, H.M.; Stodola, J.L.;
Lill, R.; Burgers, P.M.J.; Pierik, A.J. Eukaryotic DNA polymerases require an iron-sulfur cluster for the formation of active complexes. Nat. Chem. Biol. 2012, 8, 125 – 132.
11) Bartels, P.L.; Stodola, J.L.; Burgers, P.M.J.; Barton, J.K. A Redox Role for the [4Fe4S]
Cluster of Yeast DNA Polymerase δ. J. Am. Chem. Soc. 2017, 139, 18339 – 18348.
12) Pheeney, C.G.; Arnold, A.R.; Grodick, M.A.; Barton, J.K. Multiplexed Electrochemistry of DNA-Bound Metalloproteins. J. Am. Chem. Soc. 2013, 135, 11869 – 11878.
13) Chang, L.M.S. DNA Polymerases from Baker’s Yeast. J. Biol. Chem. 1977, 252, 1873 – 1880.
14) Plevani, P.; Chang, L.M.S. Initiation of Enzymatic DNA Synthesis by Yeast RNA Polymerase I. Biochemistry 1978, 17, 2530 – 2536.
15) Bauer, G.A.; Heller, H.M.; Burgers, P.M.J. DNA Polymerase III from Saccharomyces cerevisiae. J. Biol. Chem. 1988, 263, 917 – 924.
16) Slinker, J.D.; Muren, N.B.; Renfrew, S.E.; Barton, J.K. DNA charge transport over 34 nm. Nat. Chem. 2011, 3, 230 – 235.
17) Boon, E.M.; Salas, J. E.; Barton, J. K. An Electrical Probe of Protein-DNA Interactions On DNA-Modified Surfaces. Nat. Biotechnol. 2002, 20, 282–286.
18) Kelley, S. O.; Barton, J. K.; Jackson, N. M.; Hill, M. G. Electrochemistry of Methylene Blue bound to a DNA-Modified Electrode. Bioconjug. Chem. 1997, 8, 31–37.
19) Pheeney, C.G.; Barton, J.K. DNA Electrochemistry with Tethered Methylene Blue.
Langmuir, 2012, 28, 7063 – 7070.
20) Barton, J.K.; Bartels, P.L.; Deng, Y.; O’Brien, E. Electrical Probes of DNA-Binding Proteins. Methods in Enzymology 2017, 591, 355 – 414.