Over the past few decades, this technique has emerged as the primary tool in the diagnosis of PEM fuel cells. Each of the authors is closely involved in PEM fuel cell technology, including the areas of design, materials, components, operation, diagnostics, and systems.
Fuel Cell Description
This type of fuel cell requires a high temperature to keep the electrolyte in a molten state. Fears about air pollution and global warming also played a major role in the fuel cell renaissance.
Fuel Cell Types
- H 2 /Air Fuel Cells
- Direct Liquid Fuel Cells
- Alkaline Fuel Cells
- Phosphoric Acid Fuel Cells
A heating/cooling system is also required to maintain the fuel cell at a certain operating temperature. Both the half-electrode reactions and the total reactions in a PAFC are the same as those in an H2/air fuel cell.
![Figure 1.3. Fuel cell types and their advantages and disadvantages [8]. (Reproduced by permission of ECS–The Electrochemical Society, from Perry ML, Fuller TF](https://thumb-ap.123doks.com/thumbv2/123dok/9843704.0/17.659.78.580.97.420/figure-advantages-disadvantages-reproduced-permission-electrochemical-society-fuller.webp)
Fuel Cell Challenges
In reality, high-temperature PEMFCs using phosphoric acid-doped PBI membranes are similar to PAFCs in some respects. Carbon-supported Pt is used as a catalyst at both anode and cathode, porous carbon paper serves as an electrode substrate, and graphitic carbon forms the bipolar plates.
PEM Fuel Cell Electrochemistry
- Electrochemistry Fundamentals
- Polarization Curves
- Current Interruption
- Chronoamperometry
- Cyclic Voltammetry
- Electrochemical Impedance Spectroscopy
For an electrochemical reaction involving gases, the electrode potential is related to the gas pressure. The magnitude of the exchange current density determines how easily the electrochemical reaction can occur at the electrode surface.
![Figure 1.10. Tafel plot for cathode and anode branches of the current–voltage curve [19]](https://thumb-ap.123doks.com/thumbv2/123dok/9843704.0/31.659.86.555.103.454/figure-tafel-cathode-anode-branches-current-voltage-curve.webp)
Fuel Cell Analysis
- Open Circuit Voltage
- Cell Voltage Under Load
- Ohmic Drop
- Mass Transfer Drop
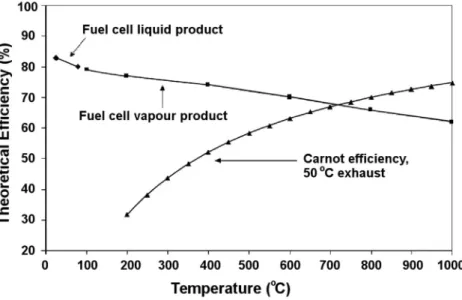
- Fuel Cell Efficiencies
Relationships between gas pressure, anodic and cathodic potential and cell voltage. In a fuel cell, Ia must be equal to Ic, and then the fuel cell voltage (Vcell) can be expressed as
![Figure 1.18. Membrane electrode assembly in a fuel cell [3]. (From Larminie J, Dicks A](https://thumb-ap.123doks.com/thumbv2/123dok/9843704.0/41.659.204.509.89.487/figure-membrane-electrode-assembly-fuel-cell-larminie-dicks.webp)
Chapter Summary
We can see that the fuel cell has a higher efficiency than the internal combustion engine in the temperature range below 700 °C. Srinivasan S, Mosdale R, Stevens P, Yang C (1999) Fuel cells: reaching the era of clean and efficient energy production in the twenty-first century.
Introduction
In this chapter, we introduce the basic theories of electrical circuits, including the behavior of circuit elements in direct current (DC) and alternating current (AC) circuits, complex algebra, electrical impedance, and network analysis. These electrical circuit theories provide a solid foundation for understanding and practicing EIS measurement and data analysis.
Direct Current Circuits
- Ohm’s Law
- Series and Parallel Circuits
- Kirchhoff’s Laws
- Resistors in DC Circuits
- Capacitors in DC Circuits
- Inductors in DC Circuits
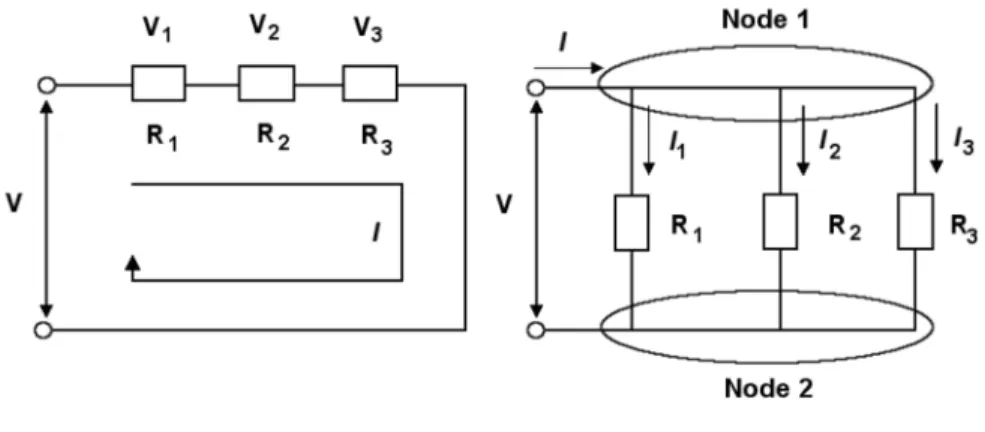
For a series resistor circuit, as shown in Figure 2.6, the current flow through each resistor is the same (IR). In a parallel configuration of inductors, as shown in Figure 2.15, each inductor has the same voltage.
Alternating Current Circuits
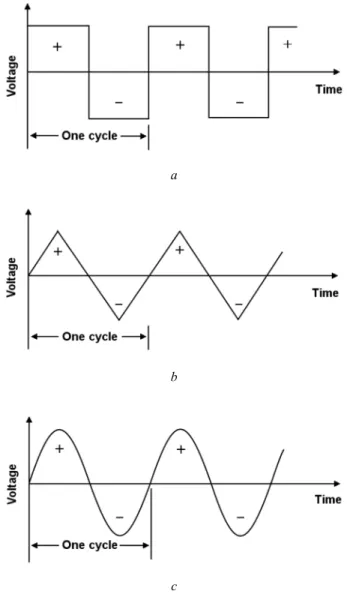
- Sinusoidal Systems
- Resistors in AC Circuits
- Capacitors in AC Circuits
- Inductors in AC Circuits
In a sinusoidal AC circuit, the current through a pure capacitor leads the voltage drop across this capacitor by 90°. In a sinusoidal AC circuit, the voltage drop across a pure inductor advances the current through it by 90°.
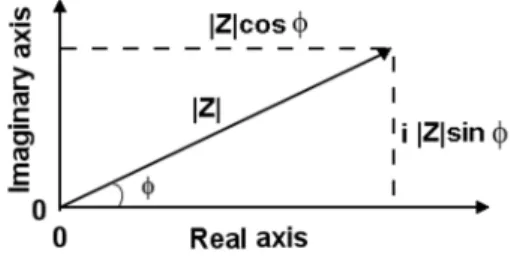
Complex Algebra and Impedance
- AC Impedance of a Resistor–Capacitor Circuit
- AC Impedance of a Resistor–Inductor Circuit
- AC Impedance of a Capacitor–Inductor Circuit
- AC Impedance of a Resistor–Capacitor–Inductor Circuit
So the real and imaginary components of the AC impedance of the R-(C/L) circuit are given by. So the real and imaginary components of the AC impedance of the C-R/L circuit are given by. In the complex plane, an example of the AC impedance of the L/(R-C) circuit is shown in Figure 2.31.
Network Circuit Analysis
Topological Features of a Network
A planar network or circuit is one that can be drawn on a flat surface without any of the branches crossing each other. Assuming that there is a single junction voltage independent of the tree branch voltage, it cannot be forced to zero by shorting the tree branches. In other words, all branch flows of a tree can be expressed in terms of link flows.
Network Theorems
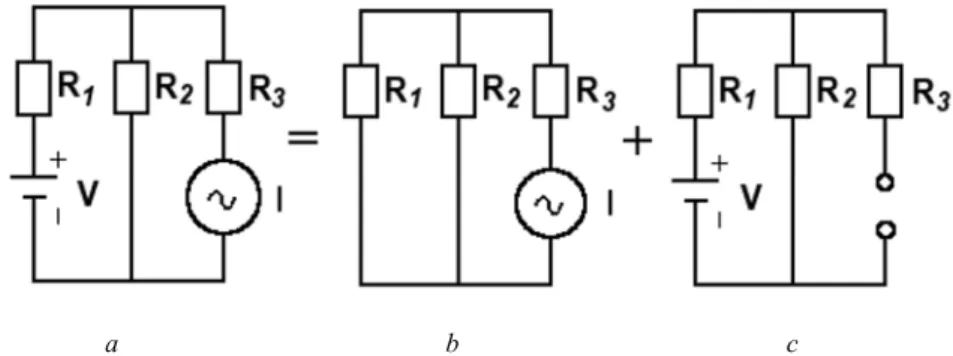
According to the superposition theorem, the current flowing through resistor R1 is the sum of the individual response to the voltage source and the current source. In other words, the mutual impedances of the network are equal to the sum of the impedances shared by networks i and k. The currents in Equation 2.150 are equal to the sum of the source currents associated with one given node.
Transient Network Analysis
Each node mutual admission Yik (i≠k) is the sum of the admissions between two given nodes i and k. Electrochemical Impedance Spectroscopy 79 where xn is the natural response and xf is the forced response. If there are two real and equal roots for equation 2.155, the natural answer is given by .
Basic Knowledge for Understanding EIS
- Introduction
- Nyquist and Bode Plots
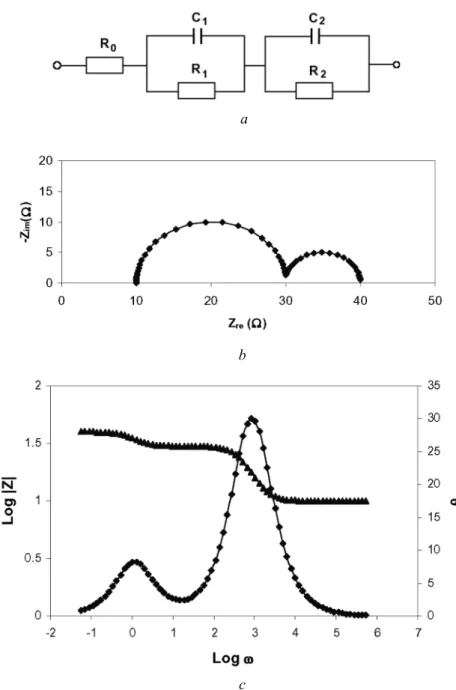
- Equivalent Circuit Models
- Data Fitting of EIS
- Applications
In general, the impedance spectrum of an electrochemical system can be represented in Nyquist and Bode plots, which are representations of the impedance as a function of frequency. Estimation of initial values is one of the most difficult tasks in the analysis of an equivalent circuit model. The simplest case for estimating the initial values of the circuit parameters is when the semicircular arcs in the impedance spectrum do not overlap.
Chapter Summary
When we begin to investigate an electrochemical system, we usually know little about the processes or mechanisms within the system. Electrochemical impedance spectroscopy (EIS) can be a powerful approach to help us hypothesize using equivalent circuit models. A data-fit equivalent circuit model will suggest valuable chemical processes or mechanisms for the electrochemical system under study.
Electrode/Electrolyte Interfaces
- Introduction
- Equivalent Circuit of an Electrode/Electrolyte Interface
- Differences Between Solid State and Aqueous Electrochemistry 97
- Calculation of the Faradaic Impedance at the Equilibrium
- Kinetic Parameters from Z f
- Vectorgraphs of Faradaic Impedance
Faradaic impedance includes both the final rate of electron transfer and the rate of transport of the electroactive reagent to the electrode surface. R, where s is the complex argument of the Laplace transform and, by measure, the reduction current is positive. When the electrolyte concentration on the electrode surface is close to the mass concentration of the solution, i.e. CO(0,t)=CO* and CR(0,t)=C*R, equation 3.47 can be simplified to.
Total Impedance of an Electrochemical System
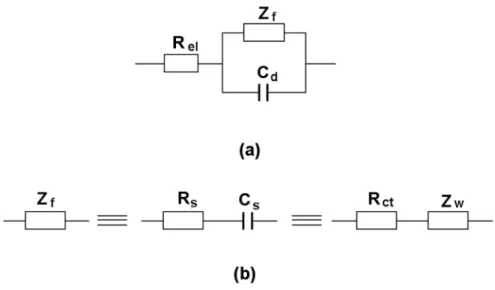
- Calculated Z f Based on Experimental Measurements
- Graphic Presentations of the Total Impedance
- Impedance Plots of Real Electrochemical Systems Using the
- Semicircle Rotation of the Impedance
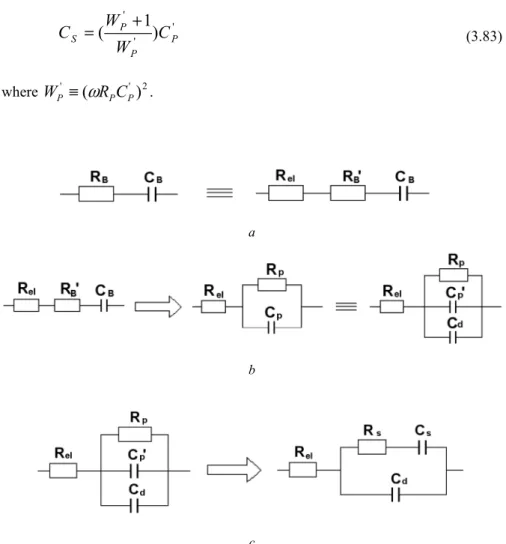
Therefore, the total impedance becomes Rel, as represented by the left intersection of the semicircle and the real axis. According to the above analysis, Rel, Rct and Cd can be obtained from the semicircle of the measured impedance. Hence it is proved that the chord length is Rct as shown in Fig. 3.11 which can be calculated as above.
Correlation of EIS with Other Electrochemical Techniques
EIS and the Polarization Curve
In general, the measurements and analysis of the EIS for a PEMFC are complicated compared to that of the polarization curve. The correlation between the EIS measurements and polarization curves is that the polarization resistance of the cell measured at a given voltage corresponds to the tangent to the polarization curve at that voltage [23], i.e. a negative slope in the polarization curve is equal to the polarization resistance in the impedance spectrum. Schematic representation of the correlation between polarization resistances (anode, cathode and cell) and polarization curves [23].
![Figure 3.13. Typical polarization curve for a PEMFC [14]. (Modified from Barbir F. PEM fuel cells: theory and practice](https://thumb-ap.123doks.com/thumbv2/123dok/9843704.0/134.659.86.578.218.535/figure-typical-polarization-pemfc-modified-barbir-theory-practice.webp)
EIS and Current Interruption
29] measured the ohmic resistance using the current pulse method (amplitude 5 A and duration 10 μs) with an ultrafast switch in the DC current of the cell. However, they represent a better estimate of the real values [32] because in general, fuel cell membrane resistances measured with EIS include a non-ohmic contribution due to the limited time resolution [27]. Compared to that of EIS, the data analysis of the current cutoff method is more straightforward.
EIS Measurements
Schematic of the PEMFC geometry and basic electrical circuit showing the membrane electrode assembly (MEA) and gas diffusion layers (GDLs) at both anode and cathode [33]. To obtain the fuel cell impedance at different frequencies, the frequency of the stimulus sine wave can be swept across the frequency range of interest. This instability can degrade the accuracy of the AC impedance measurement, especially for low frequency measurements.
![Figure 3.18. Schematic of the PEMFC geometry and basic electric circuit showing the membrane electrode assembly (MEA) and the gas diffusion layers (GDLs) at both anode and cathode [33]](https://thumb-ap.123doks.com/thumbv2/123dok/9843704.0/140.659.194.470.112.552/figure-schematic-geometry-electric-membrane-electrode-assembly-diffusion.webp)
Advantages and Limitations of EIS
EIS Advantages
EIS Limitations
If the system is linear, the measured response is just the sum of the responses to each of the two stimuli presented separately. Consequently, knowing the frequency dependence of phase allows us to calculate the amplitude of the impedance as a function of frequency. Similarly, we can deduce the frequency dependence of the phase from that of the amplitude of the impedance.
Chapter Summary
Amplitude of the signal (linearity of the cell, use the oscilloscope and frequency spectrum window). Feldheim DL, Lawson DR, Martin CR (1993) Influence of the sulfonate countercation on the thermal stability of Nafion perfluorosulfonate membranes. Büchi FN, Scherer GG (2001) Investigation of the transverse water profile in Nafion membranes in polymer electrolyte fuel cells.
Electrochemical Elements
Lumped Elements
Charge transfer resistance is the resistance created by the transfer of electrons at the electrode/electrolyte interface. Inductance (L) is the magnetic field produced when current flows through an inductor, usually a coil of wire. In a fuel cell, inductance is usually caused by adsorbed species on the electrode surface.
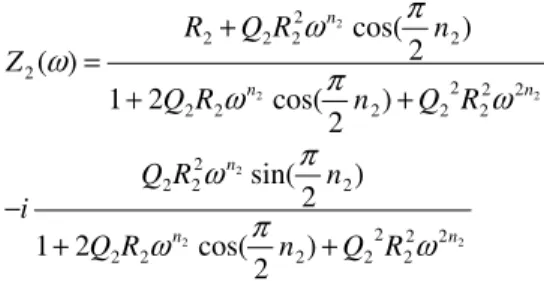
Frequency-Dependent Elements
Since the impedance of the real part is equal to that of the imaginary part, the Warburg impedance in Nyquist spectra is represented by the 45° line following the semicircle (charge transfer and double layer circuit). A CPE's impedance is given by. where q is a factor of proportionality with numerical values, and n is the CPE exponent characterizing the phase shift. For n = 1–ε, where 0<ε≤0.2, the CPE corresponds to distortion of the capacitance due to electrode surface roughness or diffusion/accumulation of charge carriers.
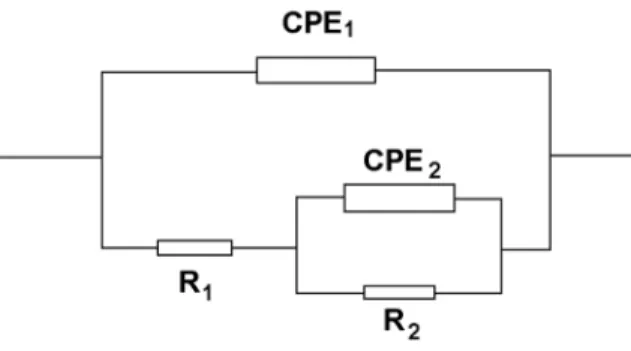
Bounded Frequency-Dependent Elements
Nyquist plot showing the impedance spectra of the R/CPE electrical circuit model [2]. Reproduced with permission from Research Solutions & Resources LLC.). Several factors can contribute to CPE: surface roughness, different thickness or composition, non-uniform current distribution and reaction rate distribution (inhomogeneous reaction rates on the electrode surface) [3]. In summary, the parameters and units of the commonly used equivalent circuit elements described above are listed in Table 4.2.
Basic Equivalent Circuits
Simple Combinations of Electrical Elements
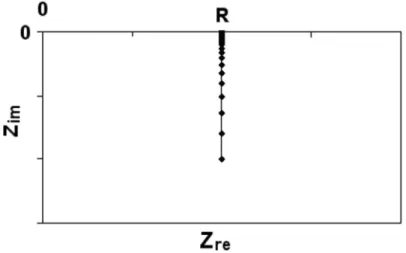
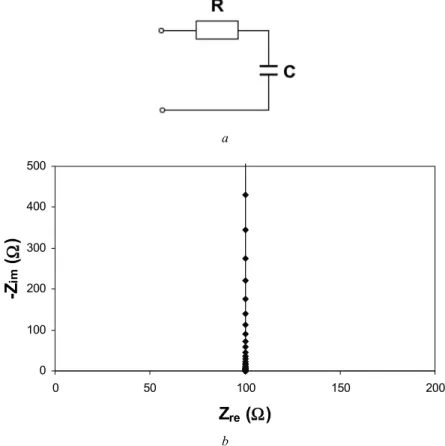
More examples of the effect of parameters on the spectra can be found in Appendix D (model D3). More examples of the effect of parameters on the spectra can be found in Appendix D (Model D4). The simulated Nyquist plot of the circuit is a vertical line in the complex plane impedance diagram, as depicted in Figure 4.6b.
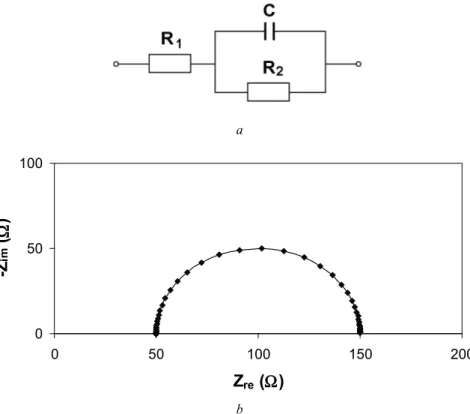
Randles Cell
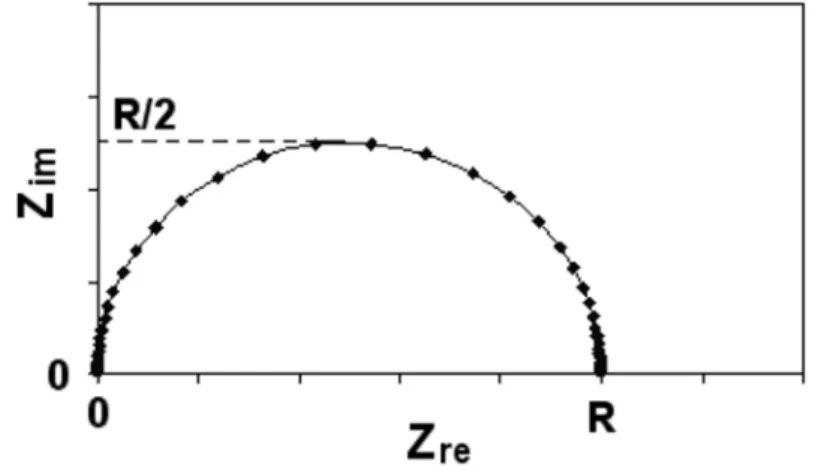
The Nyquist plot of the Randles cell in a complex plane diagram is an ideal semicircle, as shown in Figure 4.11b. The shape of this tail depends strongly on the value of the CPE exponent, as can be seen in Appendix D (Model D11). The Nyquist plot in a complex plane diagram of the Randles cell with capacitor replaced by a CPE is a depressed semicircle, as shown in Figure 4.13b.
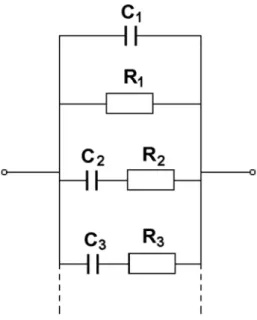
Structural Circuits
The complex impedance diagram of the Voigt structure with two RCs is shown in Figure 4.24b. The complex impedance diagram of the Voigt structure with three RC circuits is shown in Figure 4.25b. The effects of the model parameters on the shape of the spectra can be found in Appendix D (Model D24).
Other Circuits
The effect of the model parameters on the shape of the spectra can be found in Appendix D (Model D25). The physical meanings of the parameters in this figure are: R1=Rb, C1=Cb, R2=Rgb and C2=Cgb. The effect of the model parameters on the shape of the spectra is presented in Appendix D (Model C26).
Brief Discussion of Equivalent Circuits in PEM Fuel Cells
- Gas Diffusion Layers
- Catalyst Layers
- Proton Exchange Membranes
- Conductive Polymers
- Membrane Electrode Assemblies
Reproduced with permission from the authors and from ECS—The Electrochemical Society, from Lefebvre MC, Martin RB, Pickup PG. To calculate the impedance of the electrical circuit in Figure 4.33, an iterative equation must be used. Reproduced with permission from ECS—The Electrochemical Society, from Suchanski MR. AC impedance of the carbon monofluoride electrode.).
Chapter Summary
Ex Situ Diagnosis
Electrode Characterization
Membrane Characterization
Comparison of Ex Situ and In Situ EIS Methods
In Situ Diagnosis
Different Gas Feeding Modes
Measurement Modes
Operating Conditions
EIS Under Heavy Duty
Introduction
Grounded Mode
Floating Mode
Fast EIS
Principles and Measurements
Differences Between Frequency Domain and Time Domain
Chapter Summary
EIS Applications in PEMFCs
Optimization of MEA Structure
Ionic Conductivity
Contamination
Stack and Individual Cell Impedance
Localized EIS
EIS at High Temperatures
EIS Applications in DMFCs
Ex Situ Methanol Oxidation
In Situ Anode Reaction
Determination of the Ionic Resistance
In Situ Cathode Reaction
Chapter Summary
![Figure 1.1. Schematic representation of the first fuel cell [3]. (From Larminie J, Dicks A](https://thumb-ap.123doks.com/thumbv2/123dok/9843704.0/13.659.79.564.462.759/figure-schematic-representation-fuel-cell-larminie-j-dicks.webp)
![Figure 1.2. Ballard Power Systems fuel cell bus [10]. (Image courtesy of Ballard Power Systems.)](https://thumb-ap.123doks.com/thumbv2/123dok/9843704.0/16.659.82.577.96.482/figure-ballard-power-systems-image-courtesy-ballard-systems.webp)
![Figure 1.6. PEM fuel cell catalyst layer structure [13]. (Reproduced from Journal of Power Sources, 102, Costamagna P, Srinivasan S, Quantum jumps in the PEMFC science and technology from the 1960s to the year 2000: Part II](https://thumb-ap.123doks.com/thumbv2/123dok/9843704.0/20.659.92.570.105.438/catalyst-structure-reproduced-journal-sources-costamagna-srinivasan-technology.webp)
![Figure 1.15. Typical cyclic voltammogram for a reversible redox process [19]. (From Wang J., Analytical electrochemistry](https://thumb-ap.123doks.com/thumbv2/123dok/9843704.0/36.659.132.531.106.599/figure-typical-cyclic-voltammogram-reversible-process-analytical-electrochemistry.webp)
![Figure 1.16. Cyclic voltammograms for irreversible (A) and quasi-reversible (B) redox processes [19]](https://thumb-ap.123doks.com/thumbv2/123dok/9843704.0/38.659.106.558.376.656/figure-cyclic-voltammograms-irreversible-quasi-reversible-redox-processes.webp)