I am grateful for the support and scientific discussions with: Dr. Jacqueline K. Barton, Dr. Mike Hill, Dr. Andrew Udit, Dr. Keiko Yokoyama, Dr. Anna Arnold, Phil Bartels, Kelsey Boyle, Adam Boynton, Dr. Russ Ernst, Dr. Ariel Furst, Dr. Wendy Geil, Dr. Mike Grodick, Dr. Alexis Komor, Dr. Anna McConnell, Dr. Tim Mui, Dr. Natalie Muren, Liz O'Brien, Dr. Eric Olmon, Dr. Catrina Pheeney, Dr. Christine Romano, Dr. Curtis Schneider, Dr. Katie Schaeffer, Rebekah Silva, Dr. Hang Song, Dr. Pam Sontz, Dr. Alyson Weidman, Andy Zhou, Keisha Dykes, Jenny He, Chengcheng Fan, Nadia Herrera , Julie Hoy, Dr. Chinny Idigo, Dr. Jens Kaiser, Aron Kamajaya, Jeffrey Lai, Allen Lee, Qiwen Li, Phong Nguyen, Pavle, Nikolovski and Dr. Janet Yang. I would especially like to thank the members of Team Nitro for their support during a very challenging transition, and for creating an environment that always made me excited to come to work: Dr. James Howard, Dr. Thomas Spatzal, Dr. Limei Zhang, Dr. Kathryn Perez, Christine Morrison, Belinda Wenke, Andrew Buller, Renee Arias, Keith Beadle, Corinna Probst and Felix Kolbe.
INTRODUCTION
Iron-Sulfur Clusters in DNA Binding Proteins
These studies have provided conflicting information about the redox properties of the 4Fe-4S cluster in DinG. Moreover, when bound to DNA, the midpoint potential of the 2+/3+ pair of the 4Fe-4S group in DinG was 80 mV v .
Nitrogenase
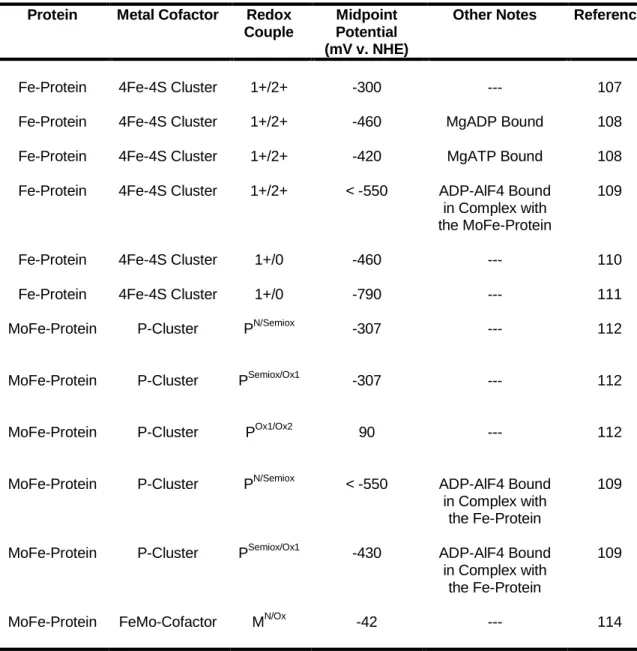
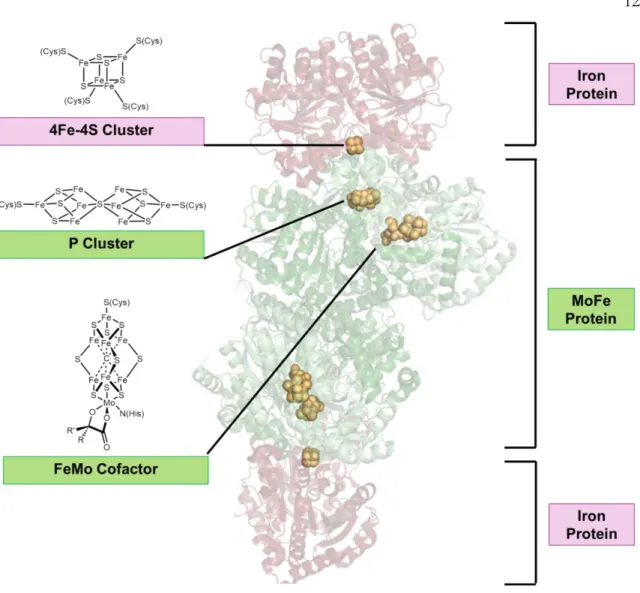
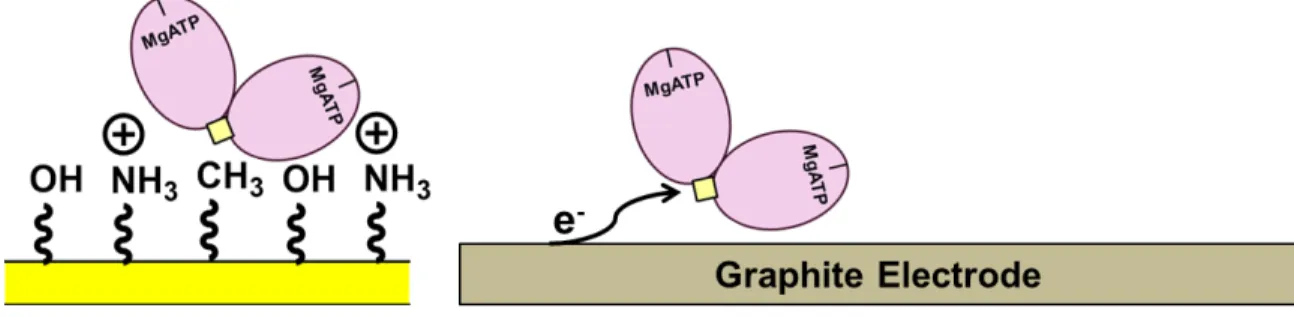
Structure of the complex of Azotobacter vinelandii nitrogenase with AMP-PCP bound to the Fe protein (PDB Entry = 4WZB). Prior to substrate reduction, electrons must be transferred from the 4Fe-4S group of the Fe protein to the P group of the MoFe protein.
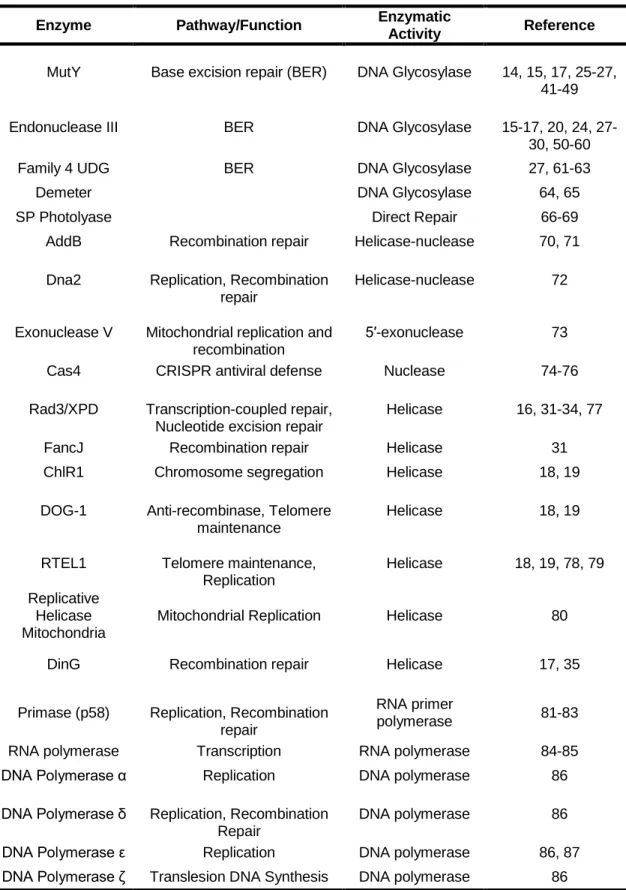
Role of the Iron-Sulfur Cluster in Escherichia coli Endonuclease III. 1992) Crystallization and crystallographic characterization of the iron-sulfur. 2007) An iron-sulfur cluster in the C-terminal domain of the p58 subunit of human DNA primase.
PURIFICATION AND SPECTROSCOPIC CHARACTERIZATION OF S. CEREVISIAE DNA2
Abstract
Introduction
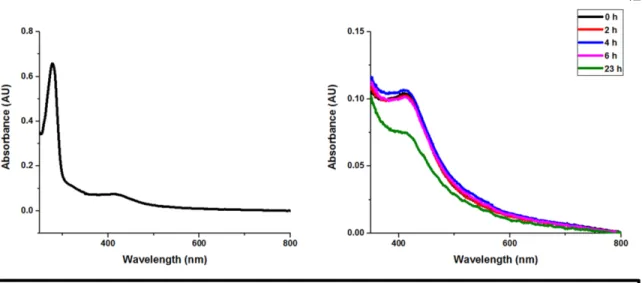
The first protein fraction eluted in the cavity volume, which corresponded to the eluent fractions between 7.5-9 ml after injection of the protein to the column. The concentration of protein was estimated based on the absorbance of the sample at 280 nm.
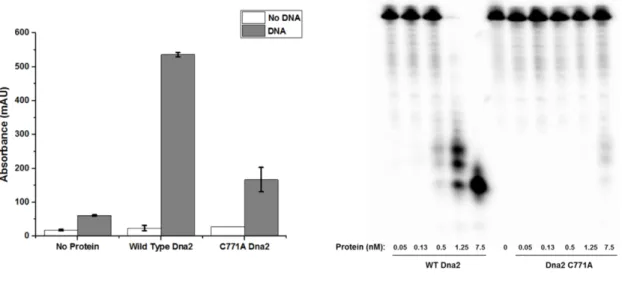
Results
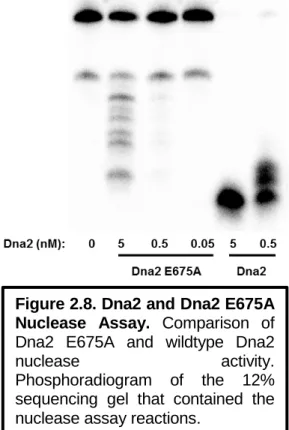
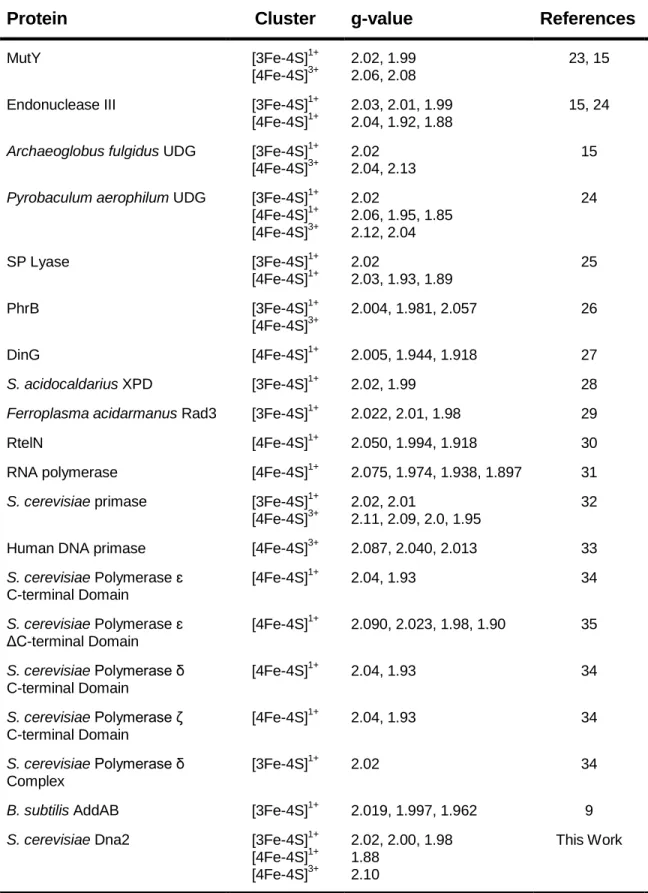
As an isolate, most of the 4Fe-4S cluster in Dna2 is most likely in the EPR-silent 2+ oxidation state. The experiments reported here provide evidence for oxidation of the 4Fe-4S group in Dna2 to the 3+ oxidation state.
Conclusion
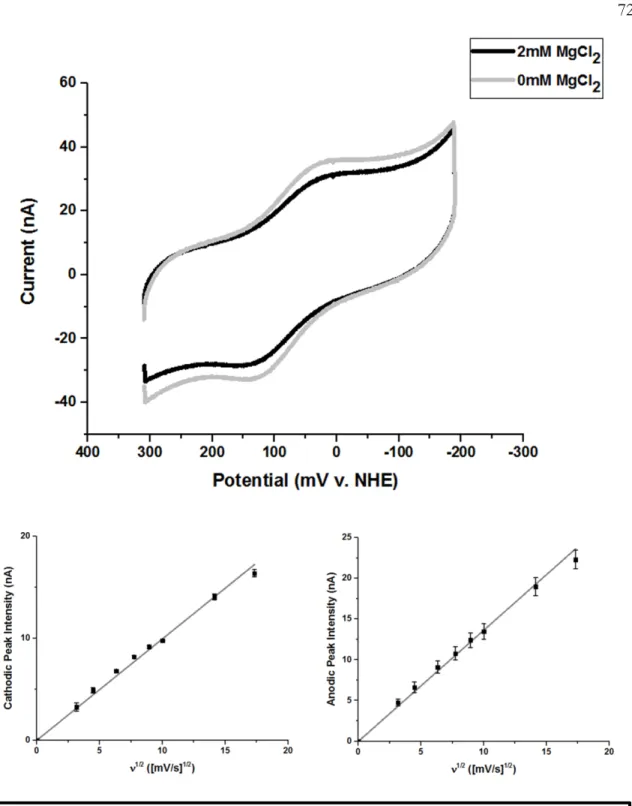
2009) Redox control of the DNA damage-inducible protein DinG helicase activity via its iron-sulfur cluster. The redox activity of the 4Fe-4S cluster in Dna2 was monitored on DNA-modified gold electrodes. In addition to preliminary characterization of the DNA-bound midpoint potential of Dna2, the electronic coupling between the iron-sulfur cluster and the DNA was assessed under conditions that favored either the helicase or nuclease activity of Dna2.
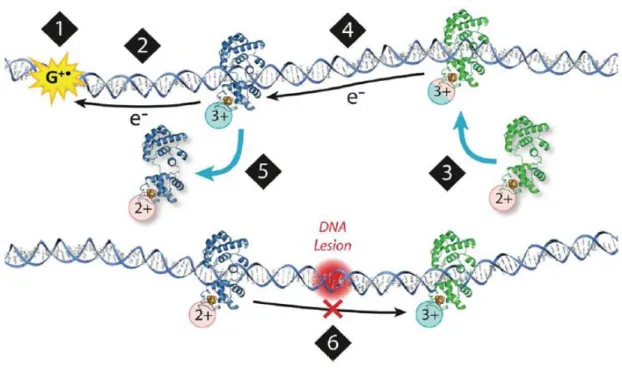
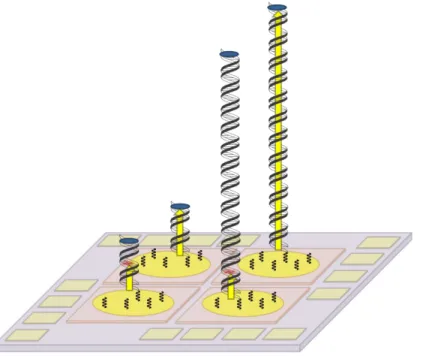
These results suggested that the electronic coupling between the iron cofactor in Dna2 and the DNA changes depending on the enzymatic activity of the protein. This technique also allowed for the measurement of the electronic coupling between the iron-sulfur group of a protein and the DNA to which it is bound (Figure 3.2). Specifically, the electronic coupling between the DNA and the iron-sulfur cluster in these DNA helicases was observed to increase with ATP hydrolysis.
It was thus proposed that ATP hydrolysis caused a structural change that facilitated electron transfer through the DNA to the 4Fe-4S cluster of the protein. The redox activity of the iron-sulfur cluster in Dna2 was also tested under conditions favoring helicase or nuclease activity.
Materials and Methods
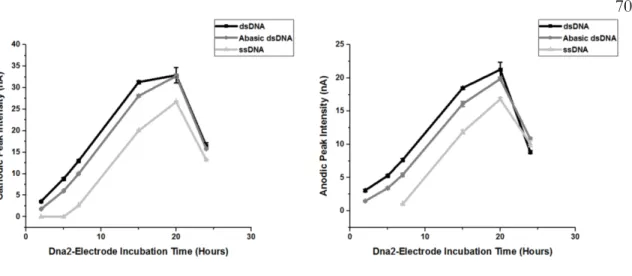
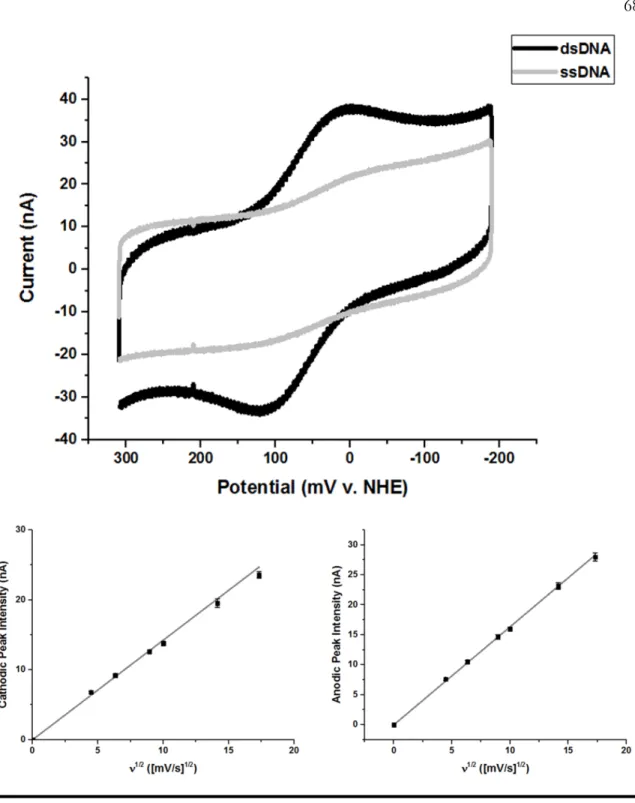
Scan rate dependence of the signal intensity of Dna2 on gold electrode modified with HMS2 dsDNA for the cathodic (left) and anodic (right) peaks. As predicted, the absolute magnitude of the signal intensity observed by cyclic voltammetry varied depending on the DNA substrate or type of DNA monolayer on the electrode surface. Scan rate dependence of the signal intensity of the cathodic (left) and anodic (right) peaks of Dna2 on gold electrode modified with HMS2 dsDNA in nuclease assay buffer.
Scan rate dependence of the signal intensity of the cathodic (left) and anodic (right) peaks of Dna2 on gold electrode modified with HMS2 dsDNA in helicase assay buffer. All buffer was removed from the slide before adding the nuclease assay reactions to the working electrode. Dna2 cleaved the DNA substrate at the ssDNA-dsDNA junction of the 5' tail substrate with a ten nucleotide overhang to leave duplex DNA (Figure A2.1).
The total amount of DNA adsorbed to the working electrode surface was approximately the same regardless of the DNA substrate used to form the monolayer. These observations suggest that the maximum Dna2 nuclease activity, which was unbiased by interaction of the DNA with the electrode or by chemical modification, was observed on the 5'-tail DNA substrate with a ten nucleotide overhang.
ELECTROCHEMICAL AND STRUCTURAL CHARACTERIZATION OF AZOTOBACTER VINELANDII FLAVODOXIN II
It has been proposed that two of the biological reductants of the Fe protein are a ferredoxin (3-5) and a flavodoxin, the latter encoded in the nif operon (6-9). The pH dependence of the midpoint potential of flavodoxin II was also assessed on DDAB-modified basal plane graphite electrodes to further characterize this system. Molecular replacement was performed with a model of the Cys69Ala mutant of Azotobacter vinelandii flavodoxin II (19).
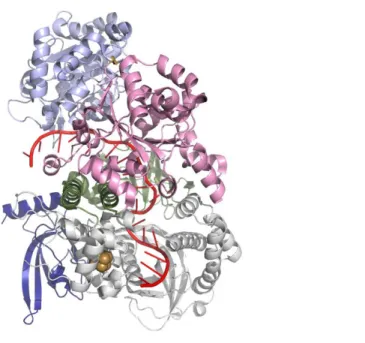
These interactions are similar to those previously observed in the structure of the Cys69Ala mutant of flavodoxin II ( 19 ). Top) Ribbon diagram of a model of flavodoxin II binding (teal) to the Fe-protein bond (grey) on MgAMP-PCP. The results of these experiments indicate that flavodoxin II is capable of donating two low-potential electrons to the iron-sulfur cluster of the Fe-protein.
Thus, depending on the true mean potential of the Fe-protein, flavodoxin II could reduce the Fe-protein to its all-iron state (57, 58). 2002) Direct assessment of the reduction potential of the [4Fe-4S]1+/0 para Fe protein from Azotobacter vinelandii.
ELECTROCHEMICAL STUDIES OF THE AZOTOBACTER VINELANDII NITROGENASE IRON PROTEIN
In summary, end-plane pyrolytic graphite electrodes were used to examine the midpoint potential of the 0/1+ pair of the iron-sulfur cluster in Av2. The Fe protein was eluted at about 280 mL after protein injection into the size exclusion column. Thus, the reducing sodium dithionite was removed from all Fe protein preparations prior to electrochemical studies.
Therefore, square-wave voltammetry was used to study the electrochemical response of Fe-protein on edge-plane pyrolytic graphite electrodes. Cyclic voltammetry of Fe-protein at monocrystalline gold electrodes modified with alkane-thiol SAMs. This electrode system was used to study the redox properties of the 4Fe-4S Av2 cluster.
This technique was therefore not used to determine the center potential of the 1+/0 pair Av2. Single crystal gold electrodes were used to study the redox chemistry of the Fe protein in different nucleotide bound forms. Therefore, the midpoint potential of the mixed nucleotide form of the Fe protein was not measured with this technique.
Although unsuccessful, these studies provide insight into direct electrochemical methods to study Fe protein redox chemistry.
SUPPORTING FIGURES AND TABLES
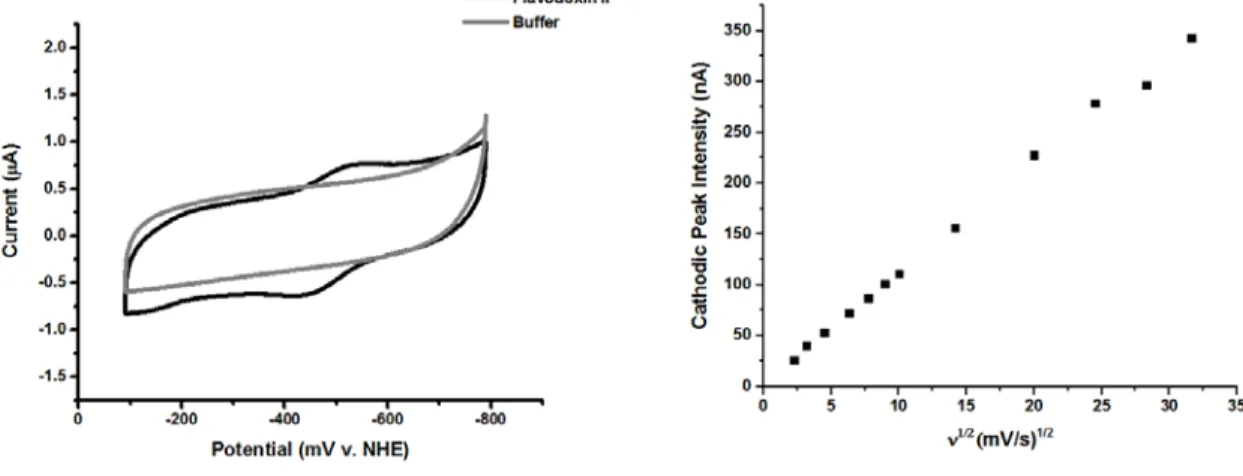
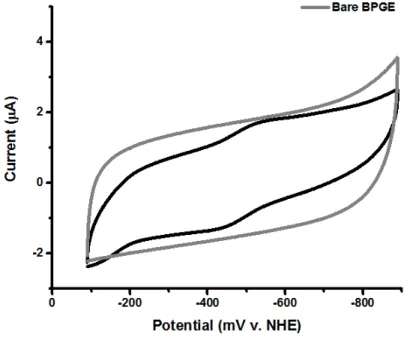
The basal plane graphite electrode (BPGE) was placed in a 200 μM solution of flavodoxin II in 50 mM potassium phosphate, pH 7.5, 150 mM NaCl and a cyclic voltammogram was acquired at a scan rate of 50 mV/s (gray). This electrode was placed in a 200 μM solution of flavodoxin II in 50 mM potassium phosphate, pH 7.5, 150 mM NaCl and a cyclic voltammogram was acquired at a scan rate of 50 mV/s (black). The DDAB-modified basal plane graphite electrode was soaked in a 200 μM solution of flavodoxin II purified from E.
The electrode was transferred to phosphate buffer, and a cyclic voltammogram was obtained at a scan rate of 50 mV/s. The basal level graphite electrode was placed in a 200 μM solution of FMN in 50 mM potassium phosphate, pH 7.5, 150 mM NaCl, and a cyclic voltammogram was obtained at a scan rate of 20 mV/s. The electrode was transferred to 10 mM phosphate buffer, pH 7, and a cyclic voltammogram was obtained at a scan rate of 20 mV/s.
Bottom) Scan rate dependence of the signal intensity of the low potential peak of the cyclic voltammogram of flavodoxin II from basal plane graphite electrodes modified by DDAB. Dependence of the signal intensity on the scan rate of the peak potential of FMN at DDAB-modified basal plane graphite electrodes.
A METHOD FOR MONITORING DNA CHARGE TRANSPORT SIGNALING BETWEEN DNA REPAIR PROTEINS
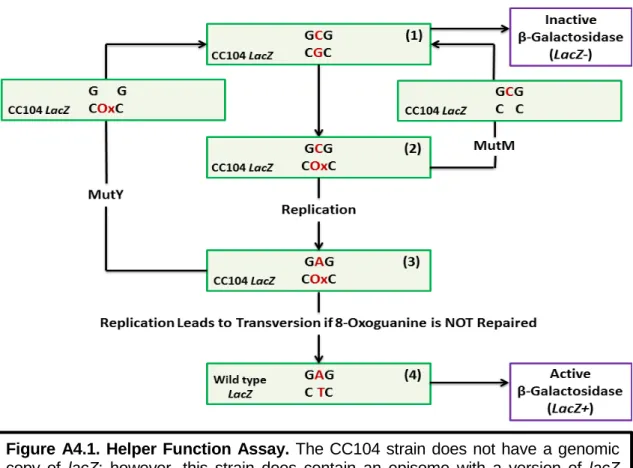
When the guanine in the codon for residue 461 is oxidized to 8-OxoG (2), there can be two possible outcomes. In particular, an increase in the number of colonies observed on minimal medium agar plates with lactose indicated that there was an increase in the number of GC to TA transversion mutations when the gene for mutY was deleted from the genome. Previous work in the Barton laboratory using the CC104 strain showed that there was an increase in β-galactosidase activity after deletion of nth, the gene for EndoIII.
This result suggested that there was a decrease in the ability of MutY to locate and repair 8-OxoG in the absence of EndoIII ( 1 ). When a charge transport-deficient mutant of EndoIII, the Y82A mutant, was expressed in the same CC104 strain, the number of transversion mutations did not change compared to the CC104 Δnth::cat strain. When this form of EndoIII was expressed in the CC104 Anth::cat strain, lac + revertant counts were restored to the levels observed for the wild-type CC104 strain ( 1 ).
Thus, the ability of EndoIII to participate in DNA-CT, rather than its enzymatic activity, caused the observed increase in the frequency of GC to TA transversion mutations when nth was removed from E. First, primers were designed that had 50 base pairs -region of homology to the region around dinG in E.