PROCEEDINGS OF THE 2014 INTERNATIONAL CONFERENCE ON ENGINEERING MANAGEMENT AND INDUSTRIAL ENGINEERING (EMIE 2014), XIAMEN, CHINA, 16–17 OCTOBER 2014
Engineering Management and Industrial Engineering
Editor
A. Leung
Advanced Science and Industry Research Center, Hong Kong
EMIE2015_Book.indb iii
EMIE2015_Book.indb iii 2/25/2015 3:20:58 PM2/25/2015 3:20:58 PM
CRC Press/Balkema is an imprint of the Taylor & Francis Group, an informa business
© 2015 Taylor & Francis Group, London, UK
Typeset by V Publishing Solutions Pvt Ltd., Chennai, India Printed and bound in the UK and the US
All rights reserved. No part of this publication or the information contained herein may be reproduced, stored in a retrieval system, or transmitted in any form or by any means, electronic, mechanical, by pho- tocopying, recording or otherwise, without written prior permission from the publisher.
Although all care is taken to ensure integrity and the quality of this publication and the information herein, no responsibility is assumed by the publishers nor the author for any damage to the property or persons as a result of operation or use of this publication and/or the information contained herein.
Published by: CRC Press/Balkema
P.O. Box 11320, 2301 EH Leiden, The Netherlands e-mail: [email protected]
www.crcpress.com – www.taylorandfrancis.com
ISBN: 978-1-138-02773-2 (Hbk) ISBN: 978-1-315-69056-8 (eBook PDF)
EMIE2015_Book.indb iv
EMIE2015_Book.indb iv 2/25/2015 3:20:58 PM2/25/2015 3:20:58 PM
v
Engineering Management and Industrial Engineering – Leung (Ed.)
© 2015 Taylor & Francis Group, London, ISBN 978-1-138-02773-2
Table of contents
Preface ix
Organizing committee xi
Modeling, simulation and engineering application
Construction quality control scheme for CFG pile of Wuhan–Guangzhou passenger
dedicated line 3
Y.S. Liu & H. Gao
Determination of functions for lightning impact point location on Transmission Lines 7 J.A. Morales Garcia & J.C. Montesdeoca Contreras
A mesh-adaptive data exchange method for solid body field coupling based
on Radial Basis Function 13
L. Huo & T. Yang
Data flow issues and BPMN mapping to Petri Net: Road map 19
A.E. Saleh Rgibi
Genetic algorithm with local optimization of sub-contractor selection
in multiple subprojects 25
Q.R. Qiu & Y.M. Di
Research and application of multi-dimensional partial differential model
in environmental improvements 29
Y.L. Miao, X. Ji, X. Qiang, J. Zhang & J.T. Meng
Bike-and-Rail promoting in Xi’an city 35
L. Yang, Y.Q. Wang, C. Li & Y.X. Li
Research on music push model based on terminal situation model 39 H.Y. Han, S.H. Guo & Y. Han
Design and implementation of dance model based on 3D motion capture system 47 J.Y. Fu, X.Z. He, F.C. Wan, L.L. Duan & Y.M. Shan
The musical instrument classification algorithm based on phase space reconstruction 53 X.M. Wang, D.F. Zhuo, Y.N. Guo, Q.J. Zhang & X.L. Guo
Analyzing statistical properties of enterprise information systems users’ access behavior 57 J.J. Ren, N.X. Wang & S.L. Ge
Integral estimation method of the accelerated performance degradation
pseudo failure data 63
L. Ao
An improvement of the simplex method 67
M.X. Shen, S.W. Zhang & J. Li
A new method for solving trajectory fusion estimation model based on trust region 71 T.H. Zhang, W.L. Yin, J. Tao & L.H. Guo
A functional hazard analysis based on Multilevel Flow Modeling 75 Y. Zhao, J. Jiao & T.D. Zhao
EMIE2015_Book.indb v
EMIE2015_Book.indb v 2/25/2015 3:20:58 PM2/25/2015 3:20:58 PM
vi Manufacturing systems and industrial design
Analysis of torsional vibration characteristics of Doubly Fed Induction Generators
connected to grid 83
A.Y.C. Lou, D. Xie & B.J.Q. Feng
Development of a Wireless Indoor Electric Appliance Monitor for energy report 91 W. Kiatruangkrai & E. Leelarasmee
The application of Cascade Integrator Comb filter on quasi-continuous wave system 97 J. Bai, Y.J. Zhang, Q.H. Zhang & X.F. Zhang
Shipboard flow field simulation for helicopter-ship dynamic interface 101 H.R. Ma, W.S. Sun & X.X. Gao
Research on Vortex ring State boundary of helicopter tail rotor 105 W.S. Sun, H.R. Ma & X.X. Gao
FPGA-based image edge detection IP core design 109
S.H. Wang, X.F. Lu & Y.D. Wu
Algorithm SESP of Wireless Sensor Network node 115
X.H. Huang
Assembly system process complexity analysis from different dimensions 119 F. He, D.B. Li & H.P. Zhu
The research application about large deformation FEM in the pile-soil interaction mechanism
of jack-up platform 125
Z.D. Zhang & X. Zhang
Information processing and engineering
Research on the integration solution for information platform in power enterprises 133 Y.J. Jiang, X.S. Yu & M. Yu
Adaptive pushover analysis for the seismic response prediction of structures 137 S.F. Qin & H.L. Wang
Strategies to promote corporate technological diversification ability under
the network environment 141
L.Q. Zhang
The Android system localization of Tibetan studies 145
Y.G. Dai, X.Z. He, Y.M. Shan & F.C. Wan
Realistic space rendering 149
T. Ma, J.R. Wang, Y. Li & J. Li
Study on the regularity of perceived usefulness and user’s satisfaction affecting continued
usage intention of information system: An example of mobile banking 155 Z.Y. Liu & C.H. Chen
Research of financial crisis mechanism information system based on middleware 161 W.N. Zhang
A literature review on cloud computing by using social network analysis 165 D.L. Hu, N.X. Wang, Y. Jia & S.L. Ge
Management technology and engineering
An experimental study of the effects of cross-cultural time orientation and corporate social
responsibility on consumers’ brand evaluation 173
Y.R. Dong, Y.Q. Liu & N. Jiang
The influence of retailer’s sales effort in dual-channel competition supply chain 183 G.J. Ji & X.M. Chen
EMIE2015_Book.indb vi
EMIE2015_Book.indb vi 2/25/2015 3:20:58 PM2/25/2015 3:20:58 PM
vii
Strategic ambiguity is the biggest risk of “going out” work 189 Y. Zhang
Establishment and evaluation of index system for talent flow 195 H. Lu & L.Y. Xiao
The geographical dispersion of independent directors and the governance of the board 203 S.Z. Ji
The mechanism analysis of the interactive development of producer services
and clothing industry of world city Beijing 207
H.T. Han & G.L. Chen
Profit allocation for joint development projects based on co-operative game theory 211 C.W. Liao, Y.H. Perng & H.S. Hsu
Family-friendly, role stress and innovation behavior: Assessing their effects on social
enterprise employee base on market orientation 217
Z.H. Lian & B. Wang
The study of the pull effect of international air transport on entry-exit tourism 221 G.C. Liu & D.L. Liang
Analysis and anticipation of inbound tourism market for Jiangmen 225 S.Y. Luo & J.H. Xiao
Point-to-point transportation analysis for domestic travel in Malaysia 231 F.I. Romli & H. Rashid
Engineering education and training
Model and design of decision support system for party cadres modern distance education 239 L.N. Dai, J.X. Guo & J.C. Zhao
Study on Beijing residents’ learning and reading time in their free time based
on the sample survey in 2011 245
Z.Y. Liu & Q.Y. Wang
A preliminary discussion on reforms of engineering fluid mechanics teaching 249 X.J. Yang
Training with ‘theory and practice together’ in ‘Excellent Engineer Plan’ 253 C.H. Lu & H.L. Liao
Research on problems and countermeasures of railway characteristics professional
degree postgraduate training 257
X.Z. Xu
e-business and e-commerce
Research on overseas financing legal issues of electronic payment business 263 Q. Ding & X. Zheng
How does WeChat marketing influence consumers’ sharing intention 267 X.P. Wang & X.D. Wang
An inventory problem considering multiply suppliers in an e-commerce company 275 C.J. Guo & B.H. Gao
How does organization structure influence CWB in the e-commerce times: From the perspective
of employee psychology climate 281
W.B. Liu & J. Tang
Author index 287
EMIE2015_Book.indb vii
EMIE2015_Book.indb vii 2/25/2015 3:20:58 PM2/25/2015 3:20:58 PM
ix
Engineering Management and Industrial Engineering – Leung (Ed.)
© 2015 Taylor & Francis Group, London, ISBN 978-1-138-02773-2
Preface
The 2014 International Conference on Engineering Management and Industrial Engineering (EMIE2014) has been held in Xiamen, China on October 16–17, 2014. As a major international convention in such fields, I am proud to say that EMIE2014 has both made satisfying contributions to related disciplines and served its participants well.
Beginning from the late twentieth century, engineering management and industrial engineering which both deal with the optimization of complex processes or systems, are mainly concerned with the develop- ment, improvement of integrated systems in industrial manufacture. It is easy to know from that defini- tion that our knowledge in these fields can directly help the advance of management and manufacture.
This is also the reason why we have decided to organize EMIE2014.
During the convention, innovative ideas and thoughts were presented by our participants; some hot topics in many fields like engineering education and training, industrial management and decision analy- sis were also intensively discussed. I am sure that these presentations will be of great research value to their listeners.
In our preparation for EMIE2014, we have received hundreds of related researches and studies. But in this book, only a small part of that amount is included after strict selection. Into 6 chapters these papers are categorized: 1) Modeling, Simulation and Engineering Application, 2) Manufacturing Systems and Industrial Design, 3) Information Processing and Engineering, 4) Management Technology and Engi- neering, 5) Engineering Education and Training, and 6) E-Business and E-Commerce.
As a member of the committee, I would like to specially thank those who have showed their great kind- ness to EMIE2014 in our preparation for it. I would like to specially express my thankfulness to the CRC Press for their publishing this book, to all our contributors and participants for their contribution and participation, and to all other people who have helped us including the reviewers and the organizers.
It is the effort of all these people’s that has made EMIE2014 such a success and it is my sincere hope that we would have another chance to work together in the future.
EMIE2014 Committees
EMIE2015_Book.indb ix
EMIE2015_Book.indb ix 2/25/2015 3:20:58 PM2/25/2015 3:20:58 PM
xi
Engineering Management and Industrial Engineering – Leung (Ed.)
© 2015 Taylor & Francis Group, London, ISBN 978-1-138-02773-2
Organizing committee
GENERAL CHAIR
Prof. Mu-Song Chen, Da-Yeh University, Taiwan PUBLICATION CHAIR
Prof. Jun Yeh, Tallinn University of Technology, Estonia PROGRAM CHAIR
Dr. Ally Leung, Advanced Science and Industry Research Center, Hong Kong INTERNATIONAL SCIENTIFIC COMMITTEE
Dr. Akbar Nikkhah, University of Zanjan, Iran Dr. Bhaba R. Sarker, Louisiana State University, USA Dr. Ali A. Ensafi, Isfahan University of Technology, Iran Dr. N. Ethiraj, Dr. M.G.R. University, India
Dr. Morteza Enhessari, Islamic Azad University, Iran
Dr. Kevin Weller, Science and Engineering Research Center, Hong Kong Dr. Q. Wen, Huazhong University of Science and Technology, China Dr. M.M. Kim, Chonbuk National University, Korea
Dr. Ricardo Rodriguez, Technological University of Ciudad Juarez, Mexico Dr. Faraj Alshmri, Slamn bin Abdulaziz University, Saudi Arabia
Dr. Q.B. Zeng, Shenzhen University, China Dr. Z.Y. Jiang, University of Wollongong, Australia Dr. V.K. Jain, Indian Institute of Technology, India Dr. T.R. Vijayaram, VIT University, India
EMIE2015_Book.indb xi
EMIE2015_Book.indb xi 2/25/2015 3:20:58 PM2/25/2015 3:20:58 PM
Modeling, simulation and engineering application
EMIE2015_Book.indb 1
EMIE2015_Book.indb 1 2/25/2015 3:20:58 PM2/25/2015 3:20:58 PM
3
Engineering Management and Industrial Engineering – Leung (Ed.)
© 2015 Taylor & Francis Group, London, ISBN 978-1-138-02773-2
Construction quality control scheme for CFG pile of Wuhan–Guangzhou passenger dedicated line
Y.S. Liu
School of Mathematics, Lanzhou City University, Lanzhou, Gansu Province, China
H. Gao
Zhixing College of Northwest Normal University, Lanzhou, Gansu Province, China
ABSTRACT: In Wuhan-Guangzhou passenger dedicated line, there are large numbers of Cement Fly- ash Gravel (CFG) piles to improve the bearing capacity of subgrade and reduce the settlement of sub- grade. This paper researched construction quality control of the CFG piles with many methods, such as concrete strength inspection, loading test, low strain integrity testing and core-drilling detection methods.
Furthermore, we provided a new feasible control scheme.
0.5 m. A 0.9 m (length) × 0.9 (width) × 0.3 (thick- ness) C15 concrete pile cap is set up on top of the pile block. Above the pile cap, there is a 50 cm (thickness) cushion which is consist of 20 cm gravel, 5 cm sand, 110 kN/m biaxial warp knitting geogrid, 5 cm sand and 20 cm gravel from bottom to top.segment network structure consisting of CFG piles, pile caps, cushion, geogrid structure, pile spacing 1.4∼1.6 m, square layout, pile diam- eter 0.5 m, and pile located 0.9 m (length) × 0.9 (W) × 0.3 (thickness) C15 concrete pile cap. Cush- ion above the pile cap, thick 50 cm, set the form from the bottom of 20 cm (gravel) + 5 cm (sand) + geogrid (110 kN/m two-way geogrid warp) + 5 cm (sand) + 20 cm (gravel).
2 KEY CONSTRUCTION QUALITY CONTROL
2.1 Concrete strength inspection
CFG pile composite material strength design value of 15 MPa. CFG pile group carried out within a certain area sampling, a total of 347 sample group, the maximum compressive strength test block 28 days of 19.6 MPa, the minimum is 13.4 MPa, a total of about 92% more than the required strength test block design value.
2.2 Loading test
2.2.1 The testing principle and method
Site maintained pile loading tests is using a slow loading method, progressively loaded with manual pumps, maximum load capacity according to the 1 INTRODUCTION
The length of the new Wuhan–Guangzhou pas- senger dedicated line is 874.406 km. The design speed is 350 km/h. According to a comprehen- sive analysis of the geological conditions and settlement estimation, settlement of test section (DK1228 + 500∼DK1238 + 750) on Wuhan does not meet some sections of passenger dedicated railway track laying conditions non-residue on the settlement after construction, but Cement Fly-ash Gravel (CFG) pile and composite foundation were reinforced. CFG pile on Wuhan test section design uses 265,000 linear meters.
CFG pile construction quality is one of the key factors affecting construction quality of the Wuhan–Guangzhou passenger dedicated line, construction quality control program CFG pile of research is to ensure the quality of the key aspects of CFG pile.
1.1 The basic situation of CFG pile
CFG pile strengthening technology is based on the gravel pile foundation developed a processing technology, which is a high bond strength rigid pile made by mixing cement, fly-ash and gravel pile. Its principle is to make public bear from the external loads through the mattress layer between the two piles, thus to ensure maximum effectiveness of composite foundation.
In Wuhan engineering test section, the network of CFG piles is consist of piles, pile caps, cush- ion and geogrid. The space length between piles is 1.4∼1.6 m, where the pile position presents a square arrangement and the diameter of the pile is
EMIE2015_Book.indb 3
EMIE2015_Book.indb 3 2/25/2015 3:20:58 PM2/25/2015 3:20:58 PM
4 design value of vertical bearing capacity of two doubly contained.
Loading test is shown in Figure 1, the static pile loading test using Φ500 mm circular plate bear- ing plate, using the I-beam and springboard bar- ricaded weights platform reaction force device and sand bags stacked.
Heap Pile Composite Foundation site loading test twice and according to the design value of the replacement ratio, consolidated bearing plate area.
Unload twice the amount of their amount was loaded.
Pile composite foundation bearing plate loading test is using 1.5 × 1.5 m square plate, a bottom plate laying 50∼150 mm coarse sand screeds, trial exca- vation pit bottom to the base elevation. Hydraulic jack is manual loading, beam erection heap load platform, sand bags stacked to provide a reaction force. The reference beam is used for the installa- tion on the basis of separate piles, the center dis- tance between the center of reference pile and test pile is 4.0 m, and the distance between the refer- ence pile center and pier platform edge is 2.0 m.
2.2.2 Pile capacity
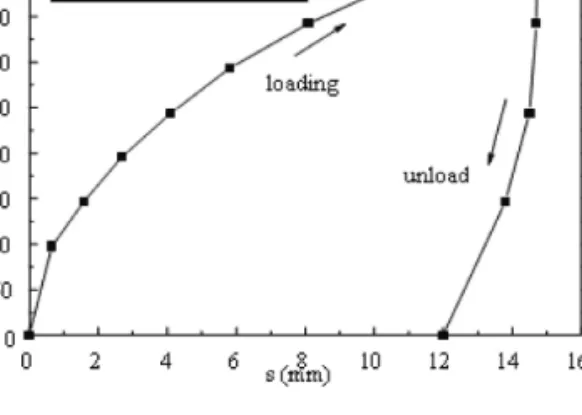
The 23 piles were tested in the bearing capacity of single pile. A typical test results for Q-s curve are shown in Figure 2. It shows gentle Q-s curves and no steep drop segment. Corresponding s-lgt curve is gentle regular arrangement. Therefore, all single pile bearing capacity of CFG pile detected value to meet the design requirements.
Figure 2. Single pile bearing capacity Q-s curve.
Figure 3 is a pile capacity eigenvalues corre- sponding settlement distribution. Table 1 shows the statistical results of pile capacity eigenvalues corresponding settlement. Visible, pile bearing capacity values correspond to the distribution of the main settlement in the range of 4∼6 mm, this part of the settlement process will be the major- ity complication of the embankment, therefore, far less than the required value of the settlement after non-ballasted track structure subgrade work be equal or less than 3 cm.
2.2.3 The bearing capacity of composite foundation
A total of 71 composite foundation loading tests.
Termination of the test loads was loaded to achieve the desired maximum load. A typical test results are shown.
In Figure 4, the result shows gentle P-s curves and no steep drop segment. Detection results indicate that all composite foundation bearing capacity values are detected to meet the design requirements.
Figure 1. Loading test schematic diagram.
Figure 2. Single pile bearing capacity Q-s curve.
Table 1. Single pile bearing capacity characteristic value (400 kN) corresponding to the settlement.
Maximum Minimum Mean
Standard deviation
Coefficient of variation 6.42 mm 1.73 mm 4.74 mm 1.11 mm 0.23
Figure 3. The settlement of single pile bearing capacity characteristic value of the corresponding.
EMIE2015_Book.indb 4
EMIE2015_Book.indb 4 2/25/2015 3:20:58 PM2/25/2015 3:20:58 PM
5 Figure 5 is a composite foundation bearing capacity values corresponding settlement distribu- tion. Table 2 shows the values of the correspond- ing bearing capacity of composite foundation settlement statistics. As it can be observed, the bearing capacity of composite foundation settle- ment eigenvalues distribution is slightly larger than the corresponding pile bearing capacity distribu- tion of eigenvalues. Bearing capacity of composite foundation settlement value corresponds to the main distribution area of 2∼6 mm. Settlement of composite foundation embankment process will
be completed in the majority, and theoretically, it would be less than the settlement after settlement under loading test conditions. Therefore, after the settlement of composite, the foundation will work after less than non-ballasted track roadbed settle- ment control values.
2.3 Low strain reflected wave method
Acceptance by the passenger line with regulatory requirements, low strain detection by 10% CFG total number of piles. Total construction of the Wuhan–Guangzhou project completed CFG pile test section is 26286, testing the number 2693, the ratio was 10.2%, with a pass rate of 99.8%. Low strain test results are shown in Table 3. It can be observed from the measured waveform low strain detection, II type pile on top of the pile 92% less 1.0 m∼2.0 m occur within the scope of a slight con- striction, where the soil is soft plastic or plastic-like flow of clay, soil lateral binding small, CFG pile con- struction sequence is one of the factors to produce necking. To avoid a new pile to twist and extrusion the existing piles, a construction technology can be used to make the piles, where a new pile is created in alternate lines and rows. while after construction, the new piling must become a pile body that strong enough with certain strength. To drill too fast will cause an insufficient release of the air, and may also cause the constriction. Therefore, when a pile of concrete output should be controlled to match the speed and promotion, always ensure that the height of the concrete pipe to avoid necking generation.
2.4 Core-drilling experiments
Wuhan–Guangzhou passenger line CFG pile test section core-drilling sample design strength be equal or greater than 15 MPa, in seven piles of sampling 12-bit, the measured result is 17.7 MPa∼36.2 MPa, the results show that the compressive strength of core-drilling samples meet the design requirements, the maximum intensity of the pile more than two times the design requirements.
2.5 Bits (vertical and horizontal) and the effective diameter of the pile detection
The main detection of each pile’s test is pile group distance, and the subject of the design or test the Figure 4. The bearing capacity of composite founda-
tion P-s curve.
Table 2. Single pile bearing capacity characteristic value (220 kN) corresponding to the settlement.
Maximum Minimum Mean
Standard deviation
Coefficient of variation 8.26 mm 2.35 mm 4.33 mm 1.20 mm 0.28
Figure 5. The settlement of composite foundation bear- ing capacity corresponding.
Table 3. Low strain test results.
Total Testing I type II type III type IV
26286 2693 2215 473 5 0
Proportion 10.2% 82.3% 17.5% 0.2% 0
EMIE2015_Book.indb 5
EMIE2015_Book.indb 5 2/25/2015 3:20:59 PM2/25/2015 3:20:59 PM
6 tolerance range, carried out mainly with a ruler to measure for the detection on the spot; pile mainly on the effective diameter of the pile manually selected excavation to the specified depth, diam- eter of the pile with a ruler be measured, to detect whether an effective diameter of the pile design pile diameter.
Wuhan engineering test section in addition to individual pile CFG pile test section had shifted to high office, basically reached the required stand- ard deviation range test, the results were within the range of 5 cm. Deviation of excess pile, field- increasing loading test, designed checking, and an increase in the upper pile cap sizes all can meet the design requirements.
3 CONCLUSION
Through the construction and subsequent detec- tion of a large construction site detection process test segment, based on a comprehensive analysis of the detection results, after which experts dis- cuss on CFG pile testing procedures, test results of the three main aspects of treatment and detection strict control draw a practical conclusion.
Detection Program: In addition to strengthen- ing the construction process, as well as the detec- tion of the raw material mixture stirred for quality control, there are 28 days after the first test block on the pile strength test. After the strength meets the requirements, there will be low strain integrity testing and loading testing; strength in the case does not meet the strength test block, conducted on behalf of the pile to pile drill core-drilling sam- ples to detect physical strength body again meets the design requirements, other subsequent projects above.
Test results processing: CFG pile for detecting the presence of class III low strain pile exceeds 10% or class IV pile appears when you want to pile all the batches for testing; proportion of post-test class III piles but not more than 10% before each construction unit 100; extend more than 5% to the detection range, around the pile the pile detect- ing class III; does not exceed 5% when the same is detected, but the end result in the same proportion to expand or verify eligibility pile must all testing.
Detection of the body: the first self-test detects the construction unit, reported a third-party test- ing unit supervision and self-qualified after re- examination, a process of construction in all three parties after passing before the next.
By following this detection scheme for quality control of CFG pile, effectively ensure the qual- ity of the Wuhan–Guangzhou high-speed railway passenger dedicated pile foundation treatment, right across the board as a whole to ensure the overall quality control and sedimentation con- trol embankment structures play a crucial role in safeguarding.
REFERENCES
Ding Xuan-ming, Chen Yu-min & Kong Gang-qiang.
2012. Formation mechanism of velocity waves in low strain integrity testing of PCC pile. Rock and Soil Mechanics 33(1):154–161.
Jun-Jie Zheng, Sari W. Abusharar & Xian-Zhi Wang.
2008. Three-dimensional nonlinear finite element modeling of composite foundation formed by CFG–
lime piles. Computers and Geotechnics 35(4): 637–643.
Zheng Gang & Yu Zongfei. 2003. Standardization of bearing test and the determination of bearing capac- ity of composite foundation. Journal of Building Structures 24(1): 84–91.
EMIE2015_Book.indb 6
EMIE2015_Book.indb 6 2/25/2015 3:20:59 PM2/25/2015 3:20:59 PM
7
Engineering Management and Industrial Engineering – Leung (Ed.)
© 2015 Taylor & Francis Group, London, ISBN 978-1-138-02773-2
Determination of functions for lightning impact point location on Transmission Lines
J.A. Morales Garcia
Carrera de Ingeniería Eléctrica de la Universidad Politécnica Salesiana, Cuenca, Ecuador
J.C. Montesdeoca Contreras
Carrera de Ingeniería Electrónica de la Universidad Politécnica Salesiana, Cuenca, Ecuador
ABSTRACT: Protection algorithms are related to what provides the highest accuracy in location of faults produced by lightning strokes on transmission lines. Thus, in this paper a novel methodology for lightning stroke location based on impedance estimation in new coordinate axes is presented. Principal Component Analysis (PCA) is used to project the voltage and current signals with data windows of ¼ cycles onto new coordinate axes, corresponding to the Principal Components (PCs) subspace. Then, these new voltage and current values are used to calculate the apparent impedance in the PCA subspace. This projection shows a relation between the new impedance value and the point of impact along transmis- sion lines. Based on this, two functions that localize the flash point produced by lightning strokes are found. Results show that the proposed methodology for location of lightning stroke on transmission line presents satisfactory results.
not correctly detect the first wave front, with these protection devices being considerably influenced, especially for the faults near relays.
An algorithm based on the Fourier Transform (FT) and the k-nearest neighbors (K-NN) was pro- posed [11]. Still, this algorithm uses data windows corresponding to 1 cycle, thus their operation time is similar to the traditional protection algorithms.
A referent work for this issue is presented [12].
This work is based on the Multiresolution analy- sis (MRA), in which by using the mother wavelet daubechies 8, the signals are decomposed in lev- els and by using these levels, a function useful to the lightning localization is determined. Still, the MRA depends on the mother wavelet selected and their decomposition [13].
This consideration is crucial in making analysis, considering models as really as possible, such as transmission towers, ground-wires and live wires [14]. However, the work proposed in [15] analyzing transmission lines omits these elements, especially transmission towers which are crucial in lightning strokes studies due to that this element produces over-voltages. These over-voltages are produced by multiple reflections when a flash hits the transmis- sion tower [15]–[16].
In section 2 the operation principle of protection relays based on the impedance estimation is pre- sented. Section 3 presents the theoretical basis of Principal Component Analysis. Section 4 presents 1 INTRODUCTION
Transmission lines are the most important ele- ments in Electric Power System (EPS), which are exposed to different conditions, where the possibil- ity of faults produced by atmospheric discharges is higher than other phenomena [1]. Currently, events related to atmospheric discharges are considered as the main causes in producing Transmission Lines (TLs) outages [2]. Faults records on TLs are 50%
higher than that produced by lightning strokes [2].
On this context, it is well accepted that the most important transmission lines outages are related to the lightning [3–5].
In the engineering environment, lightning strokes which hit directly on transmission lines or transmission towers are considered as serious inconveniences [6]. When a lightning produces faults, it is crucial to correctly determine the point of impact on TLs [7].
At the moment, algorithms based on the Fourier Transform are used for the localization of faults produced by atmospheric discharges [8]–[9].
As regard to the bibliographic review, differ- ent approaches using the Wavelet Transform and the travelling waves theory have been reported for the common faults localization, which are differ- ent from lightning strokes [10]–[14]. However, it is well known that travelling waves techniques are influenced by the multiple reflections, which can-
EMIE2015_Book.indb 7
EMIE2015_Book.indb 7 2/25/2015 3:20:59 PM2/25/2015 3:20:59 PM
8 the electric power system simulation. The signal processing useful to determine the impact point is presented in section 5. Finally, section 6 presents the main conclusions of this work.
2 PRINCIPAL COMPONENT ANALYSIS Principal Component Analysis (PCA) is an appropriate mathematical tool when a variables set represented by p has been obtained, and it is desirable to find a smaller variables number z called principal components [15]. Hence, PCA is an efficient tool to analyze a data set where m observations on p-dimensional space can be rep- resented optimally on a new space smaller than the original space.
Assuming a correlated data set X, it is possi- ble to represent them through a new space where new data bases z are uncorrelated. These new data called Principal Components (PCs) are represented by a linear combination, which are calculated as follows:
PCCC1 2, ,2 ...,p= ⎡⎣⎡⎡eigv eigveigv1eigveigv2…eigveigvp⎤⎦⎤⎤⋅ ⎡⎣⎡⎡xx x⎤⎦⎤⎤T (1) where, PC1, 2, ... p are projections corresponding to original variables x, which are projected through using the eigenvectors eigv. These eigenvectors are calculated through the variance-covariance matrix S as follows:
S xm x xx xm x
i m
=
( )( )
(
m−)
∑
=1 (2)The matrix form corresponding to principal components are calculated as follows:
[ ]
PC =[ ]
U[ ]
X (3)where U represents the eigenvectors matrix, and X represents the original variables matrix.
3 ELECTRIC POWERSYSTEM SIMULATED
Alternative Transient Program ATP/EMTP [29] is used for the Electric Power System (EPS) simula- tion. This model corresponds to a 220 kV EPS.
The transmission line denoted as M-N is an element under study, which corresponds to three phases TLs with two ground wires.
As regard to the simulations, different elements are considered as follows:
Transmission line (TL): By using un-transposed distributed parameter line models J. Marti, shield wires and live wires of transmission lines are mod- eled by two or three spans at each side of the point of impact. See Fig. 1.
Transmission tower: In this work the tower is represented as a lossless distribute-parameter transmission line, characterized by its impedance and travel time [18].
Insulators: The insulator on TLs is simulated by a voltage-dependent flashover switch and a voltage-time characteristic, which is recommended and suggested by world organizations as EPRI and IEEE [6].
Lightning stroke: It has been accepted that when a lightning hits a transmission line, it injects cur- rent into the power system [6]. In this context, the Heidler model is used in this research.
3.1 Lighting stroke signals data base
In order to generate different signals produced by lightning on TLs, the standard lightning impulse 1.2/50 μs is used to generate direct faults (flashover) and indirect faults (back-flashover).
Lightning current of 10 kA and 150 kA is simulated to generate flashover y back-flashover, respectively. Furthermore, by using these lightning current values, different lighting strokes along the transmission line are simulated, where 26 trans- mission line stretches are considered. As regard to the lightning currents values, they are composed of the values range registered by different organi- zations [6].
4 PROPOSED METHODOLOGY
The methodology proposed in this paper has two analysis states. As regard to the first state, the volt- age and current signals corresponding to normal state are processed thought PCA. Thus, by apply- ing equations (1)–(3), these signals are projected onto a new space, and the impedance value is cal- culated. The voltage and current signals used in this section are discrete sinusoidal waveforms with Figure 1. Overhead line model for lightning stroke over-voltages analysis.
EMIE2015_Book.indb 8
EMIE2015_Book.indb 8 2/25/2015 3:20:59 PM2/25/2015 3:20:59 PM
9 a data window corresponding to 1 cycle. Still, in order to break down the variation of these signals, and extract the impedance by using a data window less than 1 cycle, different data windows corre- sponding to ¼ cycle are used. That is, the voltage and current signals corresponding to normal con- dition registered in 1 cycle are composed of data windows of ¼ of cycle.
In this context, a data matrix (1900 × 4000) regis- tered by the relay R1 at bus M is analyzed through PCA. Thus, the impedance value is calculated onto a new space, using data windows corresponding to
¼ of cycle, decreasing the operation time of tradi- tional algorithms.
4.1 Patterns analysis
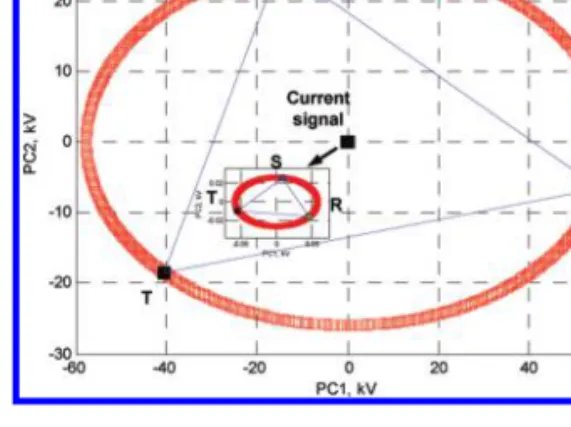
After the voltage and current signals correspond- ing to normal operation have been projected on the new coordinates, it is possible to observe that both the voltages and current signals describe well the defined ellipsoidal patterns as are presented in Figure 2 and Figure 3.
Later on the impedance values are calculated.
However, in order to calculate this parameter, it is necessary to transform the values of principal components into their respective values in polar coordinates, and by using these values, the imped- ance can be calculated as follows:
real= PCPCCCC12+PCCC22 (4)
φ= ⎛
⎝⎜
⎛⎛
⎝⎝
⎞
⎠⎟
⎞⎞
arctan PC ⎠⎠
PC C2
C C1
C (5)
where PC1 and PC2 represent the principal com- ponent values.
By using equations 4 and 5, the real part and the angle are calculated, and thus the impedance value is determined. It is necessary to note that the previ- ous procedure using normal state sinusoidal signals is developed in order to extract eigenvectors useful to make the projection of lightning stroke signals on a new space.
4.2 Lightning impact point determination
After the eigenvectors are extracted, the voltage and current signals corresponding to new lightning stroke on transmission lines, which are registered by the protection relay as discrete signals f(v) and f(i) of 4000 points (row vectors 1 × 4000), are cal- culated and projected on the ellipsoidal patterns previously established. The previous projection is done by using the coefficients corresponding to the eigenvectors of the variance-covariance matrix;
the projection of new lightning strokes is done as follows:
fv
( )
pc =(
f( )
v −x)
U (6) fi( )
pc =(
f( )
i −x)
U (7) where U represents the projection matrix, repre- sents the mean vector. Therefore, by using these eigenvectors, both direct faults (flashover) and indirect faults (back-flashover) produced by atmos- pheric discharges considering different impact points along the transmission line, are projected on a two dimensions space.Later on, the impedance value onto the new space is calculated as follows:
Zpc realV real I
= (8)
Figure 2. Voltage and current signals projected onto a 3D subspace of principal components.
Figure 3. Voltage and current signals projected onto a 2D subspace of principal components.
EMIE2015_Book.indb 9
EMIE2015_Book.indb 9 2/25/2015 3:21:00 PM2/25/2015 3:21:00 PM
10 where realV and realI are the real part of the volt- age and current signals produced by lightning strokes.
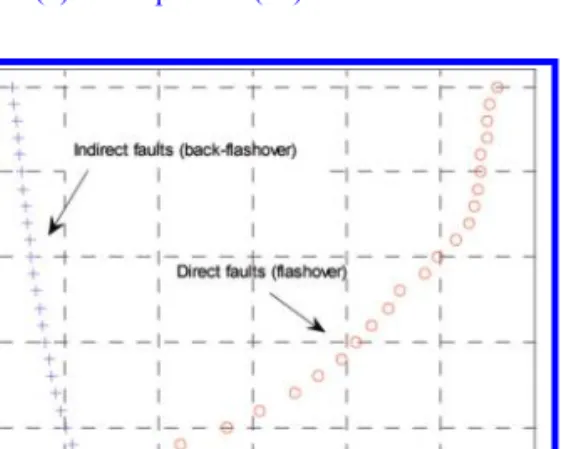
The relation or patron between the new imped- ance value and the lightning impact point along the transmission line is shown in Figure 4.
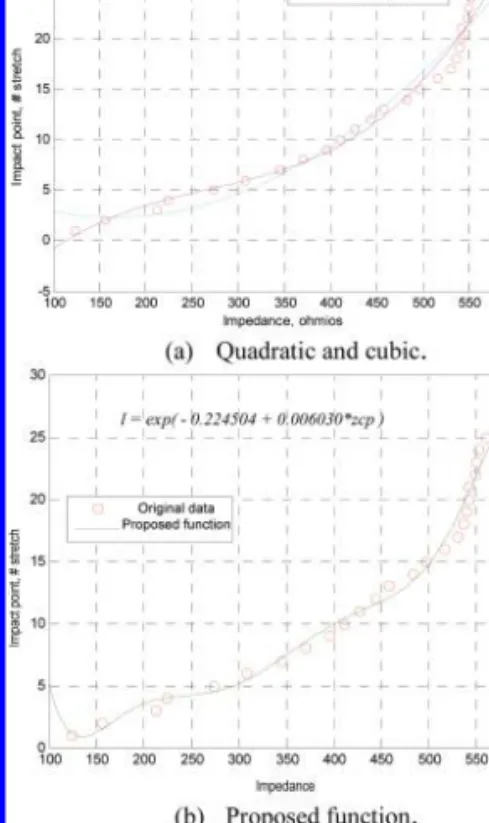
Thus, by using a regression procedure, it is pos- sible to determine two functions useful to localize the flash impact point.
In order to extract the best patterns, different functions were analyzed on the two patterns as are presented in Figure 5.
However, after a detailed analysis it is possible to determine two functions corresponding to direct and indirect faults as are shown in Figure 5b. These functions are mathematically expressed as follows:
z
lb zpc
l
((
. 8 .8)
2 (9)lf
l e p
( (
zpcz)
(10)where lb and lf represent the lightning impact point corresponding to indirect and direct faults, respectively.
In addition, from Figure 4 it is also possible to observe that using the impedance value, it is pos- sible to determine whether the lightning hits the tower or the phase conductor, respectively.
Finally, faults produced by lightning strokes are tested through the proposed methodology. Similar to the previous analysis, the lightning signals must be projected onto the principal components axes, which is developed through using equations (6) and (7). Later on, these signals projected are used to calculate the impedance value through equa- tion (8). Finally, the impedance value is analyzed through the two functions of lightning localization equation (9) and equation (10).
5 CONCLUSIONS
In this work, a novel methodology useful to deter- mine the lightning impact point on transmission lines based on principal components principal is presented. Thus, the impact point is determined through the relation between the voltage and cur- rents signals with data windows of ¼ of cycle.
Results show that the methodology can esti- mate the impact point, considering both the most important elements of Electric Power Systems and crucial features of atmospheric discharges.
By using a regression process, two functions useful to localize the impact point of flashover and back-flashover are determined.
REFERENCES
Andersson, G., P. Donalek, R. Farmer, N. Hatziargyriou, I. Kamwa, P. Kundur, N. Martins, J. Paserbe, P. Pour- beik, J. Sanchez-Gasca, R. Schulz, A. Stankovic, C.
Taylor, and V. Vittal, “Causes of the 2003 Mayor Grid Blackouts in North America and Europe, and Recom- mended Means to Improve System Dynamic Perform- ance,” IEEE Trans. Power Systems, vol. 20, no. 4, pp.
1922–1928, November. 2005.
Figure 4. Relation between the impedance value and the lightning impact point.
Figure 5. Function to direct faults (a) quadratic and cubic functions; (b) function proposed in this work.
EMIE2015_Book.indb 10
EMIE2015_Book.indb 10 2/25/2015 3:21:01 PM2/25/2015 3:21:01 PM
11 CIGRE WG 33-02. “Guidelines for representation of
network elements when calculating transients”. 1990.
Costa, F.B., B.A. Souza, N.S.D. Brito, “Real-time detec- tion of fault-induced transients in transmission lines,”
Electronics Letterns, vol. 46, pp. 753–755, May, 2010.
Diendorfer, G., W. Shulz, “Ground flash density and lightning exposure of power transmission lines,”
Power Tech Conference Proceedings, IEEE, Bologna, 2003.
EPRI AC Transmission Line Reference Book-200kV and Above, Third Edition, Electric Power Research Insti- tute, December 2005
Farshad, M., J. Sadeh, “Accurate Single-Phase Fault- Location Method for Transmission Lines Based on K-Nearest Neighbor Algorithm Using One-End Volt- age,” IEEE Trans. Power Delivery, vol. 27, pp. 2360–
2367, Oct., 2012
Johns, A.T., S.K. Salman, “Digital Protection for Power Systems,” 1st ed. London: Peter Peregrinus, 1997.
Lee H. and A.M. Mausa, “GPS travelling wave fault loca- tor schemes: Investigation into the anomalous meas- urements related to lightning strikes,” IEEE Trans.
Power Delivery, vol. 11, pp. 1214–1223, Jul., 1996 Lin, S., Z.Y. He, X.P. Li, Q.Q. Qian, “Accurate Travel-
ling wave time-frequency characteristic-based fault location method for transmission lines,” Generarion, Transmission & Distribution, IET, vol. 6, pp. 764–772, August, 2012
McLaren, P.G., M.A. Redfem, “Fourier-Series Tech- niques Applied to Distance Protection,” Proceedings of the IEE, vol. 122. no.11, pp. 1301–1305, November.
1975
Mills, E. “Extreme Grid Disruptions and Extreme Weather, Lawrence Berkeley National Laboratory,”
U.S. Disaster Reanalysis Workshop, May 3, 2012 Morales, J.A., E.A. Orduña, “Patterns Extraction for
Lightning Transmission Lines Protection Based on Principal Component Analysis,” IEEE Latin America Transactions, vol. 11, no. 1, pp. 518–524, Feb. 2013.
Rebizant, W., J. Szafran and A. Wisniewski, “Digital Sig- nal Processing in Power System Protection and Con- trol,” Springer-Verlag London, 2011
Sharafi, A., M. Sanaye-Pasand, P. Jafarian, “Ultra-high- speed protection of parallel transmission lines using current travelling waves,” Generation, Transmission &
Distribution, IET, vol. 5, pp. 656–666, June, 2011 The Working Group on Lightning Protection for Trans-
mission System, “Lightning Observation on Japan Sea Coast in Winter, ” CRIEPI Report No.T11 (1989) (in Japanese)
Zhicheng, W.U. “Analsis of transmission lines in spe- cial regions with high lightning strike rates and its countermeasures,” 20th International Conference on Electricity Distribution, CIRED, Prague, 2099. pp.
8–11.
EMIE2015_Book.indb 11
EMIE2015_Book.indb 11 2/25/2015 3:21:01 PM2/25/2015 3:21:01 PM
13
Engineering Management and Industrial Engineering – Leung (Ed.)
© 2015 Taylor & Francis Group, London, ISBN 978-1-138-02773-2
A mesh-adaptive data exchange method for solid body field coupling based on Radial Basis Function
L. Huo & T. Yang
College of Aerospace Science and Engineering, National University of Defense Technology, Hunan, Changsha, China
ABSTRACT: This paper focuses on the data interpolation between non-matching thermal-electric meshes. A mesh-adaptive interpolation algorithm based on radial basis function is proposed. The transfer matrix T is derived, and the calculation program used for data exchange between two non-matching meshes based on radial basis function is developed. Several groups of temperature interpolation examples between two non-matching meshes are tested, and the influence made by different parameters on precision is analyzed. The result shows that the algorithm in this paper is efficient and accurate for solid body field interpolation.
is easy to understand and the method is relatively direct. However, some algorithm should be designed to get the mapping nodes, which will decrease effi- ciency when the non-matching meshes are complex.
In integral interpolation method, all of the nodes of one mesh are utilized to interpolate one node of the other mesh. Integral interpolation method is relatively accurate but a huge linear system of equa- tions needs to be solved and long computation time is cost. Therefore, a accurate as well as efficient data exchange method is required.
Compactly supported radial basis function method proposed by Wendland[9] can well solve the issues of above integral inerpolation method, while the compactly supported radius needs to be set arti- ficially, which will lead to a abnormal result or com- putation termination when the dimension of the meshes or the density of grid is unknown. Therefore a mesh-adaptive interpolation method is needed.
In this paper, based on radial basis function method and the idea of mapping point selection in local inter- polation method, a mesh-adaptive data exchange method based on radial basis function is proposed.
Besides, the procedure is programed and 3-D solid body field data exchange examples are analyzed.
2 MESH-ADAPTIVE DATA EXCHANGE METHOD BASED ON RADIAL BASIS FUNCTION
2.1 Radial basis function
A group of points at different position in Euclidean space is given X = {x1, x2, …, xN} ⊆ Rn. Assum- ing that the functional value on these points is 1 INTRODUCTION
As the rapid development of computer and cou- pling algorithm, the issue of multi-field coupling attracts increasing focus in engineering application field[1–4].
Thermoelectricity coupling is a hot topic in the design of reentry capsule. During the course of reentry, severe aerodynamic heating result in the large temperature gradient in the antenna window of the capsule. The temperature gradient can cause the gradient of material’s dielectric coefficient of the antenna window, which can significantly influ- ence the efficiency of the antenna.
The nature of thermoelectric coupling is solid body field coupling, and one of the problems in ther- moelectric coupling calculation is the assignment of the dielectric coefficient according to the electric mesh nodes’ temperature, while the temperature of electric mesh nodes is interpolated by the non- matching thermal mesh nodes’ temperature. There- fore the efficient data exchange can be inverted into the issue of interpolation between two non-matching mesh in solid field. Coupling data exchange, which has significant influence efficiency, is a important step in multi-field coupling computation, and it is one of the major topics in the relevant field[5, 6]. The problem to solve in coupling data exchange is the two-way interpolation in two non-matching meshes generated by different calculation modules. Cou- pling data interpolation methods generally can be divided into two groups: local interpolation[7], such as Constant Volume Transfer (CVT) method and weighted residual method, and integral interpola- tion, such as spline function method and radial basis function method[8]. Local interpolation method
EMIE2015_Book.indb 13
EMIE2015_Book.indb 13 2/25/2015 3:21:01 PM2/25/2015 3:21:01 PM
14 g1, g2, …, gN a continuous function passing through these points can be obtained. If the function is in the (1) form, it is called Radial Basis Function (RBF). RBF is a unary function, and the argument is the spatial distance. The expression is as follows:
f xx)=
∑
aajφ(
xxx−xxj)
(1)where aj is the coefficient to be solved, and x is the coordinate X(x, y, z) of unknown node. xj is the coordinate of the known node No. j and φ is the selected radial basis function. x xj is the Euclidean distance between known node No. j and the unknown node. The expression is
x xxi = (xx−xxxiii)2++(y(yy yyyyiii)2+(zz zzii)2 (2) Major types of radial basis function are:
1. Gauss distribution function
φ
( )
x e−c2x2 (3)2. Multi-quadric function (β is a positive real number)
φ
( )
x(
cc + x)
β (4)3. Inverse multi-quadric function (β is a positive real number)
φ
( )
x(
cc + x)
−β (5)When β is defined, the shape of basis function is controlled by Multi-quadric function with c.
2.2 Mesh-adaptive radial basis function method In this paper, multi-quadric function is selected as the radial basis function, and β=0 5. , c=10−3 is set.
It is assumed that the number of nodes in two non-matching meshes is M and N respectively, namely
X R
X R
M N
1 1
X
X 2 3
2 1
X 2 3
⊆ x2 xM
⊆ x2 xN { ,xx11 , , }
1,
{xx1 , , } (6)
where X1 is the source field, and X2 is the interpo- lated field. The functional value on two meshes is as follows:
U g g
U g g
M N
1 1
U g
U 2
2 1
U g
U 2
{ ,gg1 }
{ ,gg1 } (7)
For each xl XXX2, n nodes in X1 that are most closed to xl are selected and the radius of the corresponding region is set as the interpolation radius. Then aj can be determined by the interpo- lation condition:
f xi aaj g i j M
j n
) i
xi =
∑ ∑
=1aφφ(
xxi−xxj)
=gi,, ii ji ∈( , ) (8) where gl is the functional value at xi. Then a simul- taneous linear equations system is got:AU=G (9)
where
A=[aj]] ,T j=1 2, ,, ,n (10) U=φ
(
−)
, i ji =1 2, ,, …,n (11)G=[ ]i] ,T i=1 2, ,, ,n (12) By solving equation (12), we can get
A GU−1 (13)
Bring the solution of equation (13) into equa- tion (14):
f xxll)=
∑ ∑
aaaajφφ(
xxll−xxj)
(14)We can get the functional value at interpolated nodes xl.
By the above method, we can get all the nodes’
functional value in XXX2, namely, the interpolation in two coupling non-matching meshes is completed.
3 ALGORITHM TEST AND ANALYSIS It is assumed that the temperature distribution function is as follows:
T y z x y
z
( ,x , )z sin( / ) i ( / ) sin( / ) *
=sin(x×
⋅sin(z×π// y +π π//
) i (i (y×π//
)⋅sin(y× //
1000 1000 (15) The first test example is a cubic computation domain, 0 x 1 01 00 yy 1 01, 1. The nodes in all the meshes are generated randomly. The node numbers of mesh1 to mesh4 are 500, 700, 900 and 1100 respectively.
First, the temperature distribution function is utilized to get the nodes’ temperature of each mesh. Then the mesh-adaptive radial basis function method is employed to interpolate the temperature distribution (TTT2i) in one mesh by that of a other
EMIE2015_Book.indb 14
EMIE2015_Book.indb 14 2/25/2015 3:21:01 PM2/25/2015 3:21:01 PM
15 mesh, and TTT2i is contrasted to the temperature distribution solved before to get the error. Five groups are set. In Group1 (G1) mesh1 is used to interpolate mesh2. In G2 mesh2 is used to inter- polate mesh3. In G3, mesh3 is used to interpolate mesh4. In G4 mesh1 is used to interpolate mesh3.
In G5 mesh1 is used to interpolate mesh3.
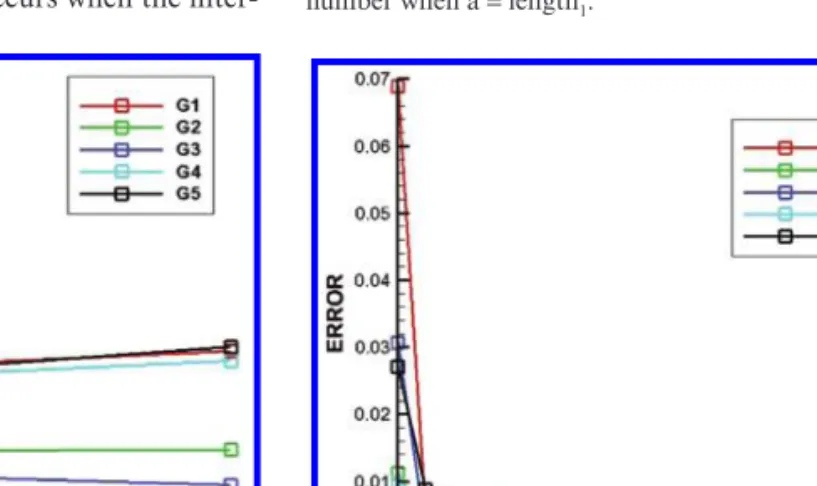
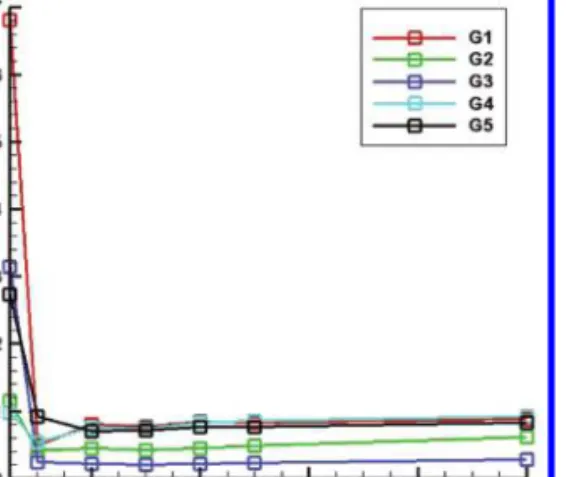
It is assumed that the distance between the interpolated point pi and the most closed node in temperature field is length1, and the number of interpolation points is n, and the distance between the interpolated point pi and the number n most closed node in temperature field is lengthn. The parameter a is set as 0.001, length1, (length1+ lengthn)/2 and lengthn respectively. As the computation time is mainly related to the nodes number in the non-matching meshes, it is assumed that in each group the computation time is identical, which is equal to that when a is 0.001. The average error and maximum error in each group with different value of a are shown in Figure 1–Figure 8.
According to Figure 1–Figure 8, except for a = 0.001 in G4, the average error and maximum error in each groups are all decrease along with the increase of the interpolation nodes. In G5, the ratio of interpolation nodes number to inter- polated nodes number is λ = 500/1100 = 0.4545, and it is the minimum in 5 groups, that is to say the known information (nodes number in mesh1) is the least compared with the unknown nodes’
information (nodes number in mesh2). There- fore, the average error of G5 is the maximum in 5 groups. It is on the other way round that the ratio of G3 is λ= 900/1100 = 0.8182, which is the larg- est in 5 groups. And the average error of G3 is the minimum. When the value of a is different, the maximum error (about 7%) occurs when the inter-
Figure 1. Relationship between average error and node number when a = 0.001.
Figure 2. Relationship between maximum error and node number when a = 0.001.
Figure 3. Relationship between average error and node number when a = length1.
Figure 4. Relationship between maximum error and node number when a = length1.
EMIE2015_Book.indb 15
EMIE2015_Book.indb 15 2/25/2015 3:21:05 PM2/25/2015 3:21:05 PM
16
polation nodes number is the least in G1. This may caused by that the nodes numbers of the two meshes in G1 are the least and known information is insufficient. When the number of interpolation nodes is larger than 20, the maximum error in each group is less than 2%.
Then the change of the average error and maxi- mum error in each group along with a is analyzed.
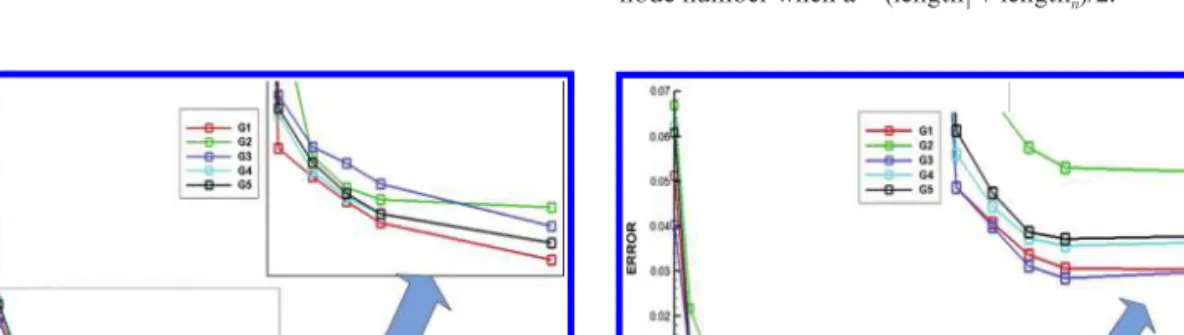
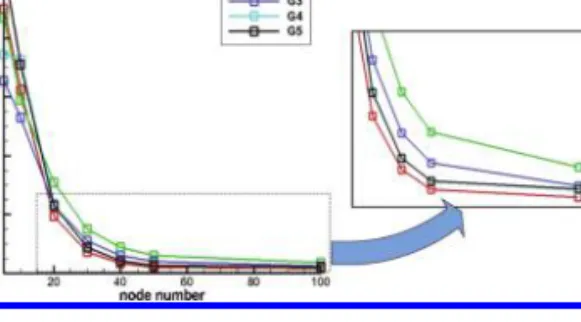
When a = 0.001, the average error and maximum error in each group reach their maximum. When a = lengthn, the average error and maximum error in each group reach their minimum. While the average error and maximum error do not vary monotonically along with the increase of a: both of the average error and maximum error when a = length1 and a = lengthn are less than that when a = (length1 + lengthn)/2. In all the groups, the average errors are less than 0.11%, and the maxi- mum errors are less than 2% when the interpola- tion nodes number is large enough. Therefore the precision can fit engineering calculation.
To sum up, to solve the interpolation issue bet- ween two non-matching meshes in solid body field, a mesh-adaptive radial basis function method is adapted. Test examples are employed to validate the algorithm. The result shows that the computation error is related to the parameter a, the density of grid and the number of interpolation nodes. When an appropriate interpolation node number is set, the computation error is so small as to satisfy the engi- neering requirement.
A spheric domain test example is also employed to validate the algorithm. And the same conclusion can be brought.
The coordinate of the sphere is (0, 0, 0), and the radius is 1. The temperature distribution func- tion is as equation (15) and the node numbers Figure 5. Relationship between average error and node
number when a = (length1+ lengthn)/2.
Figure 6. Relationship between maximum error and node number when a = (length1+ lengthn)/2.
Figure 7. Relationship between average error and node number when a = lengthn.
Figure 8. Relationship between maximum error and node number when a = lengthn.
EMIE2015_Book.indb 16
EMIE2015_Book.indb 16 2/25/2015 3:21:05 PM2/25/2015 3:21:05 PM
17 Figure 9. Relationship between average error and node number when a = 0.001.
Figure 10. Relationship between maximum error and node number when a = 0.001.
Figure 11. Relationship between average error and node number when a = length1.
Figure 12. Relationship between maximum error and node number when a = length1.
of mesh1 to mesh4 are 794, 484, 1562 and 1070 respectively. The interpolation groups are the same as the cubic domain example. The average error and maximum error in each group with different value of a is shown in Figure 9–Figure 16.
Figure 13. Relationship between average error and node number when a = (length1+ lengthn)/2.
Figure 14. Relationship between maximum error and node number when a = (length1+ lengthn)/2.
Figure 15. Relationship between average error and node number when a = lengthn.
EMIE2015_Book.indb 17
EMIE2015_Book.indb 17 2/25/2015 3:21:06 PM2/25/2015 3:21:06 PM
18 4 CONCLUSION
In this paper, a mesh-adaptive radial basis func- tion method is adapted to solve the interpolation issue between two non-matching meshes in solid body field. The equations of mesh-adaptive radial basis function are deduced and the calculation pro- gram is developed. A cubic domain and a spheric domain test examples are employed to validate the algorithm. We can safely conclude from the result that the algorithm proposed in this paper shows good precision and can be suit for the typical solid body field. By set appropriate parameters, the computation efficiency and precision can be well satisfied in engineering application.
Figure 16. Relationship between maximum error and node number when a = lengthn.
REFERENCES
[1] Gupta K.K. Aeroelastic Simulation of Hypersonic Flight Vehicles[J]. AIAA Journal, 2012, 50 (3): 717–723.
[2] Miller Brent A., Crowel Andrew R., Mcnamara Jack J.
Loosely Coupled Time-Marching of Fluid-Thermal- Structural Interactions[C]. 54th AIAA/ASME/ASCE/
AHS/ASC Structures, Structural Dynamics, and Materials Conference. Boston, Massachusetts, April 8–11, 2013, 2013.
[3] Ghoman Satyajit S., M. Salim Azzouz. Supersonic Aerothermoelastic Nonlinear Flutter Study of Curved Panels: Time Domain[J]. Journal of Aircraft, 2012, 49 (4): 1179–1183.
[4] Cheng Xing-hua. Coupled Aerothermoelastic Mod- eling and Analysis of Thermal Protection Panel for Hypersonic Vehicles[D]. NUDT, 2012.
[5] Han Xiang-ke, Qian Ruo-jun, Su Bo. Data Exchange Method for Fluid-structure Interaction Based on Interpolation Algorithm Adopting Com- pactly Supported Radial Based Function[J]. Jour- nal of Tongji University (Natural Science), 2011, 39 (1): 48–51.
[6] Song Shao-yun, Li Shi-qi. Mixed Method of Node Load Interpolation in Collaborative Simulation of Coupled Problem[J]. Computer Simulation, 2006, 23 (8), 73–75.
[7] Wu Zong-min. Model, Algorithm and Theory for Scatter Data Fitting[M]. Beijing: Science Press, 2007.
[8] Wei Yi-kun, Yang Wei, Liu Jing. Interpola- tion Method of Radial Basis Function and Its Application[J]. Journal of Shen Yang University[J], 2008, 20 (1): 7–9.
[9] Wendland Holger. Piecewise polynomial, positive definite and compactly supported radial functions of minimal degree[J]. Advances in Computational Mathematics, 1995, 4: 389–396.
EMIE2015_Book.indb 18
EMIE2015_Book.indb 18 2/25/2015 3:21:07 PM2/25/2015 3:21:07 PM
19
Engineering Management and Industrial Engineering – Leung (Ed.)
© 2015 Taylor & Francis Group, London, ISBN 978-1-138-02773-2
Data flow issues and BPMN mapping to Petri Net: Road map
Ahmed Elajeli Saleh Rgibi
Department of Data Analysis, Zawia University, Zawia, Libya
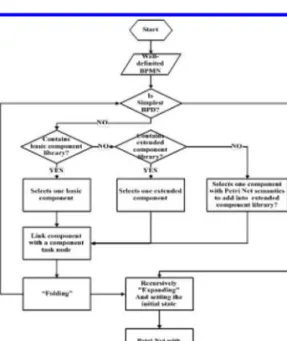
ABSTRACT: There are two important aspects of workflow to be considered: flow of control and flow of data. In terms of data in workflows, there is a little reported in literature. The problem of dataflow is becoming more and more prominent as the workflow system gets more complex. Verification of data flow has not been studied as extensively as verification of control flow. The dataflow verification in workflow processes is very important. Several possible errors in the dataflow are identified, such as the missing, losing, and the redundant data error. No means for checking these errors are provided. There are sev- eral challenging problems associated with dataflow issues such as: (1) how to discover errors relating to the dataflow; (2) how to analyze and verify the absence of dataflow errors in workflow system; (3) how to evaluate dataflow issues in workflow system. The objective of this paper is to provide a systematic technique of possible flows related to the flow of data in business process, check and analyze the data- flow issues. The research work of this paper illustrates dataflow issues approach procedure and mapping PBMN to Petri Net.
A task makes use of current data to generate fresh data, which can be either a new data item or a new value of an existing data item. For example, an XOR split (decision) node needs data to enable it to choose one of the alternative outgoing paths.
A task or decision node can execute successfully only if the required data is available. The inputs data requirements of individual decision nodes and the inputs/outputs data specifications of indi- vidual tasks are assumed to be known by the proc- ess designer. However, this does not ensure that every task and decision node in a workflow can get the data needed at the time of execution and that no data anomalies can occur. Data flow anal- ysis is a testing method for detecting improper use of data in workflow system. The data flow is an essential part of workflow execution in conjunc- tion with control flow, and it is important to make the system work. Activities in a workflow model provide necessary data to their underlying appli- cation components and human performers cor- rectly to identify the context of the work they are supposed to carry out, and the dataflow-analysis- based workflow design starts with identifying the set of activities needed to be included in a work- flow and their input and output data through analyzing existing business processes.
1 INTRODUCTION
Workflow is viewed as a set of tasks, which is systematized to achieve certain business goals by completing each task in a particular order under automatic control [1]. Resources are required for workflow implementation to support process execution. Resource allocation and resource con- straint analysis are the popular workflow research topics.
The workflow concept has become the standard paradigm for process modeling in Business Proc- ess Management (BPM) systems. Workflows are typically looked from two important aspects of a workflow (also called a business process): flow of control and flow of data. The control flow describes the logical order of tasks; and the data flow describes the information exchange between tasks. There are a series of concepts that are applied to the representation, and utilization of data within workflow systems. These concepts not only define the manner in which data in its various forms can be employed within a business process and the range of informational concepts that a workflow engine is able to capture, but also characterize the interaction of data elements with other workflow and environmental constructs.
EMIE2015_Book.indb 19
EMIE2015_Book.indb 19 2/25/2015 3:21:07 PM2/25/2015 3:21:07 PM