Use of generic descriptive names, registered names, trademarks, service marks, etc. in this publication does not imply, even in the absence of a specific statement, that such names are exempt from the relevant protective laws and regulations and are therefore free for general use. He has co-authored many books in Chinese and also co-authored the book "Modern Emergency Management" in English.
Basic Knowledge of Epidemic Dynamics
Adequate Contact Rate and Incidence
From the second equation of the system (M1), we see that 1/(b+γ) is the average course of the disease. Therefore, R0 =βk/(b+γ ) is the average secondary infection contracted by an individual from infectious during the entire course of the disease, which is just the reproduction number.
Epidemics Control and Logistics Operations
- Preparedness
- Outbreak Investigation
- Response
- Evaluation
This will enable them to proceed with the necessary adjustments or modifications of the measures initially adopted so that the new measures meet the data. The evaluation of the timeliness that had to be respected during the control of the epidemic.
Future Directions for Epidemic-Logistics Research
In terms of disease prevention and control plans, first, most authors ignore the side effects of medical interventions. System review of an electronic surveillance system for early notification of community epidemics (ESSENCE II).
Epidemic Dynamics in Anti-bioterrorism System
Introduction
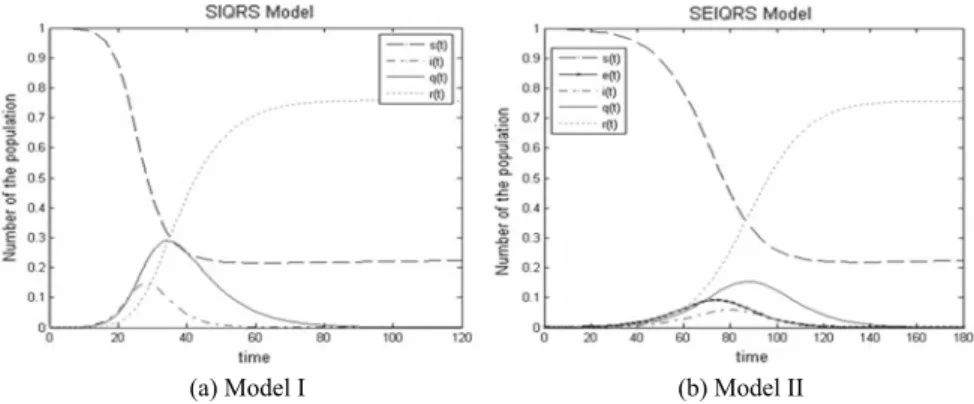
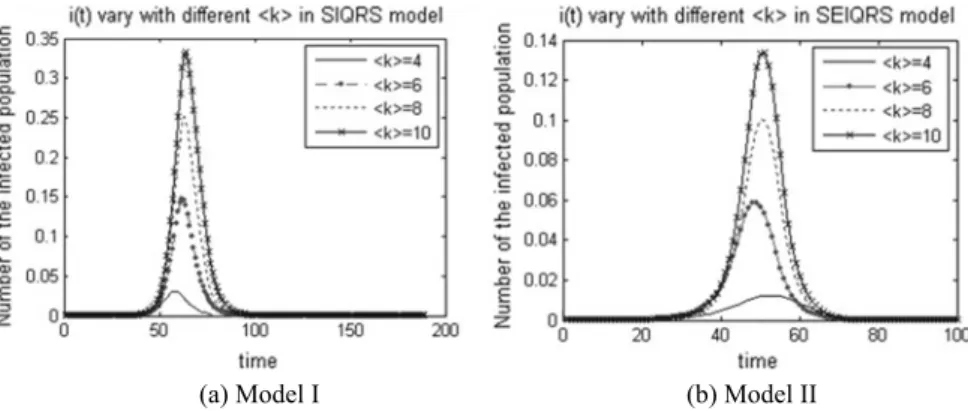
SIQRS Epidemic Diffusion Model
SEIQRS Epidemic Diffusion Model
Computational Experiments and Result Analysis
Epidemic Dynamics Modeling for In fl uenza
Introduction
The number of susceptible individuals decreases as the incidence (ie, the number of infected individuals per unit time) increases. The value of R0 can also be calculated backwards from the final size of the epidemic.
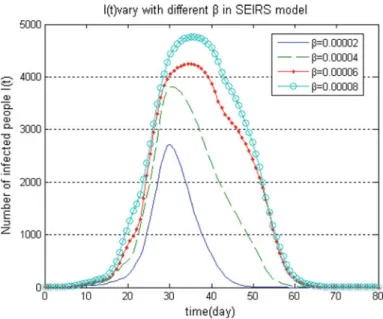
SEIRS Model with Small World Network
On the other hand, according to Eq. 2.34), we can get another balance result as follows:. 2.36). Based on the Routh-Hurwiz stability criterion, when β < d<+μk>, the real parts of the two characteristic roots are negative.
Emergency Demand Base on Epidemic Diffusion
Numerical Test
Such an operation will not affect the final comparison result. 2.27), by keeping all the parameters fixed as in the above numerical example, we can get the demand for medicine resources by the proposed model, which is shown in Fig.2.11. Therefore, medicine resources in local health departments should be distributed to the hands of the infected people as soon as possible.
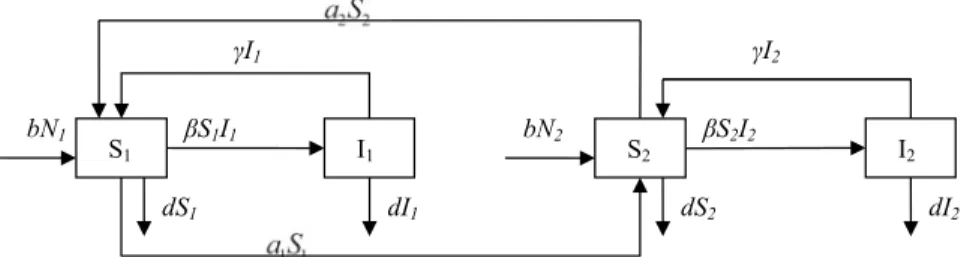
Epidemic Dynamics Considering Population Migration
- Introduction
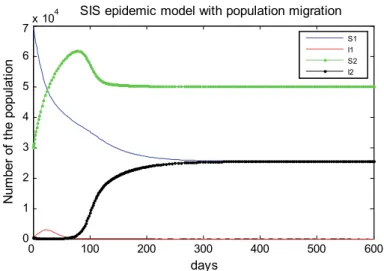
- Epidemic Model with Population Migration
- Model Analysis
- Numerical Test
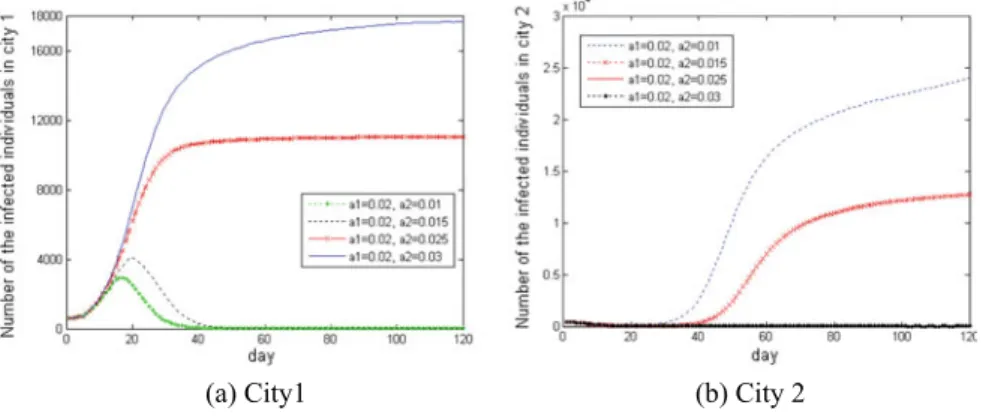
Figure 2.14 shows the change in the number of infected individuals in both cities with different multiplication coefficients. Figure 2.15 shows the change in the number of infected individuals in both cities with different recovery ratesγ.
Introduction
In this chapter, we build a unique forecasting model for the demand for emergency resources based on the epidemic distribution rule when a bioterrorist attack is suffered. Furthermore, as previously mentioned, the demand for emergency resources in an anti-bioterrorism system is different from that in other disasters (eg, flood, typhoon, and earthquake).
Literature Review
Literature Related to Epidemic Prevention
It is worth noting that most of the previous work relies on different types of differential equations. For example, first-order partial differential equations are used to integrate age structures; second-order partial differential equations are suitable if there is a diffusion term; and integral differential equations or differential equations are often used when time delay or delay factors are considered [3].
Literature Related to Emergency Distribution
3] construct a multi-objective stochastic programming model with time-varying demand for the emergency logistics network based on the rule of epidemic spread. Therefore, in this chapter we construct a unique forecasting model for the demand for emergency resources based on the rule of epidemic spread when exposed to a bioterrorist attack.
Demand Forecasting Based on Epidemic Dynamics
SEIQRS Model Based on Small-World Network
The experiment results show that the mixed system can save an average of about 10% of the total distance traveled compared to either of the two pure systems. It is desirable that these two parameters remain as low as possible, which means that the situation is stable and the spread of the epidemic is under control.
Demand for Emergency Resources
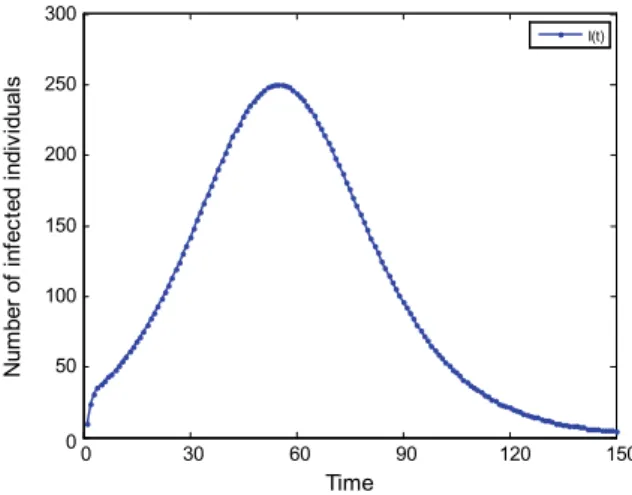
In such an epidemic diffusion model, the time-based parameters S(t), E(t), I(t), Q(t) and R(t), represent the number of susceptible people, the number of people during the period of incubation, the number of infected people, the number of quarantined people and the number of recovered, respectively. It is desired that these two parameters stay at a value as low as possible, which means that the situation is stable and the spread of the epidemic is under control. where represents the demand for emergency resources in the epidemic area at the appropriate time.
Model Formulations
Point-to-Point Distribution Mode with no Vehicle
3.3) According to the above formulas, the demand for emergency resources in the epidemic area can be predicted when the initial values of relative parameters are specified. Equation (3.9) states the demand for emergency resources in the demand node (as introduced in Sect.3.3.2).
The Multi-depot, Multiple Traveling Salesmen
Equation (3.18) is a constraint on the feasible route, which ensures that the total emergency demand on the feasible route does not exceed the vehicle's capacity.
The Mixed-Collaborative Distribution Mode
Thus, a mixed-cooperative mode, which allows both of these two distribution modes to coexist, is proposed in the following with the aim of balancing the overall rescue distance and timeliness. 3.4.1, the mixed distribution problem can be formulated as follows (M3): 3.41) Equation (3.25) is the objective function that searches for the maximizing actuality.
Solution Procedures
Operating Instructions for Genetic Algorithms
The first step, which is also characteristic of new "genetic algorithms", is to define the coding of chromosomes as follows. The first part of the chromosome represents the serial number of the emergency supply warehouse.
The Solution Procedure
Computational Experiments and Result Analysis
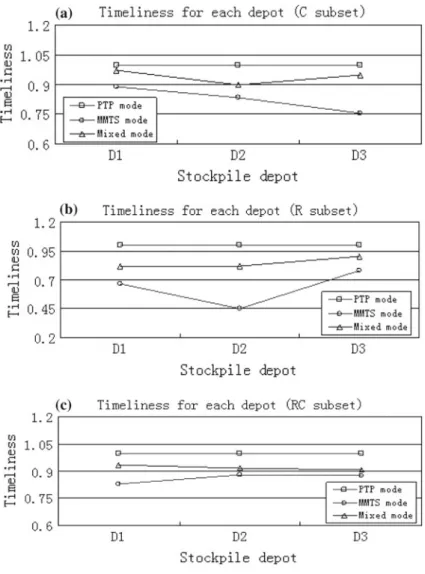
Comparison and Analysis for Each Stockpile Depot
Furthermore, we assume that the emergency rescue costs are directly proportional to the total distance. The total emergency rescue costs in this mode will therefore also be the largest.
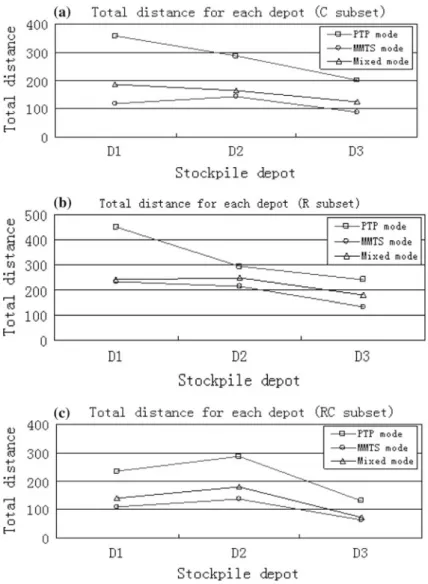
Comparison and Analysis for Total Distance
For the three subsets C, R, and RC, when the mixed-collaborative mode is applied, the total distance is increased by 12.7%, respectively, compared to the MMTS mode (Table 3.3). Computational experiments and results analyzes in this section show that the mixed-collaborative distribution model is expected to be an effective decision-making aid in the event of a bioterrorist attack.
Conclusions
To verify the validity and feasibility of the mixed cooperation mode, we compare it with the two pure distribution modes from both the aspects of distance and time. In this chapter, we present a discrete time-space network model for the allocation of medical resources after an epidemic outbreak.
Introduction
It couples a prediction mechanism for the dynamic demand for medical resources based on an epidemic diffusion model and a multi-stage programming model for optimal allocation and transport of such resources. In this chapter, a spatio-temporal network model is proposed for the problem of medical resource allocation in controlling epidemic spread.
Literature Review
Epidemic Diffusion Modeling
The second stream of research is on the development of epidemic distribution models by applying complex network theory to the traditional compartment models [6-8]. The third stream of research is on the development of epidemic distribution models by applying simulation methods, including computer simulation and numerical calculation [11-13].
Medical Resource Allocation Modeling
The above works represent part of the research on different differential equation models for epidemic spread and control. 26] constructed a multi-objective stochastic programming model with time-varying demand for the emergency logistics network based on the epidemic diffusion rule.
The Mathematical Model
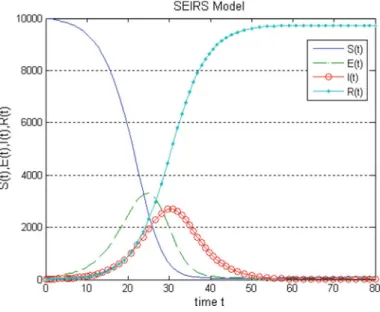
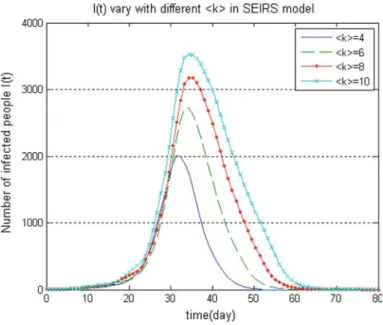
SEIRS Epidemic Diffusion Model
ODE (4.1) states the following: (i) The growth rate of the susceptible population is determined by the rebound population that has recovered but is not immune and. The growth rate of the infected population is determined by the difference between the input population, those of the exposed population who become ill, and the output population who are either cured or dead;
The Forecasting Model for the Time-Varying
And finally (iv), the growth rate of the recovered population is determined by the difference between the joined population of the newly recovered and the losing population of the reinfected people. In particular, as we noted in (iii), the number of infected individuals, I(t), is determined by the population of the recovered individuals and the exposed individuals that emerge at the end of the incubation period.
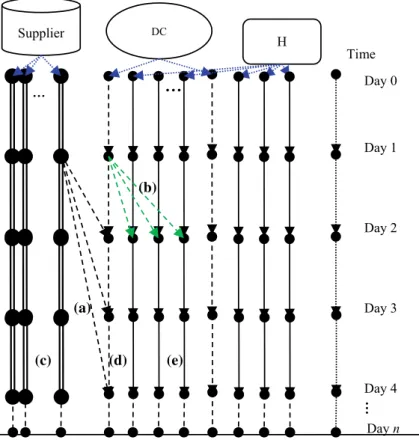
Time-Space Network of the Medicine Logistics
The objective function (4.7) is to minimize the total cost of medical resource allocation, which is the transportation cost for delivering the medical resource from ADCs to DOSs and from DOSs to EDHs. In this, ηi t is the growth factor (can be either positive or negative) of the demand for medical resource in EDHiin decision cycle.
Solution Methodology
Constraint (4.9) ensures that the total shipments from any ADC cannot exceed the available amount of the resource in that ADC. It is obvious that the lower the total cost, the better the fitness of the individual.
Numerical Tests
A Numerical Example
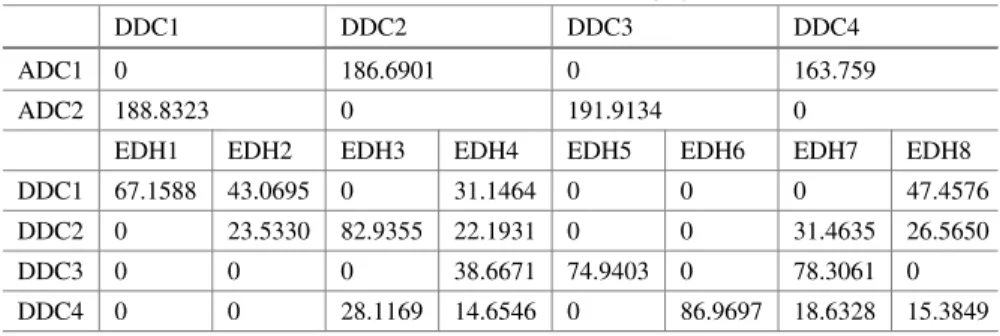
Then, the ED of medical resource in each EDH in each decision cycle can be predicted according to Eqs. Using EDH1 as an example, the demand for medical resources in each decision cycle is compared by these two different methods as shown in Fig.4.6.
Model Comparison
Comparing Figure 4.7 with Figure 4.6, we can see that the total operating cost curve matches the demand curves well in their variation pattern, suggesting that the cost of health resource allocation is mainly dependent on demand. We attribute this significant cost reduction to our proactive forecasting, which takes into account the positive impact of early allocation of healthcare resources to demand in subsequent periods.
Sensitivity Analysis
The demand for medical resources in each decision cycle is shown in Figures 4.10 and 4.11. The shorter it is, the lower the demand and thus the lower the total cost.
Conclusions
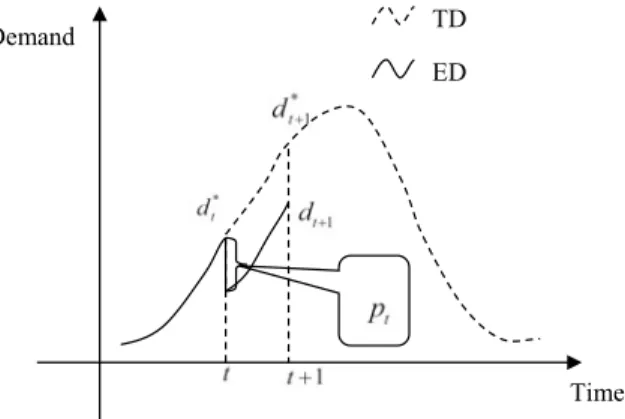
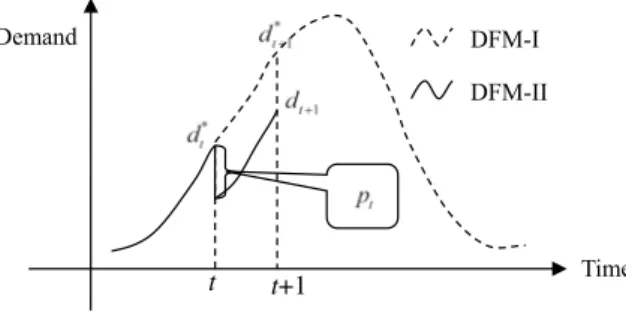
Equation (6.2) is a traditional forecasting model for time-varying demand. dt∗ means the demand for emergency resources in the epidemic area at time t,t ∈ 0,1,2,. In this work, a brief sensitivity analysis of the key parameters (θand) in the forecasting model for time-varying demand is carried out.
Medical Resource Is Limited
Introduction
18] studied the impact of yield uncertainty (supply side) and self-interested consumers (demand side) on inefficiency in the flu vaccine supply chain. In this study, we attempt to model the interactive coordination process between flu spread and medical resource allocation in the second response phase.
Epidemic Diffusion Analysis and Demand Forecasting
- In fl uenza Diffusion Analysis
- Demand Forecasting
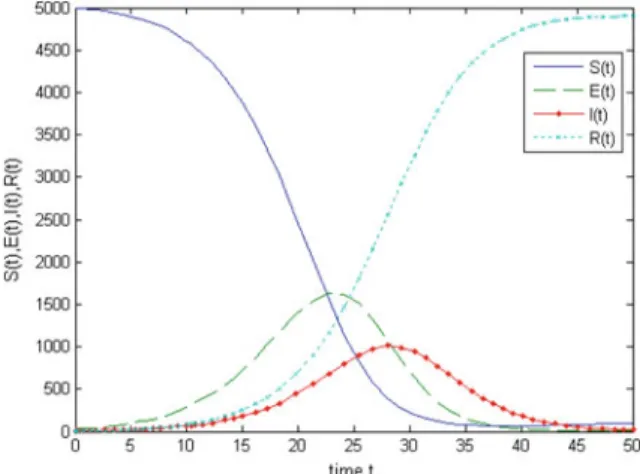
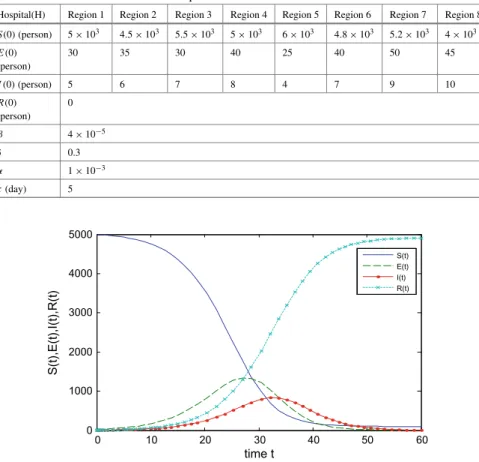
In ODE (5.1), S(t),E(t),I(t)andR(t) represent the number of susceptible persons, the number of exposed persons, the number of infected persons and the number of recovered persons, respectively.β is the propagation coefficient of the flu;δ is the recovery rate; α is the loss percentage; and τ represents the incubation period of the disease. We use a schematic diagram to illustrate the evolution trajectory of the time-varying demand (see Figure 5.2).
The Dynamic Medical Resources Allocation Model
- Model Speci fi cation
- Notation
- Model Formulation
- Solution Procedure
After this, we can predict the demand for medical resources in the =1 decision cycle using Eq. Let F(x,y) be the objective function, the dynamic health resource allocation model can be formulated as follows:.
Numerical Example and Discussion
- Numerical Example
- Comparison and Discussion
- A Short Sensitivity Analysis
Then we can solve the programming model for the second decision cycle and get the medical resource allocation result p2. The reason is that the medical resources are allocated to each hospital according to the share of its demand in the total demand.
Conclusions
As mentioned in the chapters above, the demand for emergency resources is usually uncertain and varies rapidly in anti-bioterrorism systems. Taking into account the emergency resources allocated to the epidemic areas in the early rescue cycles, this will affect demand in the following periods. We build an integrated and dynamic optimization model with a time-varying demand for the emergency logistics network based on the epidemic diffusion rule.
Introduction
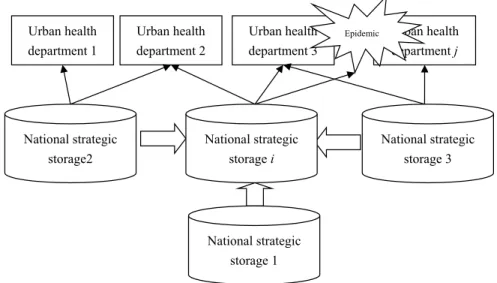
In general, emergency logistics in the anti-bioterrorism system is more complex and difficult and differs from business logistics in the following aspects. In the first stage, because the disaster area has just been hit by a bioterrorist attack, and the bio-virus (such as smallpox, Bacillus anthracis and so on) has not caused a widespread spread, therefore we should provide the existing emergency resources in the local health departments to the disaster areas so soon as possible.
Problem Description
- SEIR Epidemic Diffusion Model
- Forecasting Model for the Time-Varying Demand
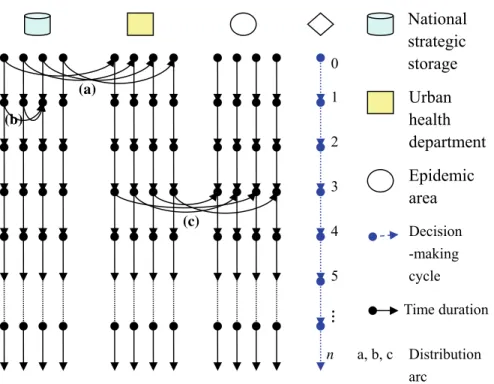
At the highest level, we consider the problem of how to replenish emergency resources in urban health departments. Note that the time-varying demand in the urban health department mainly depends on the unsatisfied capacity.
Optimization Model and Solution Methodology
- The Integrated Optimization Model
- Solution Methodology
12] can be applied in this study with suitable modification as below (Procedure flow diagram is also given in Fig.6.4). If case 2 occurs, then for each recharge arc (Ni,Cj) ∈ Dh, calculate Si jhd, which is an estimate of the improvement in solution value if the recharge arc is transferred from Dh to Dd.
A Numerical Example and Implications
- A Numerical Example
- A Short Sensitivity Analysis
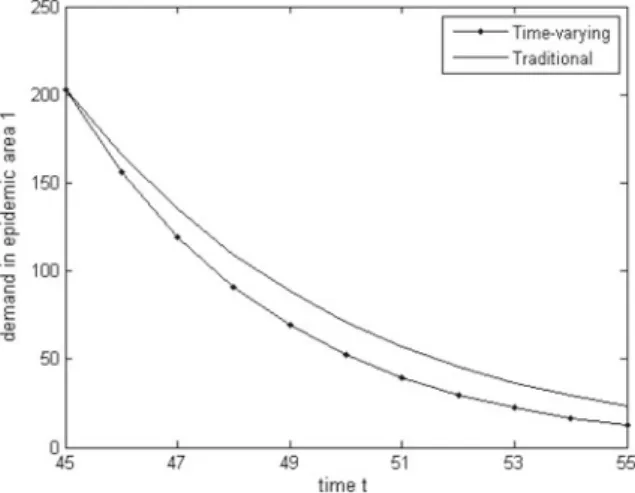
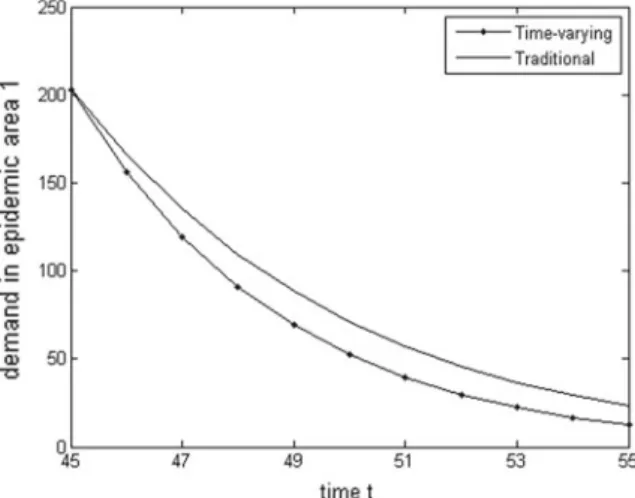
As before, for the example of epidemic area 1, the demand for emergency resources in each rescue cycle with time-varying and traditional predictive models is shown in Figure 6.6. Conversely, the larger the office, the longer the treatment cycle, the greater the need for emergency funds, and ultimately the larger the overall solution.
Conclusions
It takes into account the time evolution and dynamic nature of the demand, which differs from most existing research on the allocation of medical resources. Moreover, in our model, the rationale that the medical resources allocated in early periods will act to suppress the spread of the epidemic spread and thus affect demand in later periods is incorporated for the first time.
Introduction
The epidemic spread model is used to build the forecasting mechanism for the dynamic demand of medical resources. In this study, a three-level dynamic linear programming model is proposed for the allocation of medical resources based on the epidemic diffusion model.
Problem Description
- The Research Ideas and Way to Achieve
- Time-Varying Forecasting Method for the Dynamic
- Dynamic Demand and Inventory for the UHD
The epidemic distribution model introduced here is to construct the prediction mechanism for the dynamic demand of medical resources. To facilitate the calculation process in the following sections, we assume that the initial stock of medical resources in each UHD is zero.
Optimization Model and Solution Procedure
- Optimization Model
- Solution Procedure
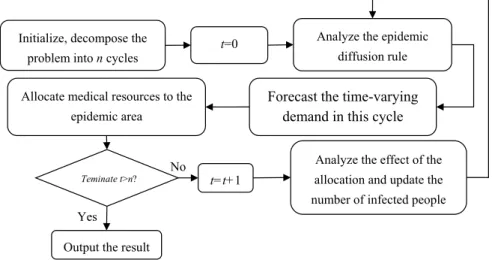
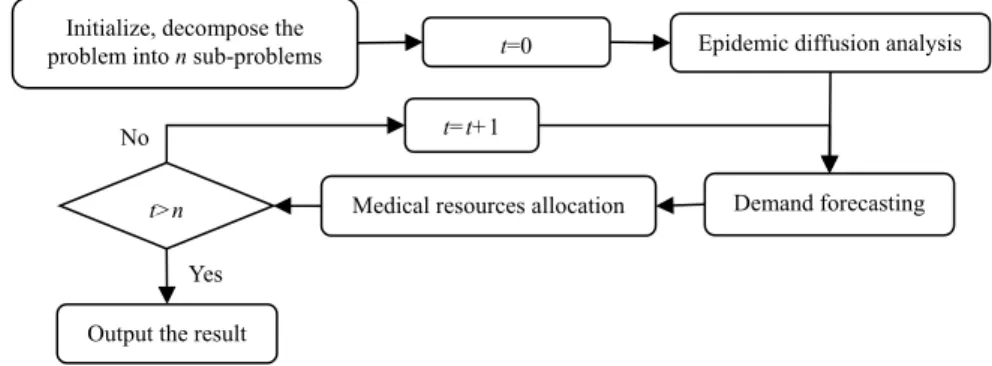
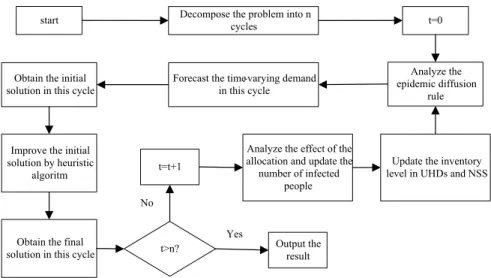
Analyze the epidemic distribution rule, and calculate the initial demand for medical resources in each EDH according to Eq. Let=t+1, if the termination condition for the rescue cycle is not satisfied, update the demand in each EDH, and update the stock level of medical resources in each UDH, go back to Step 3.
Numerical Example
Take the EDH 1 as an example, the demand for medical resources in each rescue cycle is shown in Fig.7.4. It shows that stock level in each UHD has improved and increased over time.
Conclusions
The forecasting mechanism is a time discretized version of the SEIR model, which is widely used in forecasting the path of epidemic spread. The parameters of the prediction engine are adjusted according to the real data collected during the execution phase by solving the quadratic programming problem.
Introduction
In this study, we will present a dynamic logistic model for the allocation of medical resources in reflection of time-varying demand that is synchronized with the spread of the epidemic. Real-world data will be used in the fourth phase to close the loop of the decision cycle.
The Mathematical Model
- Forecasting Phase
- Planning Phase
- Execution Phase
- Loop Closed
The rate of change of the infected population is determined by the difference between the entering population, that of the exposed population becoming diseased, the exiting population, and the transitional population that has recovered; Our model includes drug inventory costs in the variable cost, which is proportional to the number of patients admitted, but does not model reorder point and/or order quantity as decision variables.
Numerical Example
- Test for Forecasting Phase
- Test for Logistic Planning Phase
- Test for Adjustment Phase
The epidemic ends when the number of infected individuals drops to 0, which often happens before all susceptible individuals in the population are infected. Figure 8.4 shows the daily production level of three pharmaceutical factories over time in our model solution.
Conclusions
Regarding the limitation of the model, it still needs to consider possible cross-area diffusion between two or more geographical areas. Future studies could also address other realistic concerns, such as the inventory of the critical medicines and different exit rates of the population groups.
Introduction
Since different infectious diseases have unequal epidemic dynamics and can cause different degrees of public health emergencies, we adjust the epidemic-logistics model by changing the capacity constraint, and then apply the modified model to control the H1N1 outbreak in to control China. Therefore, the custom model can simultaneously determine when to open the new isolated rooms and when to close the unused isolated rooms.
Literature Review
38] developed a disease spread model to estimate the disease spread pattern and combined it with a facility location and resource allocation network model for food distribution. 40] presented a multi-city resource allocation model to distribute a limited amount of vaccine to minimize the total number of deaths due to a smallpox outbreak.
Model Formulation
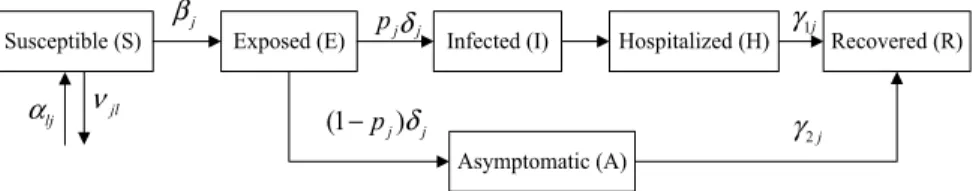
- Epidemic Compartmental Model
- Resource Allocation Model
- Model Solution
Similar to Büyüktahtakın et al. 9.13) gives the number of infected individuals that can be hospitalized according to the number of available isolated wards in the jat time area t. Intuitively, if the number of infected individuals Ij(t) is greater than the remaining capacity in the affected area jat timet, then only Cj(t)−Hj(t) infected individuals can be accepted for treatment.
Case Study
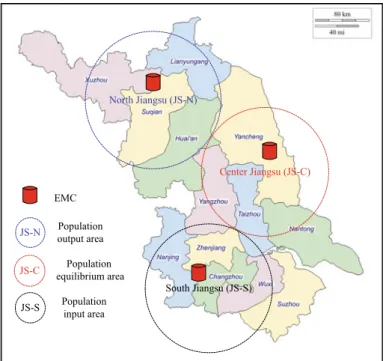
- Background and Parameters Setting
- Test Results
- Discussion
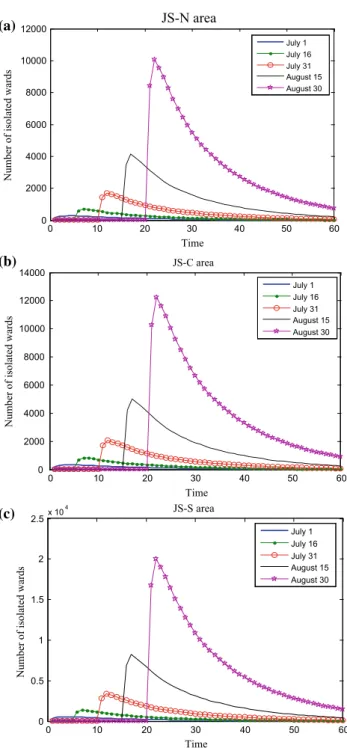
The impact of different start dates of the intervention on the number of infected persons is illustrated in appendix B.3. The impact of different start dates of the intervention on the required capacity of isolated departments is illustrated in Figure 9.5.
Conclusion
Meanwhile, self-quarantine for exposed persons and reducing contact with other susceptible individuals around are also effective strategies for controlling the spread of the epidemic. Therefore, when we treat the time-discrete epidemic distribution model as linear constraints, there will be different total constraints for the integrated epidemic-logistic model.
Introduction
Literature Review
- VMI in Hospital
- Logistics Planning with Different In fl uence Factors
Time-Space Network Model
- Network Structure
- Deterministic Planning Model
- Stochastic Planning Model
Solution Algorithms and Evaluation Methods
- Solution Method for DPM
- Solution Method for SPM
- Evaluation Method
Numerical Tests
- Data Setting
- Test Results
- Sensitivity Analysis
Conclusions
Introduction
Literature Review
Modeling Approach
- Network Structure
- The Deterministic Planning Model (DM)
- The Stochastic Planning Model (SM)
Solution Procedure and Evaluation Method
- Solution Procedure
- Evaluation Method
Numerical Tests
- Parameters Setting
- Test Results
- Sensitivity Analysis
Conclusions
Model I: A Basic Time-Space Network Model
- Introduction
- The Time-Space Network Model
- Solution Algorithm
- Numerical Tests
- Conclusions
Model II: An Improved Time-Space Network Model
- Introduction
- Model Formulation
- The Solution Procedure
- Numerical Tests
- Conclusion
- Introduction
- Model Formulation
- The Solution Procedure
- Numerical Tests
- Conclusions
Emergency Materials Distribution with Time Windows
- Introduction
- SIR Epidemic Model
- Emergency Materials Distribution Network
- Numerical Tests
- Discussion
- Conclusions
An Improved Location-Allocation Model for Emergency
- Introduction
- Model Formulation
- Solution Procedure
- Numerical Test
- Conclusions