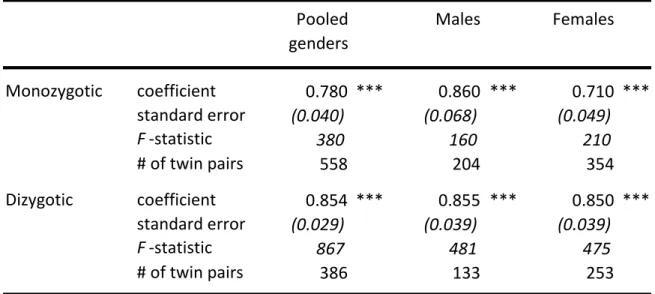
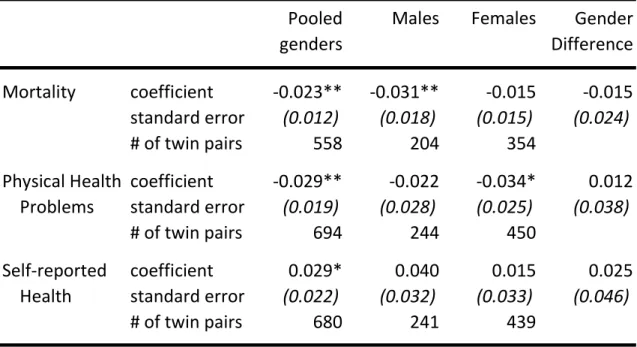
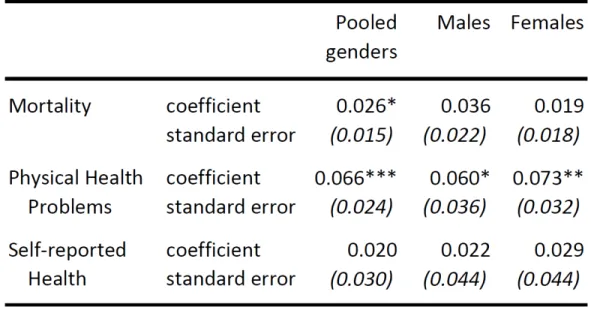
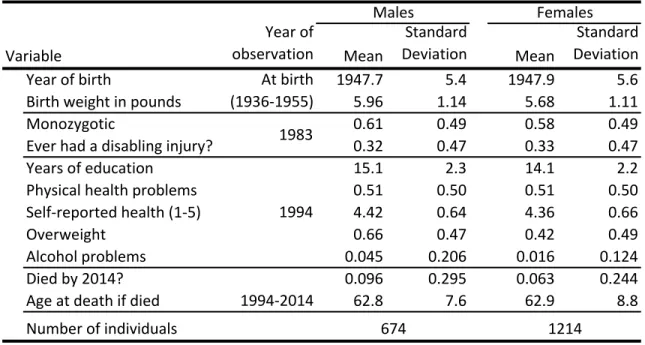
Specifically, we consider mortality outcomes (death within 20 years after the 1994 SST survey), any report of physical health problems in the SST, and general health as self-reported in the SST. In light of the consistent evidence in the literature that the effects of education on health, life expectancy, and a number of health behaviors are not deleterious,7 we use one-sided tests for the estimated coefficients on years of schooling in our regressions.8 Second stage results for the estimated values of β1 are presented in table 1.4. The estimate for men shows that each additional year of schooling yields a 3.1 percentage point decrease in the probability of death over the 20 years immediately following the 1994 SST survey.
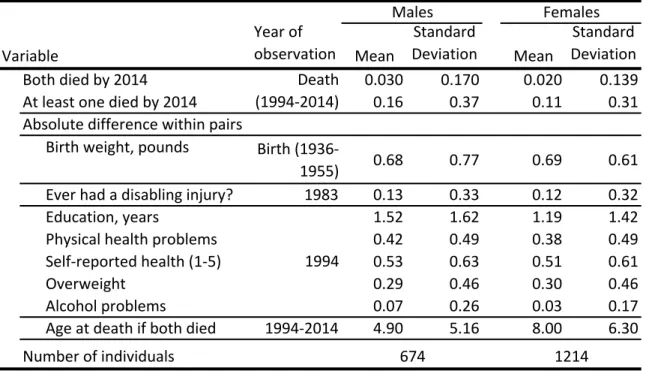
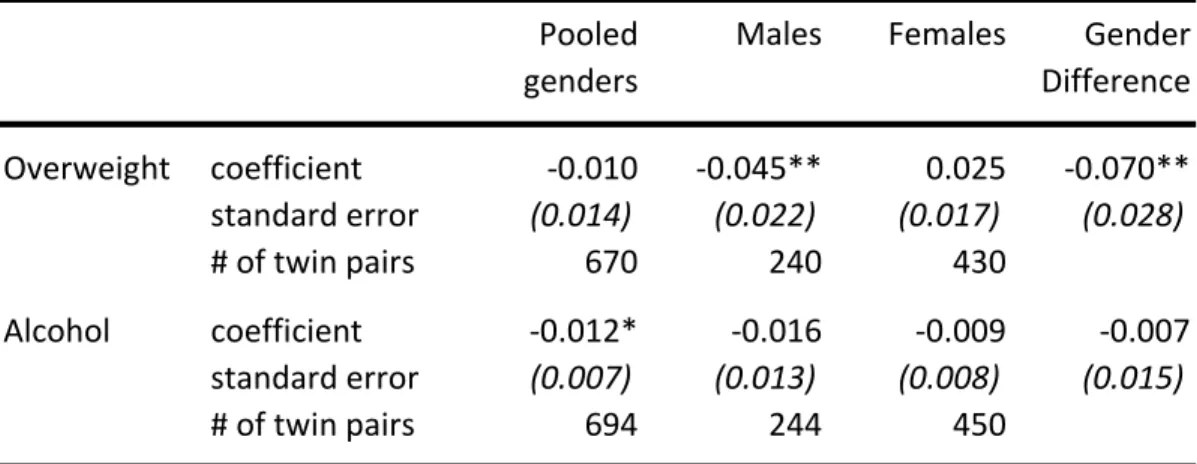
Among the sample of all MZ twins, each additional year of schooling is associated with improvements of 3 percentage points in the probability of reported health problems and 0.03 standard deviations in self-reported general health (both as reported. We find evidence statistically significant improvement in mortality due to additional years of schooling among male twins only in the older cohort and in the later ten-year mortality window (between ages 59 and 78) We have limited data on potential mediators that drive the effects of education on health outcomes, but alcohol problems and obesity are two key health-related factors that were queried in the 1994 SST.
For men, each additional year of education brings a statistically significant decrease in the probability of being overweight by 4.5 percentage points. Because of the lack of consensus in the health economics literature regarding the relationship between education and alcohol use, we use a two-tailed test of statistical significance for coefficient estimates for alcohol problems. There is little change in the implicit effect of education on self-reported health, and the effect on physical health problems is modestly reduced.
A number of policy responses have been deployed in an effort to address the devastating opioid epidemic in the US.
ARCOS
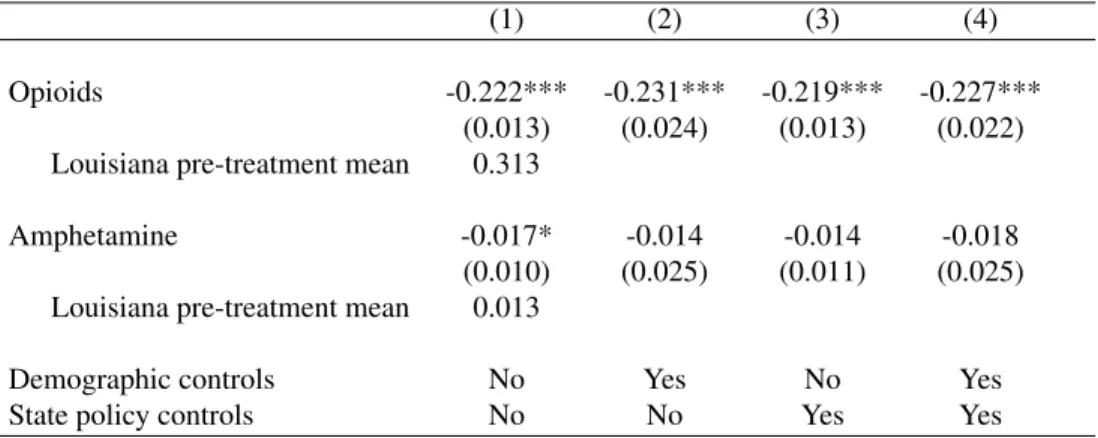
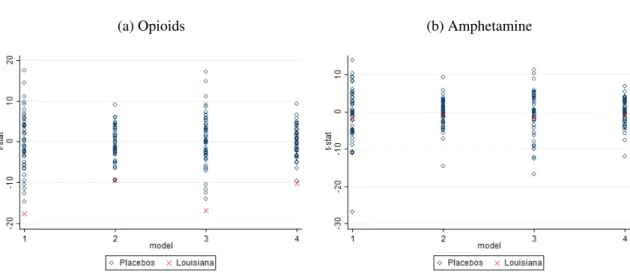
Consequently, each state's market for opioids may be affected both by opioid-specific regulations, such as UDT requirements, and any changes in the market for Schedule II drugs in general. One of the most commonly prescribed non-opioid Schedule II drugs is amphetamine, which is included in Adderall and other drugs used to treat attention deficit hyperactivity disorder. Although abuse of legal amphetamine medications occurs (Maxwell and Rutkowski, 2007), amphetamines are not used to treat the same conditions as opioids, nor would it satisfy an opioid addict's drug addiction.
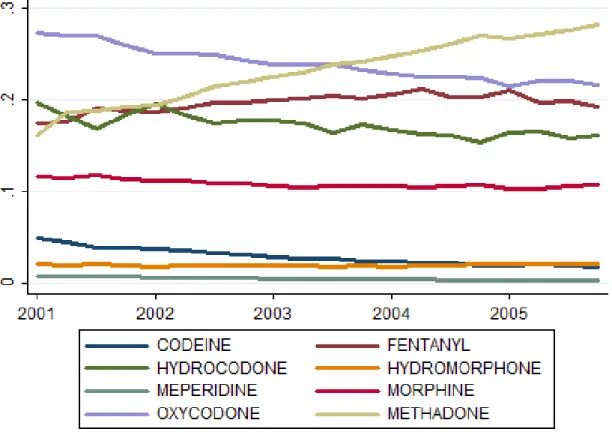
Because of this fact and amphetamine's Schedule II status, we compare total opioid amounts to total amphetamine amounts to assess the outcomes of opioid policies while tracking concurrent changes in the supply of highly regulated drugs in each state overall. In particular, we consider the amounts distributed for nine commonly prescribed opioid analgesics: buprenorphine, codeine, fentanyl, hydrocodone, hydromorphone, meperidine, methadone, morphine, and oxycodone. Because the pharmacological strength per milligram varies by opioid type, we convert the dispensed amount of each drug in grams to a morphine-equivalent amount using multipliers that have been established in the medical literature (Gammaitoni et al., 2003; Paulozzi et al. al., 2011) and sum all opioid types to create a total amount.
In addition to these opioids, we also consider reported amounts of the non-opioid drug amphetamine, which is similarly tracked by the ARCOS database. Although ARCOS data is available dating back to 2000, ARCOS reports did not begin to include medications distributed to substance abuse treatment facilities until 2006. This results in a large increase in methadone amounts recorded from 2006 onwards, as methadone is an opioid commonly used in the treatment of opioid use disorder.
To examine trends in distribution before the reporting change, we show in Figure 2.1 the share of each opioid in the total morphine equivalent quantity of opioids tracked between 2001 and 2005. Methadone's share in the morphine equivalent quantity among retailers other than addiction treatment centers almost doubles. throughout the United States during this period. This indicates that methadone was increasingly used during this period for reasons other than substance abuse treatment.
Buprenorphine is another opioid commonly used in the treatment of opioid use disorder; it was generally absent from ARCOS reports prior to 2006 and is included thereafter. A limitation of the ARCOS data set is the fact that it only detects legally distributed amounts of drugs. If suppressing the abuse of prescription opioids should cause an increase in rates of abuse of heroin or illicitly produced opioids, as indicated by previous research of another supply-side intervention in the market for opioids (Alpert et al., 2018), then ARCOS will not enable us to observe this particular change in the drug market.
NVSS
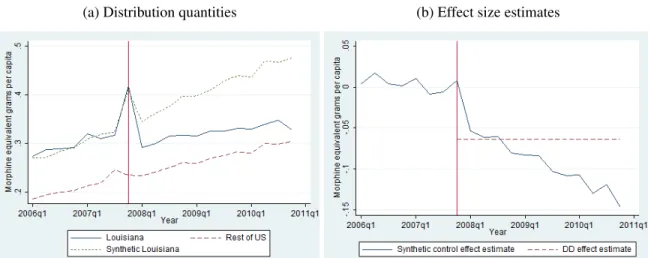
There is no such mechanism in the synthetic control framework to distinguish the effects of other government policies besides UDT. Although opioid prevalence rates were higher in Louisiana than in the rest of the US, the two trends are very similar in the pre-treatment period. The ARCOS data show a sharp upward trend in the last quarter of 2007 for a number of drug types and in many states.
These graphs, shown in Figure 2.7, seem to support the assumption of parallel trends, as the pattern of opioid deaths in Louisiana before 2008 did not differ from that in the rest of the country. The outcome measured in the last row is the overall all-cause mortality rate. We next conduct synthetic control estimation of the effect of Louisiana's UDT policy on opioid deaths.
Finally, we repeat the DD analysis to examine changes in the percentage of deaths from each drug-related cause. We find no evidence of a significant change in the percentage of deaths related to illicit drugs. Prescription opioid pain medications are effective therapies, and the use of prescription opioid medications has increased dramatically in the United States.
For example, suppression of the manufacture of illicit methamphetamine has led to reductions in the number of foster care cases and in rates of child neglect and abuse (Cunningham and Finlay, 2013). The Administration for Children and Families (ACF) administers the Adoption and Foster Care Analysis and Reporting System (AFCARS), which provides case-level data on each child in the foster care system. We construct a foster care entry rate for each state, where the numerator is the total number of entries in a state during a particular quarter and the denominator is the number of children in the state.
In state-level analyses, age-adjusted death rates are taken into account, while in county-level analyzes crude drug-related death rates are taken into account. The supply of legal opioids in a given area can fluctuate for a number of reasons, including changes in the level of access to health care in general. To distinguish between changes in the prevalence of pharmaceutical opioids and changes in access to health care in general, we control for annual observations of the number of care physicians per capita in each state and the number of community mental health centers per capita.
Tables 3.4 and 3.5 show that the increase in the rate of adverse outcomes for opioid users is alarming. We have shown that increased distribution of licensed opioids is associated with reduced adverse event rates in children. Supply-side drug policy in the presence of substitutes: Evidence from the introduction of abuse-deterrent opioids.
Recent changes in drug poisoning mortality in the United States by urban-rural status and by drug type.