Title: Basics of Epidemiology in Public Health / Ann Aschengrau, ScD, professor of epidemiology, Boston University School of Public Health, George R. Chan School of Public Health and director of the Harvard Chan Program in the Epidemiology of Infectious Diseases.
Acknowledgments
The Approach and Evolution of Epidemiology
LEARNING OBJECTIVES
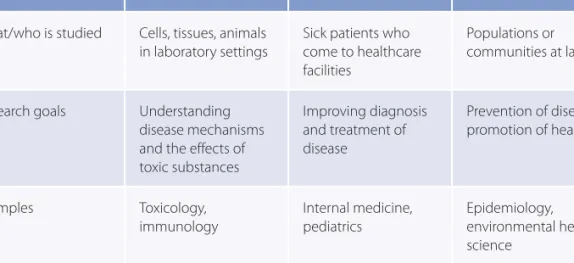
Nevertheless, public health has a greater impact on population health than medicine. Public health scientists study ways to prevent disease and promote general population health.
Population
We define epidemiology as follows: The study of the distribution and determinants of disease frequency in human populations and the application of this study to control health problems.13(p1),14(p95) Our definition is a combination of a popular one created by MacMahon and Pugh in 1970 and another described by Porta in the sixth edition of A Dictionary of Epidemiology.14(p95),15(p1) Note that the term disease refers to a wide variety of health-related conditions and events, including diseases , injuries, disabilities and death. We prefer this hybrid definition because it describes both the scope and ultimate goal of epidemiology.
Disease Frequency
For example, the National Health Interview Survey is a federally funded survey that collects data on the health status of the US. Its purpose is to "monitor the health of the United States population" by collecting information on a wide range of topics. including health indicators, health care utilization and access, and health-related behaviors. 16.
Disease Distribution
For example, a case definition for breast cancer may include findings of a palpable lump during physical examination as well as mammographic and pathologic evidence of malignancy. Currently available sources for identifying and counting disease cases include lists of hospital patients; death certificates; specific reporting systems such as cancer and birth defect registries; and special research.
Disease Determinants
The purpose of a study is to gather valid and precise information about the determinants of disease in a specific population. Epidemiological research includes several types of study designs; each type of study simply represents a different way of gathering the information.
Disease Control
A hypothesis is defined as "a tentative explanation for an observation, phenomenon, or scientific problem that can be tested by further investigation."10 (p866) Hypothesis generation is a process that involves creativity and imagination and usually involves observations about frequency. and the distribution of disease in a population.
John Graunt
Although families in 17th-century London had to pay four shillings for Bills of Mortality, these U.S. noted For example, that it was often difficult for the "mother mother" searchers to determine the exact cause of death.
James Lind
The other was the best recovered by anyone in his condition; and was now considered to be quite well, appointed nurse to the rest of the sick."24(p146) Lind concluded: "I will only remark here that the result of all my experiments was that oranges and lemons were the most effective remedies for this distemper at sea. I am inclined to think that oranges are preferable to lemons, though both given together will perhaps be most useful.”24(p148).
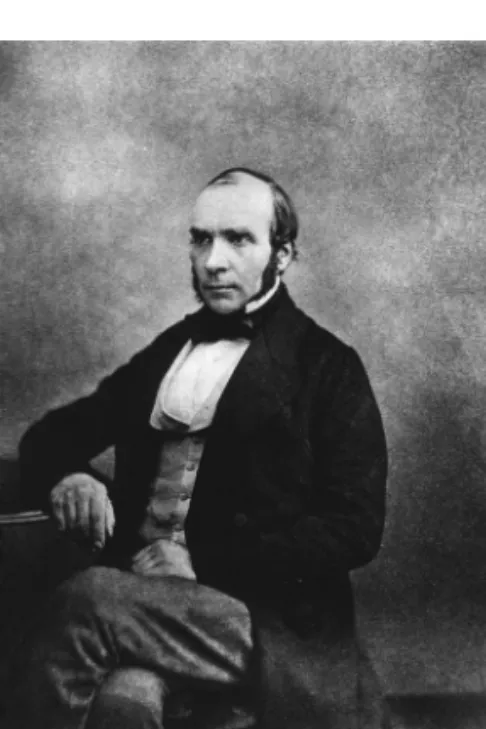
William Farr
The system he devised is the forerunner of the modern International Classification of Diseases, which categorizes diseases and. Third, Farr made a number of important contributions to the analysis of data, including the invention of the "standardized death rate", an adjustment method to make fair comparisons between groups with different age structures.
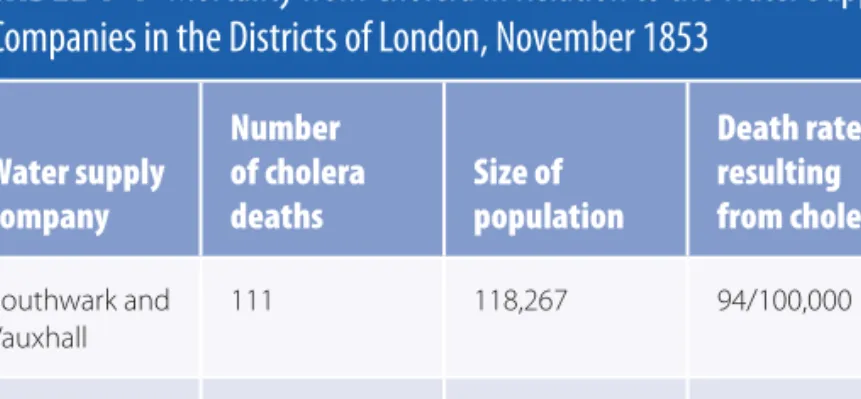
John Snow
During August and September of 1854, one of the worst outbreaks of cholera occurred in the London neighborhood around Broad Street. Districts with a mixture of clean and polluted drinking water (Southwark and Vauxhall Company and Lambeth Company together) have 35% fewer cholera deaths (61 versus 94 deaths per 100,000) than districts with only polluted drinking water (Southwark and Vauxhall Company alone) .

Modern Experimental Studies
Streptomycin Tuberculosis Trial
Researchers observed radiographic evidence of significant pulmonary improvement in 51% of streptomycin patients and only 8%. Masking means that the investigators who reviewed the radiographs were unaware of the person's treatment assignment, and so the chances of them making a biased judgment were reduced.
Doll and Hill’s Studies on Smoking and Lung Cancer
Doll and Hill found that proportionally more lung cancer patients than non-cancer patients were smokers.32 In particular, 99.7% of male lung cancer patients and 95.8% of male non-cancer patients smoked;. For example, 26.0% of male lung cancer patients and 13.5% of male non-cancer patients reported smoking 25 or more cigarettes per day before disease onset.
The Framingham Study
A long follow-up period is especially important when studying a disease such as cancer that develops over decades. An editorial on epidemiology in the 21st century noted that, like public health achievements of the past, solutions to these problems will emerge from “the complementary contributions of different aspects of epidemiology: calculating disease trends and probabilities, communicating findings to the public and policymakers, and planning and implementation of data-based interventions.”50 (p. 1154) The editors further noted,.
Summary
The full value of epidemiology is only achieved when its contributions are placed in the context of public health measures, resulting in a healthier population. Like past achievements in public health, we will find solutions to these problems by placing the contributions of epidemiology in the context of public health action.
In recent years, the field of epidemiology has greatly expanded in size, scope, and impact, and epidemiologists currently investigate a wide range of important public health problems. Experiences of racism and incidence of asthma in adults in the Black Women's Health Study.
Chapter Questions
What public health achievements have accounted for improved life expectancy in the United States over the past century.
Measures of Disease Frequency
For example, people who live along the 2,350-mile length of the Mississippi River, around Mount St. Revision of the acquired immunodeficiency syndrome case definition for national reporting—United States.
Incidence
Cumulative Incidence
Note that the cumulative incidence of deaths during the first 16 months after the bombing was close to that during the 53-year follow-up period of the Life Cohort Study (58%). A final critical assumption underlying the cumulative incidence measure is that everyone in the candidate population has been followed for the specified time period.
Incidence Rate
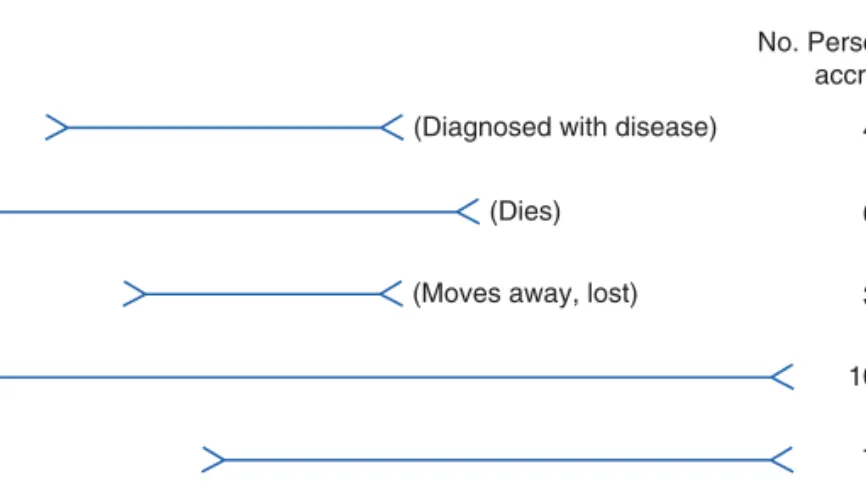
Person B lived in the city at the beginning of the observed period in 2006, died in 2012 and therefore accumulated 6 person-years. Person C was considered lost to follow-up from the time she migrated and thus received 3 person-years.
Relationship Between Cumulative Incidence and Incidence Rate
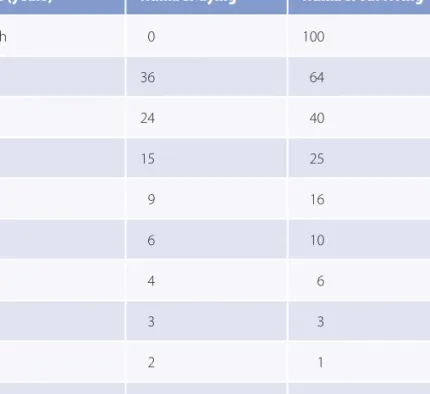
In the hypothetical example portrayed in Figures 2-4, five individuals followed for varying lengths of time achieved 30 person-years of follow-up. For example, person-years are commonly used for diseases that take many years to develop (such as cancer), and person-months or person-days are used for diseases that develop quickly (such as infection).
Incidence Summary
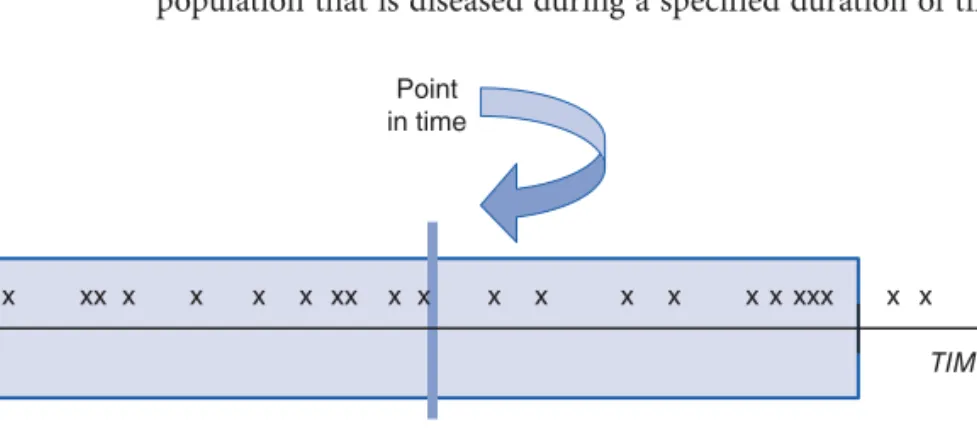
Prevalence
Period prevalence includes the number of cases present at any time during the year. Number in the Total Population Over a Period of Time Let's use these formulas to calculate the point and period prevalence of pneumonia in a nursing home population.
Relationship Between Prevalence and Incidence
In the period from January 1 to December 31, 2017, there were 45 cases of pneumonia among 500 residents of homes for the elderly; therefore, the prevalence of menstruation during the year was 45/500 or 9%. Note that in this case, nursing home population size remained stable during the year, but if it had gained or lost members, the average nursing home population size in 2017 would have been an appropriate denominator for the pre-alence period.
Uses of Incidence and Prevalence
Attack rate: Number of new cases of disease that develop (usually during a defined and short period) according to the number in a healthy population at risk at the beginning of the period. How does each of the following conditions affect the prevalence of a disease in a population?
Comparing Disease Frequencies
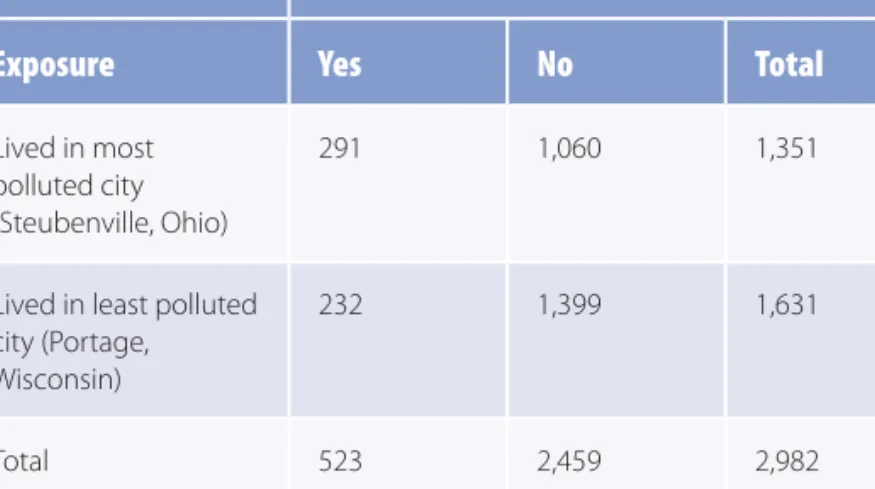
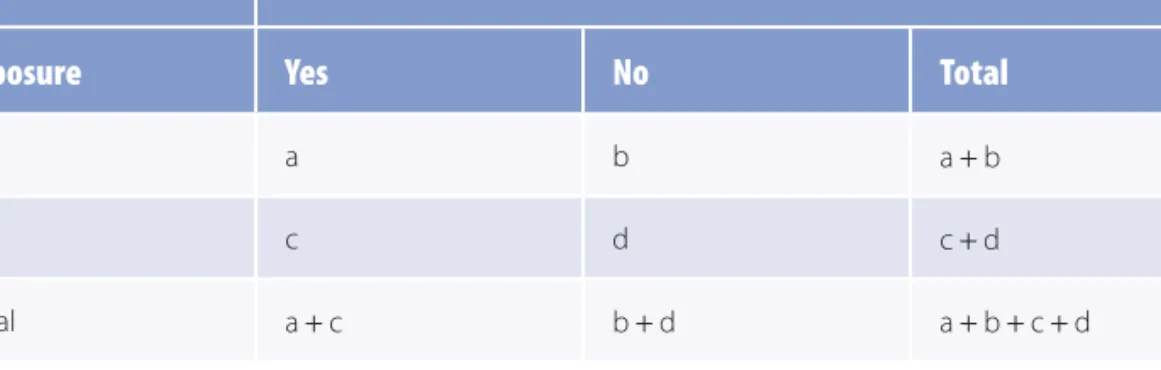
This two-by-two table describes the cumulative incidence of mortality for the cities with the highest and lowest levels of pollution—Steubenville, Ohio, and Portage, Wisconsin, respectively. The two-by-two table is slightly modified when comparing incidence rates (see TABLE 3-3).
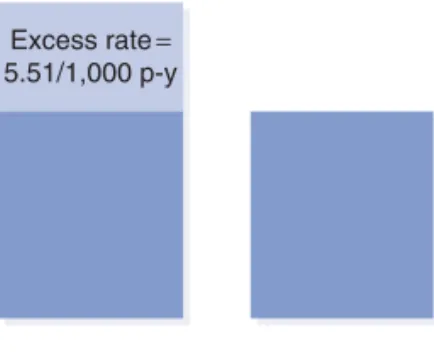
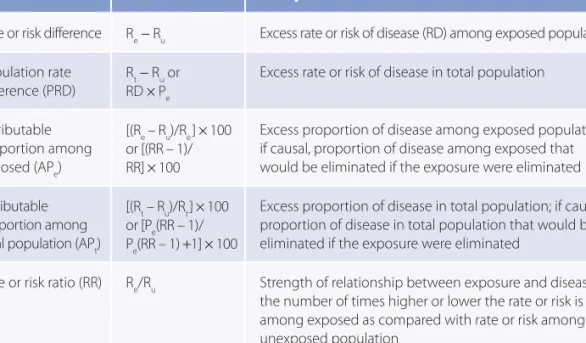
Absolute Measures of Comparison
The disease rate in the total population (Rt) or the proportion exposed (Pe) can be obtained from either the study population or the general population. Or, more generally, if one believes that there is a causal relationship between the exposure and the disease, the PRD identifies the number of disease cases that would be eliminated in the total population if the exposure were eliminated (or reduced to the level in the reference group).
Relative Measures of Comparison
First, the maximum value of the relative risk is limited if the baseline risk or disease rate is high. Thus, a side-by-side comparison of the five age-specific mortality rates suggests that the age difference may be responsible for the difference in the crude mortality rate between the two populations.
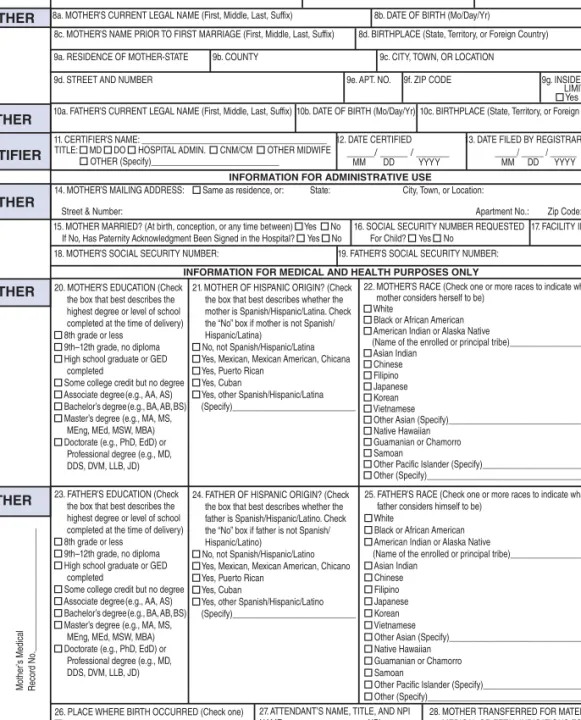
Sources of Public Health Data
Since 1960, NCHS has conducted the National Health and Nutrition Examination Survey (NHANES) to collect information on US health and diet.
Descriptive Epidemiology
The prevalence of lead poisoning in children was highest in certain parts of the city. Migrant studies are one way epidemiologists investigate the effect of place on disease occurrence.
Disease Clusters in Place and Time
However, it is also possible that temporary changes in morbidity and mortality rates are the result of parallel fluctuations in diagnostic capabilities, disease definition or reporting methods, the accuracy of enumeration of the denominator population or age distribution of the population. More recently, a cluster of leukemia cases occurred in Woburn, Massachusetts, over an 11-year period.35 It was discovered that two of the eight wells supplying drinking water to the town were contaminated with various chlorinated organic chemicals.
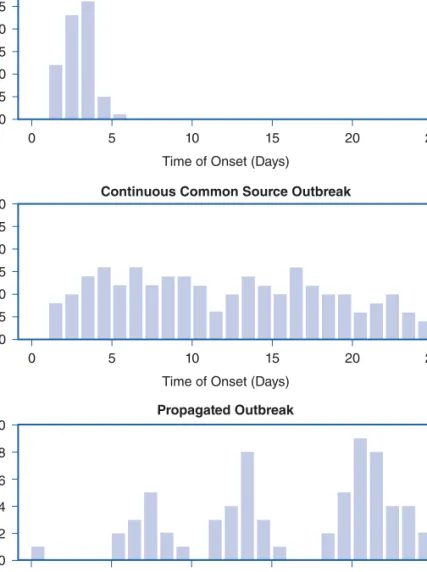
Outbreaks and Epidemics
In August 1976, one of the first cases was transferred to Maridi District Hospital. It was clear to the community that the hospital was the main source of the outbreak.48.
Demographic Characteristics of the U.S. Population
The plan uses "leading health indicators" to illustrate individual behaviors, physical and social environmental factors, and health system issues that significantly affect the health of individuals and communities. To illustrate the main elements and uses of descriptive epidemiology, this section describes the pattern of deaths in the United States by age.
Size
The plan has four main goals: to increase the quality and years of healthy life, eliminate health inequalities, create healthy environments and promote healthy living.67 These goals are supported by specific targets in 42 focus areas, including access in quality health services; cancer; diabetes; environmental health; family planning; health communication; HIV;
Gender Ratio
Age Structure
Race
Natality
Life Expectancy
According to the WHO, the United States ranked 34th in life expectancy at birth for men and 33rd for women in 2015. However, chronic respiratory disease has been replaced by unintentional injuries for white and black men and cerebrovascular disease for black women as the third-leading cause of death .
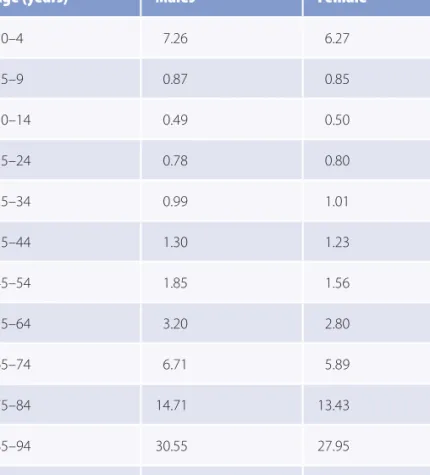
Mortality Rates by Age
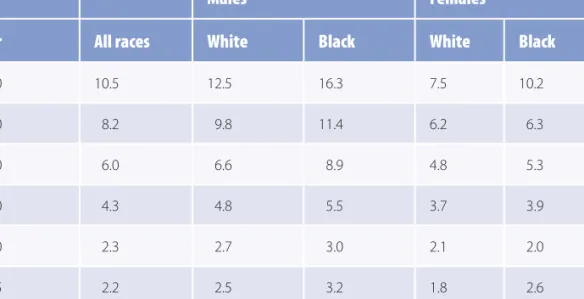
The leading sites for cancer deaths were lung, prostate, and colorectal in men and lung, breast, and colorectal in women (see TABLES 5-6).6 Other important causes of death for both men and women were Alzheimer's disease, diabetes, infectious diseases (including pneumonia and influenza), and kidney disease.5(p107). Because age is such an important determinant of death, the rest of this section describes important rates and causes of death for each age group.
Infants (Less than 1 Year of Age)
Children (1 to 14 Years of Age)
Although deaths from motor vehicle crashes have declined over time, they have generally been higher among men than women and higher among blacks than whites. Although this disparity has been decreasing over time, there was an increase in motor vehicle crash deaths among black children between 2010 and 2015, while death rates for white children continued to decline (see TABLE 5-7).
Adolescents and Young Adults (15 to 24 Years of Age)
Black females had higher rates than white females (7.5 vs. 1.9, respectively, per 100,000), but the homicide rate for females has always been much lower than that of males.5 (pp. 161- 164).
Adults (25 to 64 Years of Age)
Elderly Adults (65 Years of Age and Older)
Strengths and Limitations of Mortality Data
Many cause-specific death rates—particularly those from traffic accidents and homicide—are higher among blacks than whites. Death rates from many specific causes—particularly those from heart disease and lung cancer—are higher among men than among women.
Background and Descriptive Epidemiology of Childhood Lead Poisoning
The remainder of this chapter focuses on three major causes of morbidity in the United States: childhood lead poisoning, HIV/AIDS, and breast cancer.
Person
Place
In 2014, of 30 states (plus the District of Columbia and New York City) that reported data to the CDC, Pennsylvania, Illinois, and Ohio underreported the highest number of newly identified cases of blood lead levels ≥ 10 µg/dL among children. than 5 years old.80.
Time
Discussion
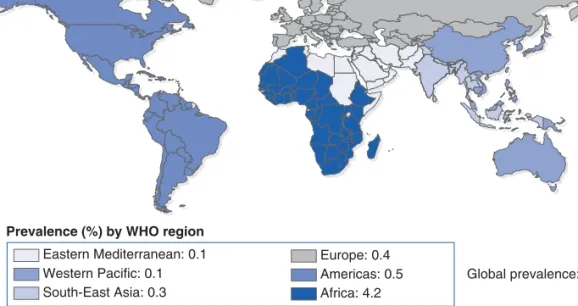
Background and Descriptive Epidemiology of HIV/AIDS
Data on the incidence of HIV/AIDS in the United States comes from the Division of HIV/AIDS Prevention, National Center for HIV/AIDS, Viral Hepatitis, STD, and TB Prevention at the CDC.
Incidence and Mortality
Across all racial and ethnic groups, blacks continue to be disproportionately affected by HIV in the United States. Gay, bisexual, and other MSM are the group most affected by HIV in the United States.
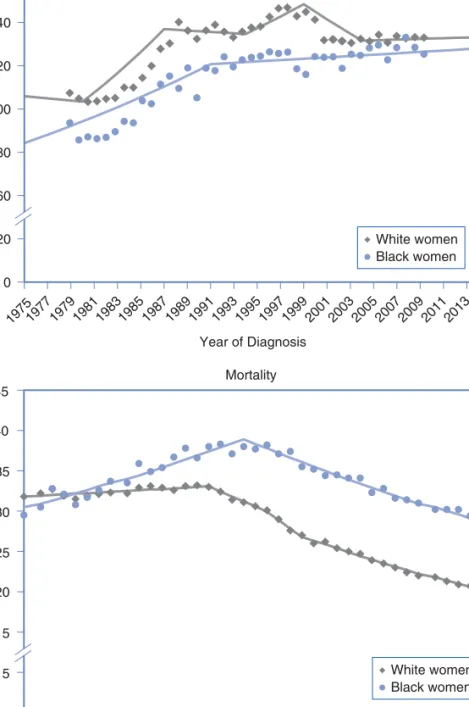
Background and Descriptive Epidemiology of Breast Cancer Among Women
Breast cancer incidence rate in Japanese women in Japan and the United States relative to cancer incidence in five continents. Tamoxifen for the prevention of breast cancer: report of the P-1 study of the National Breast and Bowel Surgical Adjuvant Project.
Overview of Epidemiological Study Designs
The purpose of the control group is to provide information about the exposure distribution in the population that gave rise to the cases. This chapter provides (1) an overview of epidemiological research designs—experimental, cohort, case-control, case-crossover, ecological, and agent-based modeling—and (2) a description of the settings in which the three main study designs—experimental, cohort, and case control-.
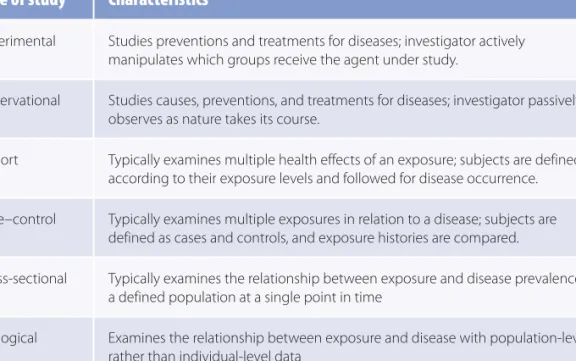
Definitions and Classification
Selection of Study Population
Consent Process and Treatment Assignment
Treatment Administration
The purpose of the placebo is to match as closely as possible the experience of the comparison group to that of the treatment group. Placebos allow study participants and investigators to be masked or unaware of the participant's treatment assignment.
Maintenance and Assessment of Compliance
The principle behind the use of placebo goes back to laboratory animal experiments, where all important aspects of the experimental conditions, apart from the test chemical, are identical for all groups. Masking of subjects and investigators helps prevent biased outcome ascertainment, particularly when endpoints involve subjective assessments.
Ascertaining the Outcomes
High and comparable follow-up rates are necessary to ensure the quality of the outcome data. Follow-up is negatively affected when participants withdraw from the study (these people are called dropouts) or cannot be located or contacted by the investigator (these people are called lost to follow-up).
Analysis
Definitions
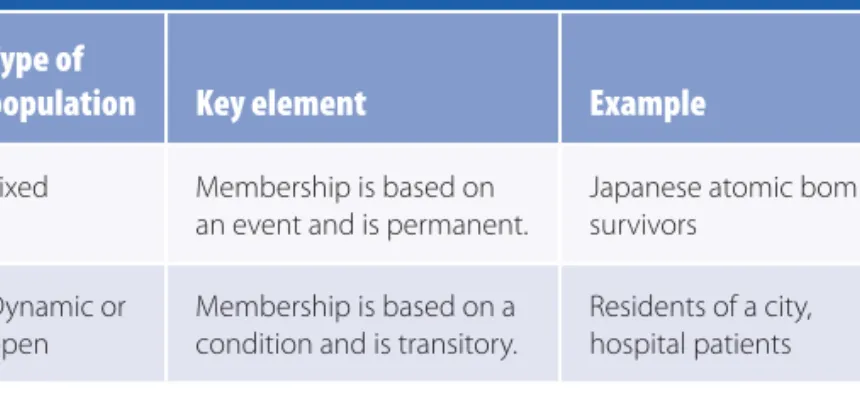
The term closed cohort is used to describe a fixed cohort without loss to follow-up. In contrast, a cohort study conducted in an open population, also known as a dynamic population, is defined by exposures that may change over time, such as cigarette smoking.
Timing of Cohort Studies
Selection of the Exposed Population
Selection of Comparison Group
Sources of Information
Interviews and self-administered questionnaires are particularly useful for obtaining information on lifestyle characteristics (such as the use of cigarettes or alcohol), which are not consistently found in records. Whatever the source of information, it is important to use comparable procedures for obtaining information about the exposed and unexposed groups.
Approaches to Follow-Up
The incidence of the outcome is usually measured using cumulative incidence or incidence rates, and the relationship between the exposure and outcome is quantified using absolute or relative difference between the risks or rates. Thus, the central feature of the traditional view is the comparison of the exposure histories of the cases and controls.
Selection of Cases
Its purpose is to provide information on the distribution of exposure in the population that produced the cases, so that rates of disease in exposed and unexposed groups can be compared. Studies using prevalent cases must be interpreted with caution because it is impossible to determine whether exposure is related to disease onset, disease duration, or a combination of the two.
Selection of Controls
In addition, because they come from the same source population, they will have characteristics comparable to the cases. Finally, their recall of past exposures will be similar to the cases' recall because they are also ill.
Sources of Exposure Information
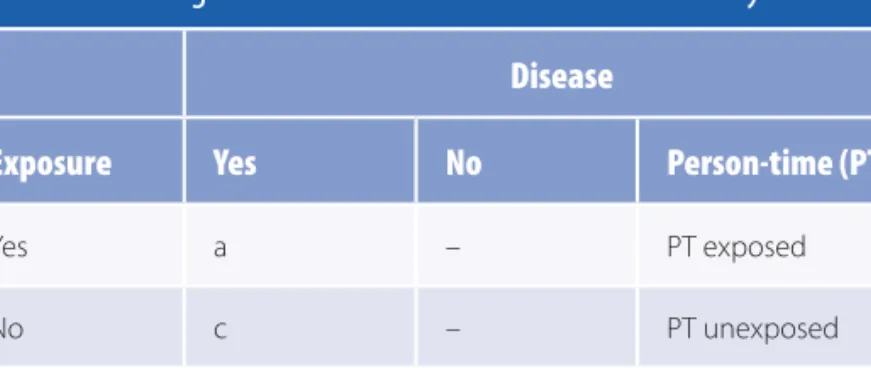
In case-base or case-cohort sampling, investigators select controls from the population at risk at the beginning of the case diagnosis and accrual period. In a case-control study, epidemiologists typically calculate the odds of being a case among the exposed (a/b) compared to the odds of being a case among the non-exposed (c/d).
Case–Crossover Study
However, it is possible to calculate the attributable proportion among those exposed and the attributable proportion in the total population using the odds ratio and the proportion of exposed controls. Equilibrium is a "state of mind characterized by legitimate uncertainty or indecision about a choice or course of action."6(p.88) In other words, there must be genuine belief that a treatment may be of value to t 'administered to some individuals and real reserves. about treatment to keep it from others.
Observational Studies
Case-control studies are preferable when little is known about the etiology of a disease because they can provide information about a large number of possible risk factors. For example, retrospective cohort studies are more efficient than prospective studies for studying diseases with long induction and latent periods.
Cross-Sectional Studies
Yet another bias can occur when conducting cross-sectional studies in occupational settings. This is especially true of the cross-sectional surveys conducted by the National Center for Health Statistics.
Ecological Studies
They obtained information about the implementation of the needle exchange programs from published reports and experts. Investigators examined the prevalence of birth defects in relation to the proportion of the population served by chlorinated water.
Agent-Based Modeling
A study started in 2010 of the relationship between exposure to breast radiation and subsequent risk of breast cancer. The active manipulation of the treatment by the investigator is the characteristic that distinguishes experimental from observational studies (see FIGURE 7-1).
Individual Versus Community Trials
The investigators collected information on the rates of HIV testing in the intervention and comparison communities before and after the intervention to determine if there were any changes. After the intervention was carried out for one year, HIV testing increased by 27.3% in the intervention communities and only 3.5% in the comparison communities, suggesting that social media messages are an effective method of promoting HIV testing. to promote among men who have sex with men and transgender persons.
Preventive Versus Therapeutic Trials
Recently, a community trial was conducted to test the hypothesis that social media messaging would increase HIV testing among men who have sex with men and transgender people.6 The study assigned two communities to receive social media messaging. about the importance of HIV. testing and locations of testing services. At baseline, there were no significant differences in HIV testing rates between the two community groups.