Mark Van Boening for giving me countless hours of his time to ensure the successful completion of this project. Fred Caraway also helped me get funding from the Sally McDonnell Barksdale Honors College, for which I am grateful.
Introduction
They find that first-generation students are less likely to be academically engaged and less likely to drop out than non-first-generation students. Eshelman and Rottinghaus (2014) note that first-generation college students often belong to a lower socioeconomic class than non-first-generation college students.
Literature Review
Determinants of College Major
A similar study by Arcidiacono et al. 2011) at Duke University examines major college decisions based on students' perceptions of future earnings and subjective abilities. Eshelman and Rottinghaus (2014) find that high school students' educational and career aspirations are positively correlated with their parents' socioeconomic status.
Issues Affecting First Generation Students
The effects of race, gender, and first-generation status on agency are foregrounded by Davies et al. 9 They find that first-generation African American and Asian students value their parents' input more than their non-first-generation peers.
Methodology
The first version of the survey was designed for EDHE 105, which is the course for first semester freshmen. This version of the survey was administered during class for three different sections of EDHE 305.
Design
The second version of the survey was designed for EDHE 305 students, which is the course for junior level transfers to the University of Mississippi. In total, 75 copies of the survey were prepared for EDHE 305 students and 66 were completed and returned.
Design Limitations
The sampling techniques used in this study were also designed to provide a sample that is approximately representative of the student population. This study seeks to contribute to the literature by targeting a sample likely to be representative of the underlying population.
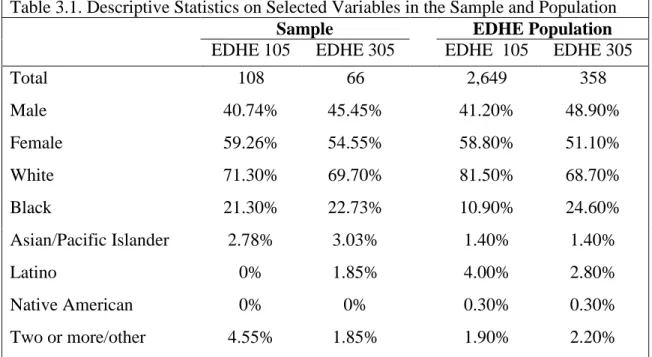
Comparison of Sample and EDHE Population
The original survey was to be distributed online to university student email addresses via Qualtrics survey software. The sample was a stratified random group of 3,750 full-time students organized by academic classification at Oxford. Funding was approved and would be provided by the Sally McDonnell Barksdale Honors College.
At the end of the online survey, the web page was designed to redirect participants to a separate one-question survey designed to collect contact information only. However, the data from this survey would have been useful for modeling college major decisions, especially considering expectations of earnings and other students' earnings. This can provide significant information, especially if the sample size was large enough to contain male and female respondents.
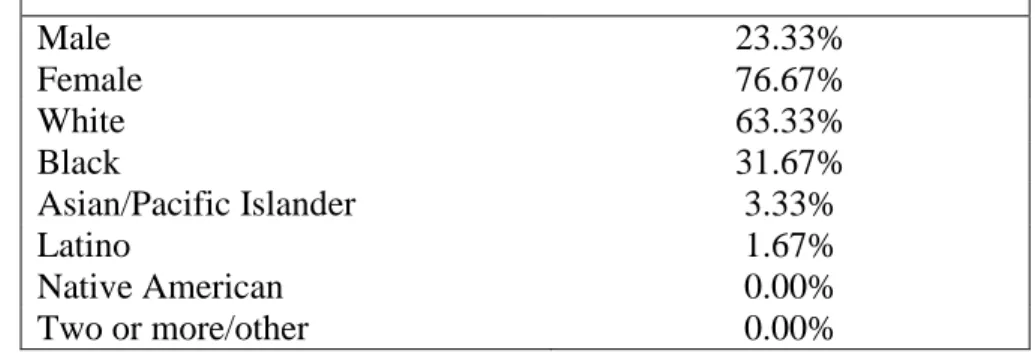
The sample contains a significantly smaller percentage of white students than the population (71.3% vs. 81.5%) and a larger percentage. According to University enrollment data, during the 2014-2015 academic year 77.42% of all students enrolled on the Oxford campus were white, while 13.67% of full-time students enrolled on the Oxford campus were white. colored. 12.
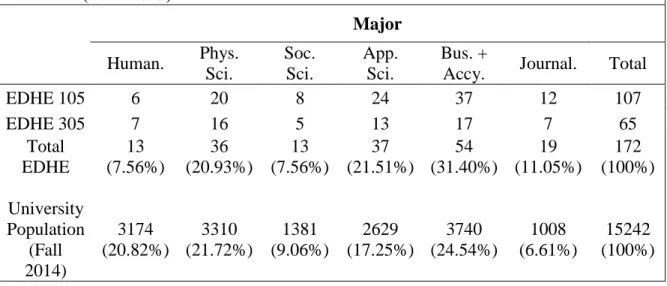
Comparison of EDHE Sample and University Enrollment Data
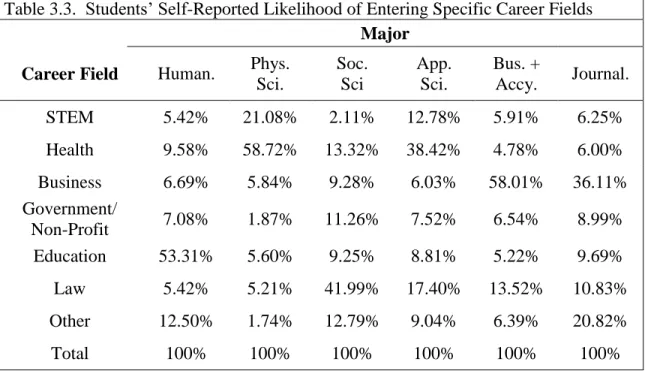
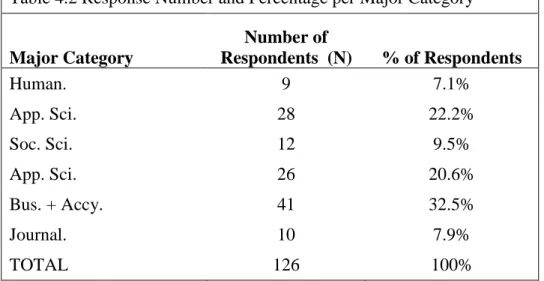
Although some classifications are larger than others, the sample data generally matches the enrollment data. Comparing the information from these tables shows that, like the population data, the EDHE sample favors certain key classifications. Technical Sciences, Business Administration and Accountancy, and Journalism are overrepresented, while Humanities and Social Sciences are underrepresented in the sample.
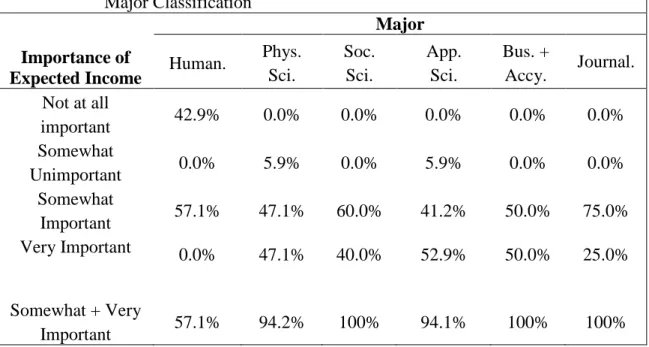
However, the example captures the basic pattern of major choices in the fall 2014 enrollment data. This also does not take into account that the population data is from autumn 2014 and the EDHE data was collected in autumn 2015. For example, approx. 59% of students majoring in the physical sciences intend to work in a health profession after graduation; likewise, 58% of business and accounting students plan to begin a career in business.
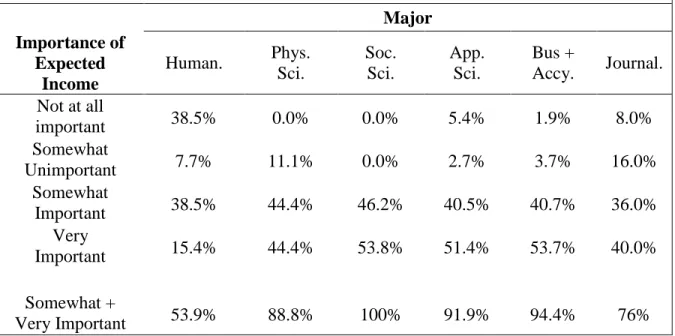
With the exception of majors within the humanities, most students report that the major is "somewhat important" or "very important" in choosing a career.
Differences between the Sample and First Generation Students
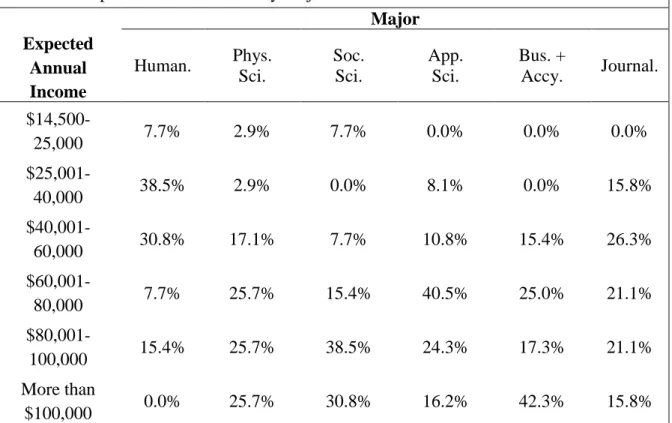
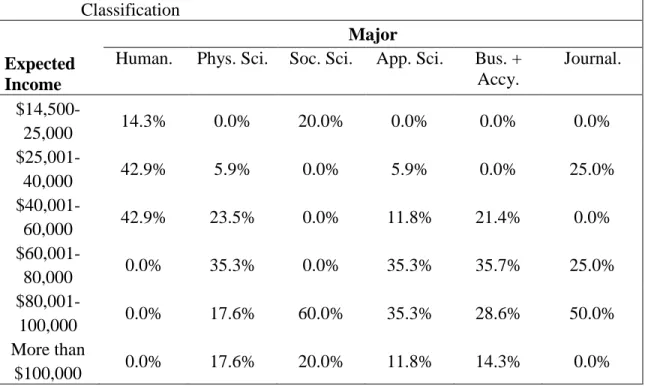
Compared to the expected future annual income of students reported in Table 3.4, in most major categories first-generation students are less likely to expect a future income of more than $100,000. With the exception of the social sciences, the responses of first-generation students tend to gravitate toward middle- and higher-income answer choices compared to their non-first-generation peers. The biggest difference between the groups is within the Business and Accounting category, where 42.3% of all students expect to earn over $100,000 annually, while only 14.3% of first-generation business and accounting majors expect to earn that much annually.
Despite differences in future income expectations, the significance of future expected income between the sample and first-generation students is relatively constant.
Summary of Descriptive Statistics
In particular, first-generation college students, especially those in the social sciences, business, and accounting categories, appear less likely to believe they will earn an income of more than $100,000 than their non-first-generation peers. Therefore, a more rigorous analysis is needed before making further assumptions about first-generation college students' important decisions.
Comments on Procedure and Data Irregularities
Therefore, a more rigorous analysis is needed before making further assumptions about the major decision of first-generation students. number 16 and 17 in the EDHE 305 study.). This was done because the midpoint of both answer choices is the base income for the higher option. The protocol of choosing the higher of two mutually exclusive options was also used when respondents chose more than one level of education for their parents.
For example, if a respondent claimed that his father's highest level of education was a bachelor's degree and a master's degree, only the master's degree response was considered in the analysis. This was done because the wording of the question specifically asked for the highest level of education. However, in this study, all but one economics major indicated that they were enrolled in business school.
In this case, speech pathology is not a major, but is included in the Applied Science category in the form of Communication Sciences and Disorders. In this case, the second major on the student's list was used to determine his or her major. In compiling the data for Table 3 in the methods section, there was one student who was classified under the School of Liberal Arts in the fall 2014 enrollment data even though he or she is a criminal justice major.
Model Specification
Multinomial Regression
The multinomial logit is a variant of the standard logit model where the dependent variable can take on multiple values, where each value represents a categorical response. In this study, values range from 1 to 6, where 1 represents humanities, 2 represents physical sciences, 3 represents social sciences, 4 represents applied sciences, 5 represents business and accounting, and 6 represents journalism. Consequently, the regression-estimated beta coefficients reveal whether there has been an increase or decrease in the relative log odds ratio of each independent variable relative to baseline.
For the purpose of this study, the coefficient indicates whether or not the independent variable is positively or negatively related to the dependent variable (main category) in relation to the base category. More specifically, a positive coefficient means that as the independent variable increases in value, there is (on average) an increase in the probability that the student chooses the given main category (relative to the base category).
Regression Results
Interpretation of multinomial logistic regression results is crucial to understanding the model's results. The important conclusions from this regression are the signs of the estimated beta coefficients and the significance levels of the coefficients. The sign (+/-) of the estimated beta coefficient of an independent variable shows whether this variable is positively or negatively associated with the dependent variable relative to the baseline group.
For example, in Table 4.3 the beta coefficient of ACT for physical sciences (Phys. Sci., 0.202) is positive, meaning that students who majored in physical sciences have higher ACT scores on average than journalism students. This implies that the probability of a physical science major majoring in journalism (baseline) increases with ACT score.
Interpretation of Findings
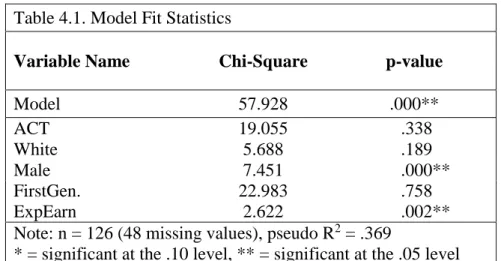
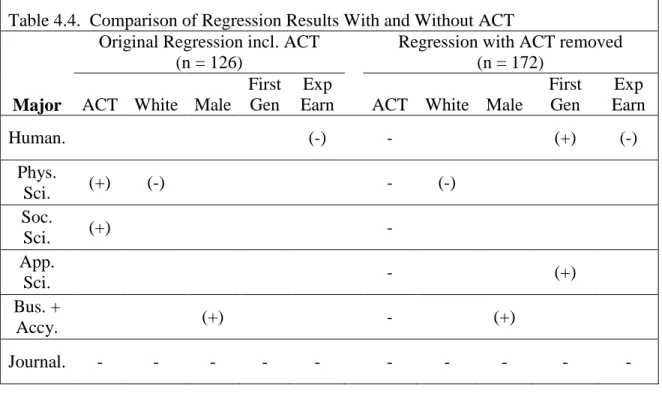
Entries for the statistically significant variables are included and indicate whether the sign is positive (+) or negative (-) within each major category. Contrary to the results from the first regression, FirstGen is now significant for two main categories, humanities and applied sciences. This may be due to correlation between ACT and FirstGen, which is known as multicollinearity.
Multicollinearity is defined as "high (but not perfect) correlation between two or more independent variables."17 In the first regression, multicollinearity is what probably made ethnicity statistically insignificant, and it also had a detrimental effect on first generation status ( although first generation) status remained insignificant after removing ACT from the model).
Limitations and Areas for Future Research
Conclusion
How long do you think it will take you to complete your degree at the University of Mississippi? Did any favorite high school class influence your decision on your current college major. Short Answer: What would you say are the primary influences for your chosen college major(s) and ultimately future career plans.
How long do you think it will take you to complete your studies at the University of Mississippi? Did a favorite class in high school influence your decision for your current major? Did one of your favorite classes at community college influence your decision for your current major?
Free Response: What would you say is the primary influence on your college major(s) and ultimately future career plans. Question 16 Did a favorite class in high school influence your decision about your current major in college. Question 17 Did a favorite class in your FIRST two years of college influence your decision about your current major.
Q18 Did a favorite study from the last two years of your studies influence your decision for your current major? Answer If Do you expect to change your course of study in the coming year?