But before delving into the nuances of the black-white achievement gap in Mississippi, it is important to present more broadly why the American NLYSY79 mothers and children." The article concludes by acknowledging that wealth has a positive effect on achievement, and that wealth explains part of the black-white achievement gap.The "acting white" syndrome has also been presented as one of the possible factors leading to the achievement gap.
The overview of the black-white achievement gap presents a plethora of factors that lead to educational inequality among black and white students. The focus of this dissertation will center on the unique circumstances, causes, and subsequent outcomes of the pervasive black-white achievement gap in Mississippi. Finally, this part of the dissertation will address a smaller part of the United States' educational problems: the black-white achievement gap.
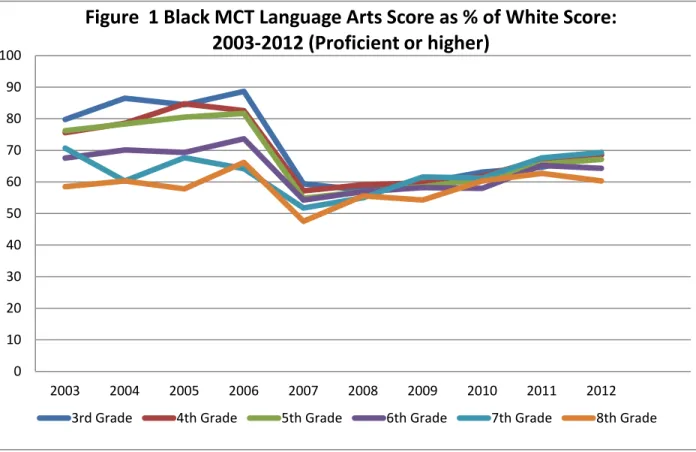
The following is an overview of the gap changes that occur in the next class. These data, collected from 2003 to 2006 on third-grade MCT scores, show an 8.8 percent reduction in the achievement gap. White achievement is also at the second lowest starting point, with only 74 percent of students scoring proficient or higher.
The scores of black students as a percentage of the scores of white students decrease with each subsequent grade.

2003-2012 (Proficient or higher)
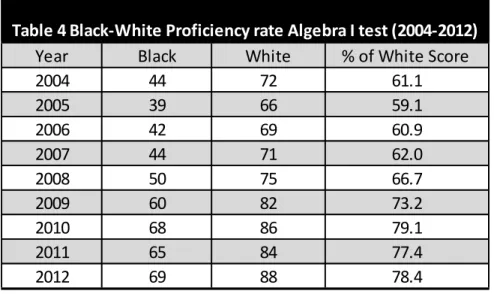
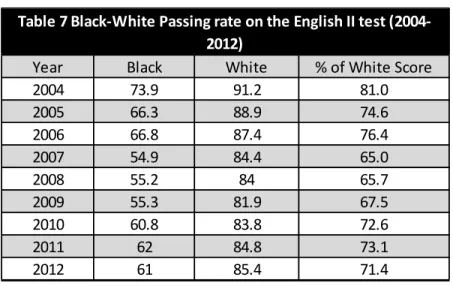
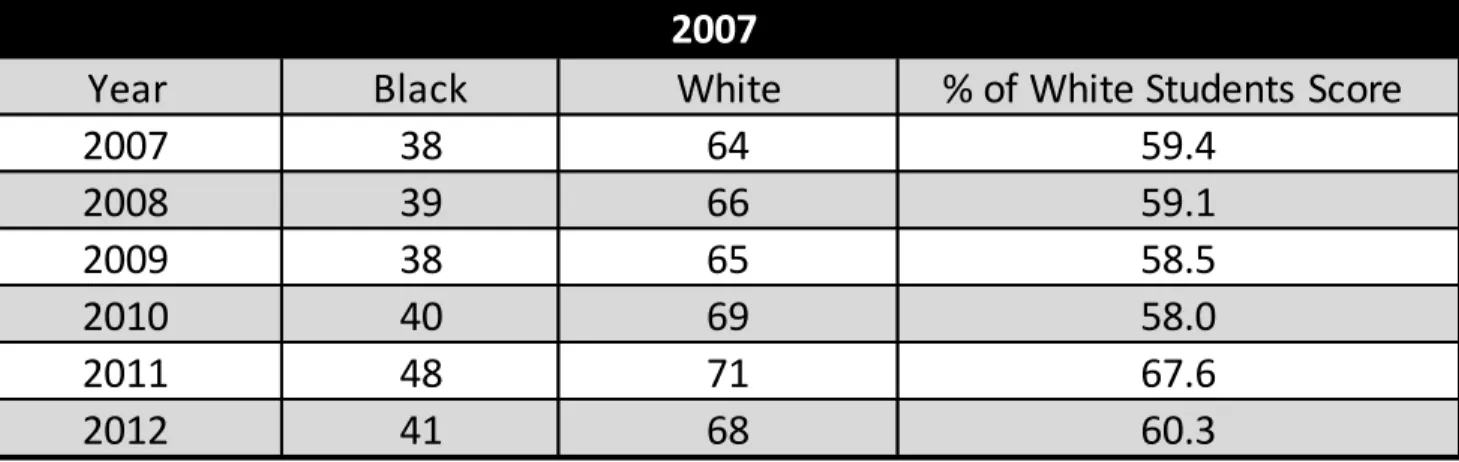
In 2007, only 42 percent of black students scored proficient, while only 68 percent of white students scored proficient. In a single year, the proficiency rate for black students dropped by 31 percent and by 22 percent for white students. 57 percent of black students scored proficient or higher, while 85 percent of white students scored proficient.
Both black and white students declined slightly in 2004 (black students' proficiency dropped 3 percent, while white students' proficiency dropped 2 percent). The 2006 test results show another decline in the proficiency of both black and white students. The proficiency rate of black students increased by 6 percent, while the proficiency rate of white students increased by 4 percent.
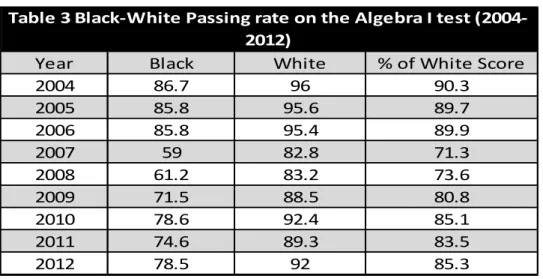
The pass rate on the Algebra I Subject Area exam is relatively high for black and white students. In 2009, achievement and proficiency rates rose moderately for black and white students. Tables 3 and 4 show the performance and proficiency level of Black and White students on the Algebra I subject area test.
However, the performance of white students barely changed (the proficiency rate fell 1 percent to 83 percent and the passing rate remained at 96 percent). The pass rate and proficiency rate for black and white students remained relatively unchanged from 2007 to 2009. In terms of proficiency, 50 percent of black students scored proficient or higher, compared to 76 percent of white students.
The 2006 test shows a slight decrease in the pass rate for black students (down 4.1 percent) and white students'. The proficiency rate dropped 1 percent for black students and to 84 percent (up 9 percent) for white students. In 2004, black students achieved only 40 percent of what white students achieved in terms of proficiency.
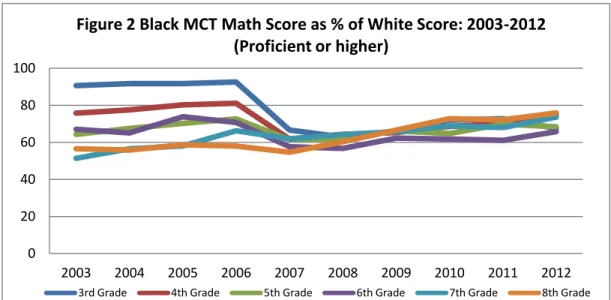
2004-2012 (Proficient or higher)
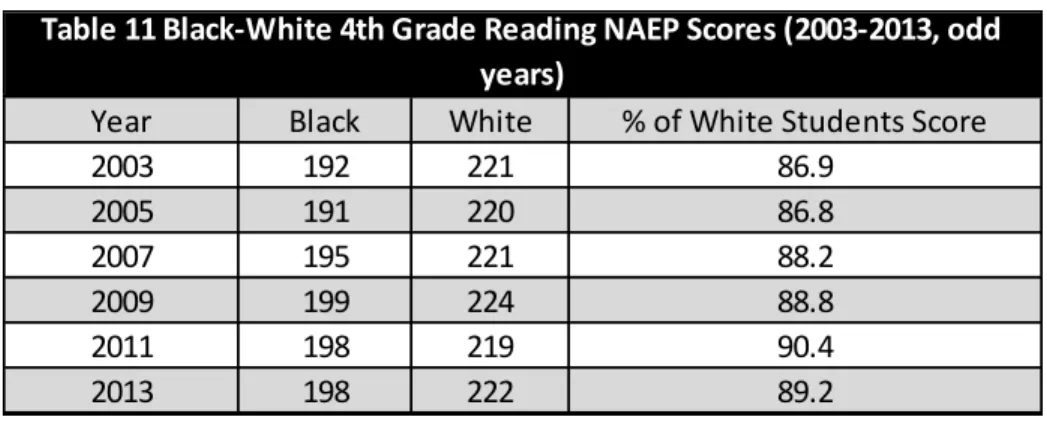
This section of the thesis will focus on NAEP data for grades 4 and 8. Although data from the NAEP are not comparable to those from the MCT, the NAEP data reveal an entirely different story in the test scores of black and white students in Mississippi. For example, 5 out of 6 times Mississippi students were tested by black students, they scored at least 90 percent of what white students scored.
The 8th grade NAEP reading achievement gap is much closer than the 4th grade gap, as I've shown before. Lower test scores alone are not truly indicative. the large impact of the black-white achievement gap on society. However, in relation to this thesis, the report will focus on the racial component of the study.
The findings of the McKinsey report highlight the economic necessity of an achievement gap. This section of the thesis will focus on the monumental progress the KIPP program has made in closing the achievement gap between black and white students. The profound impact of charter schools was discussed in detail in the earlier part of this section of the dissertation.
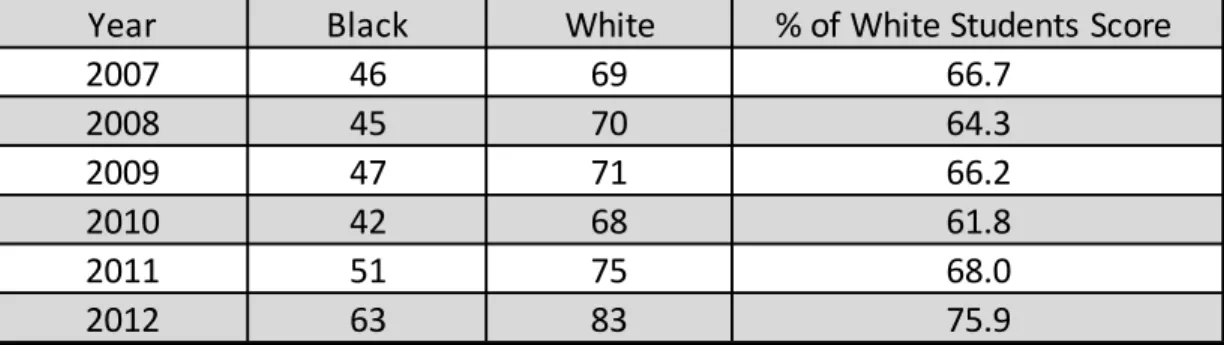
Additionally, the data also showed that the ability gap (in terms of the percentage of white students' scores over black students) between black and white students narrowed by less than one percent from 2007-2012. For example, in 2012 only 41 percent of black students scored proficient or above on the Language Arts exam, which is 23 percent less than white students scored in 2007. The proficiency gap for pertains to the percentage of white scores scored by students of color also closed with 9.2.
The clearest indication of the closing of the black-white proficiency gap can be observed by comparing the scores of black students in 2012 with those of white students in 2007. The proficiency gap in terms of the percentage of white students scored by black students narrowed by 11 percent over six years. The proficiency gap in terms of the percentage of white students' scores that black students score closed at only 1.3 percent in the six.
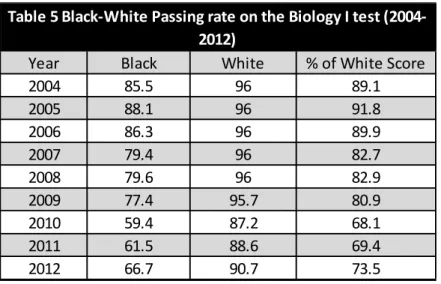
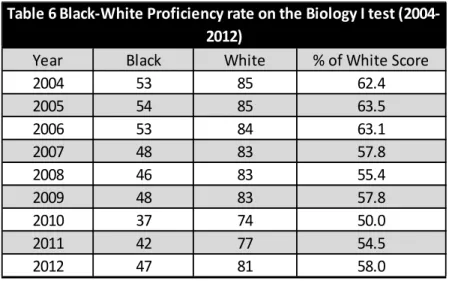
Proficiency rates on the Biology I test between black and white students remained virtually stable between 2007 and 2012. The skills gap, in terms of the percentage of white students that black students scored, narrowed by 16 percent over the six-year period.