1
Eating Disorders Among Ethnic Minorities and International Populations: The Role of Culture and Ethnic Identity in the Development of Eating Disorders
Christy Chung
Department of Psychology, Vanderbilt University PSY 4999-01 Honors Thesis
Dr. David Schlundt Spring 2020
2
Abstract
Given the gravity of recent increasing eating disorder diagnoses, the amount of research dedicated to eating disorders and ethnicity/acculturation is insufficient. This study explores the differences in eating disorder risk factors based on ethnicity/acculturation and the prediction of eating disorder diagnoses based on ethnicity/acculturation. The participant pool was made of 579 females (ages 18-64, U.S. residents, proficient in English) recruited using Sona Systems at Vanderbilt University and Amazon Mechanical Turk (MTurk). A survey was compiled using the online survey manager REDCap consisting of various risk factor scales/tests (Y-BOCS, TQ-R, PROMIS Short form for anxiety, PHQ-8, EDI), an acculturation scale (AHIMSA), and an eating disorder assessment (EDE-Q). Participants were compensated for taking the survey with either 2 academic credits (Sona) or a monetary reward of $2.00 (MTurk). Results showed that while there was no significant difference in risk factors based on ethnicity/acculturation, there was a
difference among risk factors pertaining to body image (shape concern, weight concern, drive for thinness, restraint, body dissatisfaction, eating concern) based on the interaction effect between race/ethnicity and immigration status. These findings highlight the need for further research on eating disorders and demonstrate the nuances through which eating disorder risk
factors/symptoms can manifest, particularly through ethnic and cultural factors.
3
Eating Disorders Among Ethnic Minorities and International Populations: The Role of Culture and Ethnic Identity in the Development of Eating Disorders
Despite having been documented since before the 17th century, the topic of eating disorders is a relatively young area of research that is still incomplete and underestimates the prevalence of eating disorders in the general population (Smink, van Hoeken, & Hans, 2012).
Past research, which laid the foundation for many later studies, focused mainly on non-Hispanic Caucasian adolescent females and failed to consider eating disorder prevalence among other ethnicities, cultural backgrounds, socioeconomic status (SES), and comorbidities (Pike et al, 2001). Only recently have researchers been able to study eating disorders and body image with consideration to different cultural backgrounds and influences to have a more holistic and comprehensive understanding of the topic. This proposal will investigate the difference in risk factors based on ethnicity/acculturation and if knowing one’s ethnicity/acculturation increases the predictability of eating disorder behavior.
Eating Disorder Diagnosis
The most recent version of the Diagnostic and Statistical Manual of Mental Disorders (DSM-5) provides the diagnostic criteria for eating disorders, including anorexia nervosa (AN), bulimia nervosa (BN), and binge-eating disorder (BED) (APA, 2013). Anorexia nervosa is defined as restriction of energy leading to a significantly low body weight, intense fear of gaining weight or of becoming fat, and disturbance in the way in which one’s body is
experienced or perceived. AN subtypes include restricting type and binge-eating/purging type, where the individual has engaged in binge-eating or purging behaviors in the past 3 months.
Bulimia nervosa is defined as having frequent binge-eating episodes, characterized by
“eating in a discrete period of time an amount of food that is definitely larger than what most
4
individuals would eat in a similar period time in a similar event” coupled with a “sense of lack of control over the amount of food eaten,”, recurrent inappropriate compensatory behavior to prevent weight gain, binge-eating/inappropriate compensatory behavior at least once a week for 3 months, and having episodes that do not occur exclusively during anorexia nervosa episodes.
Inappropriate compensatory behaviors include self-induced vomiting, restricting, over-
exercising, and abusing laxatives/diuretics. Unlike individuals with anorexia nervosa, those with bulimia nervosa usually fall within the normal weight to overweight range.
Binge-eating disorder (BED) is characterized by recurrent binge-eating episodes that occurs at least once a week for 3 months, considerable distress following binge-eating episodes, and association with three or more of the following behaviors: eating until uncomfortably full, eating more rapidly than normal, eating large amounts of food when not physically hungry, eating alone because of feeling embarrassed about how much one is eating, and feeling disgusted/guilty afterwards. Those with BED are usually within the normal weight and overweight range but it may also occur within obese individuals and does not involve
inappropriate compensatory/purging behavior. There is relatively less information on BED than the previous two disorders, but there is evidence that compared to BN, BED is more common and more significantly affects a more diverse population (Striegel-Moore& Franko, 2003).
Risk factors
Although each eating disorder has its own unique defining features, there are common risk factors shared by all three. Obsessive-compulsive disorder (OCD) has been found to have a similar age of onset as AN and that individuals with a previous history of eating disorders had an earlier onset of OCD symptoms than individuals with no history (Fahy & Marks, 1993). In addition, victims of childhood/adolescent bullying were found to be at increased risk for
5
symptoms of AN and BN while bullies were found to be at increased risk of symptoms of BN and BED, showing that bullying/being bullied have a significant effect on the likelihood of developing an eating disorder as a child/adolescent (Copeland et al., 2015).
In a 2007 study, anxiety disorders were shown as factors that were significantly more frequent among individuals with eating disorders than those without. Different cognitive avoidance strategies (such as cognitive narrowing and blocking) were shown as mechanisms shared by both anxiety disorders and eating disorders, particularly during binging and vomiting, These mechanisms can increase one’s susceptibility to either disorder (Pallister & Waller, 2007).
A 1998 study showed a similar relationship between depression and eating disorders. Various studies showed the prominence of depressive disorders/symptoms among those with eating disorders, especially BN, and depression as a widely common comorbidity with disordered eating habits (Casper, 1998).
A 1995 study found from a sample of college women who took various standardized eating behavior/attitude tests and perfectionism scales, that the social aspects of perfectionism were associated with eating disorder symptoms and body image and self-esteem (Hewitt et al., 1995). Aspects include socially prescribed perfectionism, defined as the belief that individuals have high standards for themselves and that they are accepted by others in society only if they fulfill these standards (Stoeber, Feat, & Hayward, 2009), and perfectionistic self-presentation, or an individual’s need to appear perfect and how it affects their behavior (McGee et al., 2005).
Because these self-imposed standards are impossible to achieve/maintain, perceived personal failures and inability to meet these standards are common, which may result in inappropriate behaviors such as eating disorders, especially when coupled with body image distortion (Hewitt et al., 1995).
6
Body dissatisfaction and drive for thinness are common mediators in the relationship between eating disorder behaviors/symptoms and perfectionism and is a positive predictor for eating disorder behaviors among women dissatisfied with how they look (McGee et al., 2005). In a 1994 study, it was found that individuals with AN and BN do not necessarily have a singular fixed distorted physical image of how their bodies look, but instead have an unstable/unclear image that is subject to distortions based on the individual (Slade & Brodie, 1994). A 1996 study later defined these distortions to be inaccurate estimations of one’s own body size. More
specifically, researchers found that those suffering from eating disorders tend to overestimate overall body size based on nonsensory factors. In other words, regardless of the claims of individuals with eating disorders about their weight and body size, there is no sensory/physical information backing up these claims (Gardner & Bokenkamp, 1996).
Prevalence
According to a 2018 comprehensive meta-analysis on the prevalence eating disorders among adults in the U.S., the age of onset is stable across all three eating disorders at late teens to early twenties (Udo & Grilo, 2018). Lifetime prevalence was the highest for BED at 0.85%
followed by AN at 0.80% and BN at 0.28%. However, despite having the second highest lifetime prevalence, AN had the lowest year-long prevalence at 0.05%. Those who reported to have impairment in maintaining their normal psychosocial functioning were the most common in lifetime BN/BED groups and significantly higher than AN groups. Those with either lifetime AN or BN had significantly lower BMI scores than did those with lifetime BED (higher risk of obesity). Although this 2018 study is the most recent comprehensive review of eating disorder prevalence, it has limitations in that it omits Asian respondents and does not explain potential reasons for differences in prevalence of eating disorders across different races/ethnicities.
7
Eating Disorders among Ethnic Minorities
The lack of research on eating disorders includes the extreme underrepresentation of ethnic minorities. Early research often used self-reporting or interviewing as ways to measure the prevalence of eating disorders (Striegel-Moore et al., 2003) and often only examined non-
Hispanic Caucasian women. In a 1992 study on the diagnostic criteria for BED, conclusions were made based on a sample of subjects that was majority white (Spitzer et al., 1992). There was not even a reference to the racial/ethnic background of the participants in a 1983 study validating the measures of the Eating Disorder Inventory, which was used as a reference tool by future eating disorder studies (Garner, Olmstead, & Polivy, 1983). However, there are some studies that examined eating disorders among different ethnicities (African-Americans, Hispanics, Asians) and international populations.
In a 2007 study examining the prevalence of eating disorders among African Americans and Caribbean Blacks, researchers found that AN was the rarest eating disorder among African American adults and not found among Caribbean Blacks, suggesting that African Americans are more at risk for AN, and that BED was the most prevalent eating disorder across both racial groups (Taylor et al., 2007). It was also found that African American women seem to be more satisfied with their weight/appearance than white women and are less likely to engage in disordered eating behaviors despite higher rates of obesity, which may be due to the
development of strong positive self-valuation and alternative standards of beauty in response to the stigmatizing effect of white beauty standards (Lovejoy, 2001). The study argues that because of the more flexible beauty standards and body positivity in the black community, African- American women are less likely than white women to develop eating disorders. However, these
8
standards may also be the reason why black women sometimes deny health problems such as binge eating, overeating, and obesity (Lovejoy, 2001).
Latino freshman college students in Puerto Rico were found to display eating disorder behaviors, with 3.24% of students reporting BN symptoms and 9.59% reporting other disturbed eating symptoms and suggestions that binge eating behaviors are more frequent among Latino samples than restricting behaviors (Reyes-Rodriguez et al., 2010). Alegria et al.’s 2007 study confirms that eating disorders with binge eating behaviors is a significant health problem for Latino populations, particularly BED. This study also reported that those who lived in the U.S.
longer had a significantly higher risk for eating disorders, suggesting that acculturation plays a role in the development of eating disorders among Latinos.
Asian Americans were shown to have an overall low prevalence for eating disorders but that lifetime prevalence for BED is significantly higher for Asian women than for Asian men (Nicdao et al., 2007). Nicdao et al. also found that there was low treatment use for those with eating disorders and that those who did have eating disorders displayed some role impairment in their home, work, or personal/social life. In Haudek, Rorty, and Henker’s 1999 study, it was shown that Asian American women reported more body dissatisfaction than did Caucasian women. Unlike Latino samples, researchers showed that acculturation did not have a significant association with eating disorder behaviors among Asian American women but that low maternal caring/adverse mother-daughter relationships did, which may open doors for research on another topic of interest for factors influencing eating disorder behaviors: parent-child relationships.
Researchers have started to slowly broaden their focus to eating disorders in other countries. In Pike and Dunne’s 2015 review on the rise of eating disorders in Asia, the
relationship between an the increase in eating disorders in Asia and Westernization is explored
9
As Asia becomes more industrialized, the prevalence of eating disorders has also increased in countries like Fiji, where the original full-bodied beauty ideal has slowly transformed into the Western ‘thin body ideal’ as Western media was introduced to the islands, leading to an increase in the number of reported eating disorders (Pike & Dunne, 2015). There was also a significant association between binge-eating and acculturated body attitudes and standards in Fiji. However, in countries like South Korea, the prevalence of eating disorder symptoms is comparable to that in the West, suggesting that thin-ideal internalization/ body dissatisfaction may be more
widespread in South Korea than in the U.S. There was no significant difference found between Korean immigrants and native Koreans in eating pathology despite native Koreans having much lower BMIs, suggesting that native Korean standards and values may be responsible for
promoting disordered eating behaviors in addition to Western culture. Pike and Dunne even found that Korean college women and Chinese women displayed the highest rates of eating disorder symptoms and body dissatisfaction, with U.S. women being third, showing that in the future certain Asian countries may outpace the West in the prevalence of eating disorders.
Kolar et al. observed in a 2016 study on eating disorders in Latin America that the prevalence of AN in Latin American countries is low compared to that in the U.S. but that
similar rates were found among Hispanic immigrants in the U.S., suggesting the preservation and protective nature of the curvier Latino body ideal against AN. The researchers also showed that rates for BN in Latin America are comparable to those in the U.S. and that there are significantly higher rates of BED than in the U.S. This suggests that because of the high level of emotional value Latin American countries place on food, as reflected in the languages, these high rates of BED are maintained among Hispanic immigrant women in the U.S.
10
Two research questions will be explored in this study to further explore the role of ethnicity and acculturation in eating disorders: Is there a difference in risk factors based on ethnicity/acculturation and does knowing ethnicity/acculturation improve the predictability of eating disorder diagnoses?
Materials and Methods REDCap Survey Development
The survey distributed to the study participants was developed using REDCap electronic data capture tools hosted at Vanderbilt University (Harris et al., 2009). REDCap (Research Electronic Data Capture) is a secure, web-based application designed to support data capture for research studies, providing: 1) an intuitive interface for validated data entry; 2) audit trails for tracking data manipulation and export procedures; 3) automated export procedures for seamless data downloads to common statistical packages; and 4) procedures for importing data from external sources.
The survey consists of demographic questions and eating disorder risk factor questions pulled from established tests and scales. Basic demographic questions (age, education, income level, etc.) as well as questions regarding the participant’s immigration history were included in the survey. Questions about whether the participant is a U.S. citizen, where the participant was born, and if the participant immigrated to the U.S. were also included. The same set of questions were asked again but for each of the participant’s mother and father. Timestamps embedded into the survey were used to verify the validity of the participants’ survey answers. For example, if a participant completed and submitted the survey in under 10 minutes, their data was not included in the final data set.
11
Two variations of the survey were created and distributed via two platforms: Sona Systems at Vanderbilt University and Amazon Mechanical Turk (MTurk). Sona Systems software is a cloud-based research tool for universities where researchers can set up studies, recruit/manage participants, and collect real-time data reports. Both survey variations were identical in the number/kind of questions included and differed only in containing supplementary questions meant to ensure the participant received proper compensation for taking the survey.
The survey distributed on the Sona platform contained a supplementary question asking for the participant’s Vanderbilt email to ensure compensation with academic credit and was
confidential.
Amazon Mechanical Turk (MTurk) is a platform for crowdsourcing work used for individuals and businesses (Requesters) to outsource their jobs and research processes to a pool of human workers (otherwise known as “Turkers”) who can perform the tasks virtually
(Crowston, 2012). The unit of work on MTurk is called a human intelligence task (HIT), which may be carried out on Amazon’s system or take the Turker to another website such as REDCap for the task. HITs are completed in exchange for monetary payments, typically ranging from
$0.01- $4.00. The survey distributed on MTurk contained a supplementary question asking for the participant’s MTurk unique Worker ID to ensure proper monetary compensation and was anonymous. It also contained a section at the end of the survey for the Turker’s unique
completion code, which was automatically generated for the Turker when they reached the end of the survey. Turkers submitted the code to their HIT page in addition to their Worker ID in order to receive monetary compensation.
Measurement of Eating Disorders and Risk Factors
12
A total of 7 measurement tools were used to test for 15 separate constructs in the survey.
Risk factors include OCD, teasing/bullying, anxiety, and depression. Subscales of the Eating Disorder Inventory (perfectionism, body dissatisfaction, drive for thinness); the Acculturation, Habits, and Interests Multicultural Scale for Adolescents (assimilation, separation, integration, marginalization); and of the Eating Disorder Examination Questionnaire (restraint, eating concern, shape concern, weight concern) were also used to represent risk factors/symptoms of eating disorders.
Yale-Brown Obsessive Compulsive Scale (Y-BCOS). Obsessive-compulsive disorder symptoms was measured by the Yale-Brown Obsessive Compulsive Scale (Y-BOCS). The scale was designed by Wayne Goodman and his colleagues at Yale University to serve as a “specific measure of severity of symptoms of obsessive compulsive disorder that is not influenced by the type of obsessions or compulsions present” (Goodman et al., 1989). The scale has 10 items, with each item ranging from 0 (no symptoms) to 4 (extreme symptoms) (and a total range of 0 to 40) with separate subtotals for obsession and compulsion severities. The levels of severity of OCD are measured by overall score. If the individual has both obsessions and compulsions, then mild OCD has a score range of 8-15, moderate OCD of 24-31, severe OCD of 24-31, and extreme OCD of 32-40. Reliability was established by a study with four raters and 40 patients with OCD at various treatment stages. Interrate reliability for the scale had a significant level of internal consistency and each item on the scale was measured across a range of severity (Goodman et al., 1989).
Teasing Questionnaire-Revised (TQ-R). Bullying was measured by the Teasing Questionnaire-Revised (TQ-R). The original Teasing Questionnaire (TQ) was developed by Roth, Coles, and Heimberg to study the relationship between memories for childhood teasing
13
and adulthood depression/anxiety (Roth et al., 2002). The TQ-R was developed by Storch et al.
(2004) to assess multiple domains of teasing. The TQ-R consists of 29 items based on a five- factor model that evaluates recalled childhood teasing related to academic issues, performance, family background, social behavior, and appearance (Strawser, Storch, & Roberti, 2004).
Responses were made on a five-point Likert-type scale with 0=“I was never teased about this,”
1= “I was rarely teased about this,” 2= “I was sometimes teased about this,” 3= “I was often teased about this,” and 4= “I was always teased about this.” Tcores are calculated by adding each answer together. Results from a study consisting of 414 students form the University of Florida and Louisiana State University showed convergent validity and internal consistency of scores (Strawser et al., 2004).
PROMIS Short Form for anxiety (7a). Anxiety was measured by the PROMIS Short Form for anxiety (7a). The form was developed by the Patient-Reported Outcomes Measurement Information System (PROMIS), a National Institute of Health (NIH) Roadmap initiative meant to improve self-reported outcomes with psychometric methods. An initial bank of 1,404 items was narrowed down to 29 items calibrated for anxiety using item response theory. Test
information curves were used to show that the item bank provided more information than traditional measures. A short form was developed consisting of seven items based on item information/content and simulations of computerized adaptive testing (CAT) results (Pilkonis, 2011). Answer categories consist of 1=Never, 2=Rarely, 3=Sometimes, 4=Often, and 5=Always.
Scores are calculated by adding the answers to the seven questions together.
Patient Health Questionnaire (PHQ-8). Depression was measured by the Patient Health Questionnaire (PHQ-8), an eight-item version of the Patient Health Questionnaire depression scale. The PHQ-8 was standardized to ask the number of days in the past 2 weeks that the
14
respondent had experienced a certain depression symptom. Categories include 0-1 day=not at all, 2-6 days=several days, 7-11 days=more than half the days, 12-14 days=nearly every day) Points (0-3) are assigned to each category respectively. A total score of 0-4 indicates no significant depressive symptoms, of 5-9 indicates mild depressive symptoms; 10-14, moderate; 15-19, moderately severe; and 20-24, severe (Kroenke et al., 2001). A study showed that the PHQ-8 scores had similar results in defining depression as the PHQ-8 diagnostic algorithm, indicating that the PHQ-8 is an effective definition and measure of depression in the general population (Kroenke et al., 2009).
Eating Disorder Inventory (EDI). Perfectionism, body dissatisfaction, and drive for thinness were measured by subscales of the Eating Disorder Inventory (EDI), which was
developed by Garner et al. in 1984. The EDI is a 64 item self-report multiscale measure designed to evaluate the psychological/behavioral traits common in AN and BN. The drive for thinness, body dissatisfaction, and perfectionism subscales will be utilized in the survey. Each subscale has eight six-point items were participants respond by rating whether each item occurs always, usually, often, sometimes, rarely, or never. The most extreme “anorexic” response (always or never, depending on the item) receives a score of 3, followed by 2 and 1 for adjacent responses, and the three choices opposite of the most “anorexic” response receives a score of 0. Subscale scores are calculated by adding the answers to each respective subscale together. Reliability and convergent/discriminant validity were established for all subscales using cross-validation procedures (Garner et al., 1984).
Acculturation, Habits, and Interests Multicultural Scale for Adolescents (AHIMSA).
Acculturation was measured by the Acculturation, Habits, and Interests Multicultural Scale for Adolescents (AHIMSA), an eight-item multidimensional/multicultural acculturation measure for
15
adolescents. Items were adapted from existing scales and also newly written by researchers from the Cultural Dynamics and Outreach Core. Each item was written to be applicable to respondents of any ethnic/cultural background living in the U.S.
The scale consists of four subscores: United States Orientation (Assimilation), Other Country Orientation (Separation), Both Countries Orientation (Integration), and Neither Country Orientation (Marginalization). Response options to the scale items were United States, the country my family is from, both, and neither. Assimilation was measured by the total number of
“United States” responses, Separation by the total number of “the country my family is from”
responses; Integration, “both” responses; and Marginalization, “neither” responses. The score for each orientation type may range from 0-8. The AHIMSA scale was validated using a modified version of the Acculturation Rating Scale for Mexican Americans-II (ARMSA-II) (Unger et al., 2002).
Eating Disorder Examination Questionnaire (EDE-Q). Eating disorder prevalence was measured through the Eating Disorder Examination Questionnaire (EDE-Q), a 36-item self- report questionnaire with 4 subscales (restraint, eating concern, shape concern, weight concern) and a global score. The EDE-Q was adapted from the Eating Disorder Examination Interview (EDE). It consists of items concerning behaviors over a period of 28 days with a scoring system of 0-6 (0=no days, 1=1-5 days, 2=6-12 days, 3=13-15 days, 4=16-22 days, 5=23-27 days, 6=every day). Higher scores indicate greater levels of eating behavior disturbance. Results show that the EDE-Q has acceptable criterion validity and good concurrent validity (validated using the EDE) (Mond et al., 2004).
Inclusion criteria
16
Qualified participants for this study were females ages 18-64, U.S. residents, and proficient in English.
Recruitment strategies
Sona Systems. Participants were recruited from Vanderbilt University using Sona Systems with the help of the Vanderbilt Psychology Department. The survey link was uploaded as an available study onto the Sona website and a mass email containing the Sona link was sent on two separate occasions to the Sona list (typically made of undergraduate students currently or previously enrolled in a Vanderbilt psychology course). 2 academic credits were given as
compensation for filling out the survey.
Amazon Mechanical Turk (MTurk). Participants were also recruited using MTurk. The REDCap survey link was posted as a Human Intelligence Task (HIT) on the platform. A
screening measure was put in place to only allow female Turkers to see and preview the HIT.
Qualified Turkers were able to browse among other existing HITs and complete the survey in exchange for a monetary payment ($2.00).
Final data set
844 responses were collected from Sona (n=141) and Mturk (n=703). Sona participants were only given academic credit after their responses were manually reviewed for validity using the REDCap timestamps. Only responses where participants spent 10 minutes or more on the survey were included in the final data set. Responses from MTurk were included in only if Turkers entered a unique completion code, which they received at the end of the survey and submitted to their HIT page in order to receive compensation, and entered their unique MTurk Worker ID. For both Sona and MTurk, only those who marked “female” in the gender identity section of the survey were included in the final dataset. Those who marked “male” or “other”
17
were excluded. 265 MTurk responses (37.69%) and no Sona responses (0%) were dropped. A total of 579 responses were included in for analysis in this study (nSona=141, nMTurk=438).
Race/ethnicity categories
Both survey variations contain a question on race/ethnicity and asked the participant to check all that apply. Options for race/ethnicity were White; Hispanic, Latino, or Spanish; Black or African American; Asian; American Indian or Alaska Native; Middle Eastern or North African; Native Hawaiian or other Pacific Islander; and Other. Five race/ethnicity categories were created for analysis: White, Hispanic, African American, Asian, and
Other/unknown/mixed. The final category included American Indian or Alaska Native, Middle Eastern or North African, Native Hawaiian or other Pacific Islander, and Other options including responses where more than one option for race/ethnicity were marked.
Immigration status
Both survey variations contain questions on the participant’s immigration status (whether the participant is a U.S. citizen, if the participant immigrated to the U.S., and if so, the age at which the participant immigrated). The same questions for each of the participant’s parents’
immigration status were also included. Participants whose mothers and fathers did not immigrate to the U.S. were categorized as “non-immigrants;” participants whose mothers and/or fathers immigrated to the U.S. were categorized as “first-generation;” and participants who immigrated to the U.S. were categorized as “foreign-born.”
Acculturation variables
Four sub-scores for acculturation were gathered: assimilation, separation, integration, and marginalization. For the purpose of the study, we intended to use the assimilation sub-score to observe acculturation level but did not use it in the final data analysis. Too much missing data
18
and a lack of complete responses for the acculturation section of the survey rendered the remaining acculturation data incomplete and unfit for analysis. A possible explanation for the amount of missing data for this specific section is that participants assumed they did not need to answer questions on acculturation if they/their parents were born in the U.S. and did not
immigrate. Immigration status was used for analysis in place of acculturation.
Results Sample Demographics
Table 1 displays the demographic variables for the participants by source (Sona and MTurk). A crosstab was conducted to generate the frequency of the demographic variables as well as a chi-square test of independence between the demographic variables and source.
Information on race/ethnicity, education, current employment, and immigration status/history of the participant and each of the participant’s parents was included. Of all the participants, 350 (60.45%) identified as White, 45 (7.77%) as Hispanic, 55 (9.50%) as African American, 89 (15.37%) as Asian, and 40 (6.91%) as Other/unknown/mixed (p=0.0030). 433 participants (74.78%) were categorized as non-immigrants, 93 (16.06%) as first-generation, and 53 (9.15%) as foreign born (p=0.0001). The majority of both Sona (n=90, 74.78%) and MTurk subjects (n=343, 78.31%) were categorized as non-immigrants followed by first generation (n=42, 29.79%; n=51, 11.64%, respectively) and foreign-born (n=9, 6.38%; n=44, 10.05%,
respectively). With regards to age, 141 (100%) of the Sona participants were ages 18-24 while 374 (85.39%) and 55 (12.56%) of the MTurk participants were ages 25-35 and 18-24,
respectively (p=0.0001). 102 (72.86%) Sona participants selected “some college” and 125 (89.29%) selected “student” as their education and current employment status while 203
19
(47.10%) and 275 (63.81%) of MTurk participants selected “Bachelor’s degree” and
“employed,” respectively (p=0.0001).
20
Table 1.
Demographic characteristics of MTurk and Sona participants
Source MTurk Sona Total
n % n % n % P-value
Race/ethnicity White 282 64.38% 68 48.23% 350 60.45% 0.0030
Hispanic 31 7.08% 14 9.93% 45 7.77%
African American 42 9.59% 13 9.22% 55 9.50%
Asian 55 12.56% 34 24.11% 89 15.37%
Other/unknown/mixed 28 6.39% 12 8.51% 40 6.91%
Total 438 100.00% 141 100.00% 579 100.00%
Immigration status Non-immigrant 343 78.31% 90 63.83% 433 74.78% 0.0001
First-generation 51 11.64% 42 29.79% 93 16.06%
Foreign-born 44 10.05% 9 6.38% 53 9.15%
Total 438 100.00% 141 100.00% 579 100.00%
What is your age? 18-24 55 12.56% 140 100.00% 195 33.74%
25-35 374 85.39% 0 0.00% 374 64.71%
36-44 5 1.14% 0 0.00% 5 0.87%
45-64 4 0.91% 0 0.00% 4 0.69%
Total 438 100.00% 140 100.00% 578 100.00%
Highest level of school completed Less than high school 1 0.23% 0 0.00% 1 0.18% 0.0001 Some high school (no
diploma)
2 0.46% 0 0.00% 2 0.35%
High school graduate (diploma or an equivalent)
40 9.28% 32 22.86% 72 12.61%
Some college 75 17.40% 102 72.86% 177 31.00%
Associate degree 50 11.60% 2 1.43% 52 9.11%
Bachelor’s degree 203 47.10% 4 2.86% 207 36.25%
Master’s degree 54 12.53% 0 0.00% 54 9.46%
Professional degree 3 0.70% 0 0.00% 3 0.53%
21
Source MTurk Sona Total
n % n % n % P-value
Doctorate degree 3 0.70% 0 0.00% 3 0.53%
Total 431 100.00% 140 100.00% 571 100.00%
Current employment status Employed for wages 275 63.81% 8 5.71% 283 49.56% 0.0001
Self-employed 80 18.56% 0 0.00% 80 14.01%
Unemployed and currently looking for work
12 2.78% 3 2.14% 15 2.63%
Unemployed and not currently looking for work
3 0.70% 4 2.86% 7 1.23%
Student 21 4.87% 125 89.29% 146 25.57%
Homemaker 36 8.35% 0 0.00% 36 6.30%
Unable to work 4 0.93% 0 0.00% 4 0.70%
Total 431 100.00% 140 100.00% 571 100.00%
Father's U.S. citizenship No 82 19.03% 48 34.29% 130 22.77% 0.0001
Yes 349 80.97% 92 65.71% 441 77.23%
Total 431 100.00% 140 100.00% 571 100.00%
Father's immigration status No 367 85.15% 94 67.14% 461 80.74% 0.0001
Yes 64 14.85% 46 32.86% 110 19.26%
Total 431 100.00% 140 100.00% 571 100.00%
Father's age of immigration Under 12 years old 7 11.29% 6 13.04% 13 12.04% 0.5840
12-17 years old 8 12.90% 4 8.70% 12 11.11%
18-24 years old 13 20.97% 12 26.09% 25 23.15%
25-34 years old 18 29.03% 17 36.96% 35 32.41%
35-44 years old 8 12.90% 4 8.70% 12 11.11%
45-54 years old 4 6.45% 3 6.52% 7 6.48%
55-64 years old 4 6.45% 0 0.00% 4 3.70%
Total 62 100.00% 46 100.00% 108 100.00%
Mother's U.S. citizenship No 88 20.42% 44 31.43% 132 23.12% 0.0070
Yes 343 79.58% 96 68.57% 439 76.88%
22
Source MTurk Sona Total
n % n % n % P-value
Total 431 100.00% 140 100.00% 571 100.00%
Mother's immigration status No 373 86.54% 95 67.86% 468 81.96% 0.0001
Yes 58 13.46% 45 32.14% 103 18.04%
Total 431 100.00% 140 100.00% 571 100.00%
Mother's age of immigration Under 12 years old 6 10.34% 3 6.67% 9 8.74% 0.2750
12-17 years old 9 15.52% 7 15.56% 16 15.53%
18-24 years old 11 18.97% 10 22.22% 21 20.39%
25-34 years old 18 31.03% 22 48.89% 40 38.83%
35-44 years old 7 12.07% 2 4.44% 9 8.74%
45-54 years old 6 10.34% 1 2.22% 7 6.80%
55-64 years old 1 1.72% 0 0.00% 1 0.97%
Total 58 100.00% 45 100.00% 103 100.00%
Participant's U.S. citizenship No 58 13.46% 12 8.57% 70 12.26% 0.1260
Yes 373 86.54% 128 91.43% 501 87.74%
Total 431 100.00% 140 100.00% 571 100.00%
Participant's immigration status No 387 89.79% 131 93.57% 518 90.72% 0.1810
Yes 44 10.21% 9 6.43% 53 9.28%
Total 431 100.00% 140 100.00% 571 100.00%
Participant's age of immigration Under 12 years old 13 29.55% 9 100.00% 22 41.51% 0.0090
12-17 years old 6 13.64% 0 0.00% 6 11.32%
18-24 years old 14 31.82% 0 0.00% 14 26.42%
25-34 years old 9 20.45% 0 0.00% 9 16.98%
35-44 years old 1 2.27% 0 0.00% 1 1.89%
45-54 years old 1 2.27% 0 0.00% 1 1.89%
Total 44 100.00% 9 100.00% 53 100.00%
23
Regarding U.S. citizenship and immigration status, 96 (68.57%) Sona participants’
mothers and 343 (79.58%) MTurk participants’ mothers were U.S. citizens. 92 (65.71%) Sona participants’ fathers and 349 (80.97%) MTurk participants’ fathers were U.S. citizens. 45 (32.14%) Sona participants’ mothers and 46 fathers (32.86%) immigrated to the U.S. while 58 MTurk participants’ mothers (13.46%) and 64 fathers (14.85%) immigrated to the U.S. In total, those who immigrated to the U.S. did so between the ages of 25-34 for both the participants’
mothers (n=40, 38.83%) and fathers (n=35, 32.41%). Among the 53 (9.28%) total participants who immigrated to the U.S., 9 (100%) Sona participants were under 12 years old while 14 (31.82%) of the MTurk participants were between 18-24 years old (p=0.0090).
Descriptive Statistics on Risk Factors
Race/ethnicity differences in risk factor scores
A one-way ANOVA was conducted to analyze differences in eating disorder risk factors based on race/ethnicity (Table 2). According to the data, there were no significant differences in risk factor scores based on the participants’ race/ethnicity (p>0.05).
24
Table 2.
Differences in dependent variables (risk factors) based on race/ethnicity
Race/ethnicity White Hispanic African American Asian Other/unknown/mixed
Mean S.D. Mean S.D. Mean S.D. Mean S.D. Mean S.D. P-value
OCD 12.83 7.35 12.18 7.05 10.61 7.97 13.79 6.19 13.78 7.82 0.1190
Teasing/Bullying 18.21 13.93 18.33 14.68 15.53 12.89 21.94 16.84 19.38 14.35 0.1090
Anxiety 19.29 6.51 19.58 5.81 17.02 6.83 19.54 6.13 20.16 7.70 0.1390
Depression 7.64 5.82 7.91 5.97 6.60 5.43 7.70 5.73 7.50 5.81 0.7710
Eating concern 1.70 1.57 1.56 1.57 1.27 1.50 1.61 1.49 1.24 1.42 0.2340
Shape concern 3.13 1.70 3.14 1.72 2.71 1.78 2.60 1.53 2.77 1.69 0.0570
Weight concern 2.83 1.61 2.73 1.72 2.53 1.79 2.51 1.56 2.62 1.69 0.4110
Restraint 2.20 1.75 2.34 1.86 1.62 1.70 1.85 1.64 1.90 1.56 0.0870
Perfectionism 7.09 5.23 6.18 4.71 8.17 5.47 7.40 5.37 7.97 4.93 0.3390
Drive for thinness 7.07 5.72 6.24 5.65 6.27 4.93 6.40 5.76 6.19 5.64 0.6450 Body
dissatisfaction
11.87 7.93 11.18 7.78 11.39 7.60 9.04 6.67 10.97 9.24 0.0540
25
Immigration status differences in risk factor scores
A one-way ANOVA was conducted to analyze the differences in risk factors based on immigration status (Table 3a). Significant differences in teasing/bullying (p=0.0001),
perfectionism (p=0.0060), and body dissatisfaction (0.0260) based on immigration status were found. Table 3b displays a Turkey post hoc test that demonstrates a statistically significant difference in teasing/bullying between non-immigrant and foreign-born participants (p=0.0001) and first-generation and foreign-born participants (p=0.0010). There was a significant difference in perfectionism between non-immigrant and first-generation participants (p=0.0040) and first- generation and foreign-born participants (p=0.0900). A significant difference in body
dissatisfaction between non-immigrant and foreign-born participants was found as well (p=0.021).
Table 3a.
Differences in risk factors based on immigration status
Immigration status Non-immigrant First-generation Foreign-born
Mean S.D. Mean S.D. Mean S.D. P-value
OCD 12.40 7.59 13.59 6.42 14.17 5.90 0.1240
Teasing/Bullying 17.63 14.18 18.17 11.59 27.15 18.10 0.0001
Anxiety 19.07 6.62 20.00 6.14 18.74 6.40 0.4060
Depression 7.45 5.85 7.77 5.38 8.08 5.83 0.7000
Eating concern 1.60 1.55 1.41 1.47 1.98 1.62 0.1030
Shape concern 3.04 1.68 2.88 1.77 2.76 1.59 0.4180
Weight concern 2.78 1.61 2.60 1.77 2.63 1.57 0.5500
Restraint 2.11 1.75 1.99 1.78 2.06 1.55 0.8480
Perfectionism 6.91 5.21 8.82 5.24 6.94 4.85 0.0060
Drive for thinness 6.80 5.67 6.77 5.91 6.56 4.94 0.9570 Body dissatisfaction 11.68 7.98 10.96 7.60 8.65 6.34 0.0260
26
Table 3b.
Differences in risk factors based on immigration status (Turk HSD) (I)
Immigration status
(J) Immigration status
Mean Difference (I-J)
Std.
Error
Sig.
Teasing/bullying Non- immigrant
First-generation -0.54 1.63 0.9410 Foreign-born -9.52* 2.07 0.0001 First-
generation
Non-immigrant 0.54 1.63 0.9410 Foreign-born -8.98* 2.45 0.0010 Foreign-born Non-immigrant 9.52* 2.07 0.0001 First-generation 8.98* 2.45 0.0010 Perfectionism Non-
immigrant
First-generation -1.91* 0.60 0.0040 Foreign-born -0.03 0.75 0.9990 First-
generation
Non-immigrant 1.91* 0.60 0.0040 Foreign-born 1.88 0.89 0.0900 Foreign-born Non-immigrant 0.03 0.75 0.9990 First-generation -1.88 0.89 0.0900 Body dissatisfaction Non-
immigrant
First-generation 0.72 0.90 0.6980 Foreign-born 3.03* 1.13 0.0210 First-
generation
Non-immigrant -0.72 0.90 0.6980 Foreign-born 2.31 1.34 0.1990 Foreign-born Non-immigrant -3.03* 1.13 0.0210 First-generation -2.31 1.34 0.1990
* The mean difference is significant at the 0.05 level.
Assimilation and Immigration status
A one-way ANOVA was conducted to see whether assimilation differed based on immigration status, focusing on first-generation and foreign-born subjects. Assimilation was measured via the AHIMSA Acculturation Scale (Unger, 2002). Response options to the scale items were United States, the country my family is from, both, and neither. Assimilation was calculated by the total number of “United States” responses and ranged from a scale of 0-8. The higher the score, the more assimilated the subject is.
27
There is a statistically significant difference in the means of assimilation between the different levels of immigration status (p=0.0001). Foreign-born subjects were shown to have higher average assimilation scores (x̄ =4.512, S.D.=2.85, n=53) than first-generation subjects (x̄ =4.05, S.D.=2.41, n=92). Because the differences in immigration status were demonstrated to be correlated with different degrees of assimilation, our data analysis will be focused on
immigration status with regards to eating disorder risk factors.
Table 4.
Assimilation and immigration status ANOVA
Assimilation
N Mean S.D. S.D. P-value
Non-immigrant 423 5.98 2.89 0.14 0.0001
First-generation 92 4.05 2.41 0.25
Foreign-born 53 4.52 2.85 0.39
Total 568 5.53 2.91 0.12
Intercorrelation of risk factors
Table 5 shows the correlations between the dependent variables. The strongest significant correlation was between shape concern and weight concern (r=0.928, p<0.01) while the weakest significant correlation was between body dissatisfaction and teasing/bullying (r=0.122, p<0.01).
Other strong correlations included those between eating concern and weight concern (r=0.747, p<0.01), shape concern and restraint (r=0.735, p<0.01), and shape concern and drive for thinness (r=0.758, p<0.01). All correlation of the different risk factors/symptoms were positive, indicating that as scores for one risk factor increase, scores of another risk factor tend to increase as well.
28
Table 5.
Correlation matrix of dependent variables OCD Teasing/
bullying
Anxiety Depression Restraint Eating concern
Shape concern
Weight concern
Body
dissatisfaction
Drive for thinness
Perfectionism
OCD 1 .415** .601** .610** .351** .512** .418** .403** .215** .358** .197**
Teasing/bullying .415** 1 .435** .535** .357** .524** .315** .346** .122** .251** .159**
Anxiety .601** .435** 1 .717** .381** .449** .443** .430** .276** .375** .310**
Depression .610** .535** .717** 1 .436** .574** .510** .485** .324** .413** .234**
Restraint .351** .357** .381** .436** 1 .722** .735** .724** .420** .690** .229**
Eating concern .512** .524** .449** .574** .722** 1 .734** .747** .433** .652** .196**
Shape concern .418** .315** .443** .510** .735** .734** 1 .928** .716** .758** .271**
Weight concern .403** .346** .430** .485** .724** .747** .928** 1 .669** .727** .253**
Body
dissatisfaction
.215** .122** .276** .324** .420** .433** .716** .669** 1 .529** .160**
Drive for thinness .358** .251** .375** .413** .690** .652** .758** .727** .529** 1 .384**
Perfectionism .197** .159** .310** .234** .229** .196** .271** .253** .160** .384** 1
** Correlation is significant at the 0.01 level (2-tailed).
29
Factor analysis of risk factors
Because the dependent variables were highly correlated, a factor analysis was done to reduce the number of variables to a smaller set of constructs. Principal component extraction with Varimax rotation was performed to conduct a factor analysis of the various eating disorder risk factors/symptoms. Using the criteria of an eigenvalue greater than one, a two-factor solution was selected for use in subsequent analyses.
Table 6 presents the factor loadings sorted by strength within each of the two factors. The first factor was interpreted as body image, and the second factor interpreted as mental health.
Shape concern (0.91), weight concern (0.89), drive for thinness (0.82), restraint (0.78), and body dissatisfaction (0.77) had moderate-to-strong loading for body image while depression (0.82), anxiety (0.81), OCD (0.76), and teasing/bullying (0.69) had moderate-to-strong loading for mental health. Eating concern had a strong loading for body image (0.70) and a moderate loading for mental health (0.48). Perfectionism had a weak loading for both body image (0.24) and mental health (0.34). Factor scores were computed in SPSS using the regression method. These factors scores have a mean of zero and standard deviation of one, and are the dependent variables used to test the hypotheses about race/ethnicity and immigration status.
30
Table 6.
Rotated scores of risk factors/symptoms
Risk factors/symptoms Body image Mental health
Shape concern 0.91 0.29
Weight concern 0.89 0.29
Drive for thinness 0.82 0.24
Restraint 0.78 0.28
Body dissatisfaction 0.77 0.05
Eating concern 0.70 0.48
Depression 0.27 0.82
Anxiety 0.20 0.81
OCD 0.19 0.76
Teasing/Bullying 0.13 0.69
Perfectionism 0.24 0.34
Race/ethnicity and immigration status
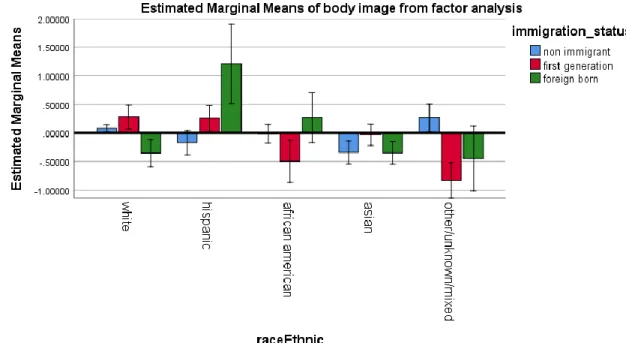
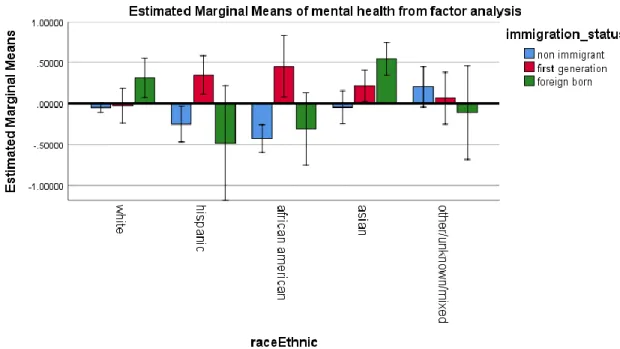
Table 7a displays the results of a 5 by 3 two-way ANCOVA on race/ethnicity (White, Hispanic, African American, Asian, other/unknow/mixed) and immigration status (non- immigrant, foreign born, first generation) controlling for age. Two separate analyses were conducted, one for the body image factor and the other for the mental health factor. There was a statistically significant effect for age in the analysis of body image (p=0.0001). Neither the main effect for race/ethnicity nor the main effect for immigration status was significant. A significant two-way interaction effect between race/ethnicity and immigration status was found for body image (p=0.01). No significant main effects or interaction effects of race/ethnicity and immigration status and age were found for mental health.
31
Table 7a.
Relationship of race/ethnicity and immigration status with body image and mental health
Body image Source Type III Sum of
Squares
df Mean
Square
F Sig.
Corrected Model 39.109a 15 2.61 2.74 0.00
Intercept 9.79 1.00 9.79 10.29 0.00
Age 9.61 1.00 9.61 10.11 0.00
Race/ethnicity 7.60 4.00 1.90 2.00 0.09
Immigration status 1.09 2.00 0.55 0.57 0.56
Race/ethnicity*immigration status
18.44 8.00 2.30 2.42 0.01
Error 465.89 490.00 0.95
Total 505.00 506.00
Corrected Total 505.00 505.00
Mental Health
Source Type III Sum of
Squares
df Mean
Square
F Sig.
Corrected Model 24.156a 15.0 1.6 1.6 0.1
Intercept 0.01 1.00 0.01 0.01 0.94
Age 0.03 1.00 0.03 0.03 0.85
Race/ethnicity 3.24 4.00 0.81 0.83 0.51
Immigration status 4.59 2.00 2.29 2.34 0.10
Race/ethnicity*immigration status
8.719 8 1.09 1.111 0.354
Error 480.844 490 0.981
Total 505 506
Corrected Total 505 505
a R Squared = .077 (Adjusted R Squared = .049)
A simple main effects test was conducted to further explore the significant two-way interaction effect between race/ethnicity and immigration status (Table 7b). The adjusted mean body image score of Whites was 0.42 higher (S.D.=0.21, p=0.042) than among Asians when looking at non-immigrants. When looking at first-generation subjects, the mean body image score of Whites was 1.11 higher (S.D.=0.37, p=0.003) than that of Other/unknown/mixed. First- generation Hispanic and Asian subjects had a mean body image 1.08 (S.D.=0.39, p=0.005) and 0.79 (S.D.=0.36, p=0.028) higher than Other/unknown/mixed, respectively. Among foreign-born
32
subjects, the mean body image scores for Hispanics were 1.55 higher (S.D.=0.73, p=0.034) and 1.56 higher (S.D.=0.72, p=0.031) than Whites and Asians, respectively.
33
Table 7b.
Relationship of body image with the interaction of immigration status and race/ethnicity
Immigration Race/ethnicity Race/ethnicity Mean Difference S.D. P-value
Non-immigrant White Hispanic 0.25 0.22 0.256
African American 0.10 0.18 0.571
Asian .42* 0.21 0.042
Other/unknown/mixed -0.18 0.25 0.470
Asian White -.42* 0.21 0.042
Hispanic -0.17 0.29 0.557
African American -0.32 0.26 0.211
Other/unknown/mixed -0.61 0.32 0.055
First-generation White Hispanic 0.03 0.31 0.931
African American 0.78 0.42 0.067
Asian 0.31 0.28 0.261
Other/unknown/mixed 1.11* 0.37 0.003
Hispanic White -0.03 0.31 0.931
African American 0.75 0.43 0.084
Asian 0.29 0.30 0.333
Other/unknown/mixed 1.08* 0.39 0.005
Asian White -0.31 0.28 0.261
Hispanic -0.29 0.30 0.333
African American 0.47 0.41 0.262
Other/unknown/mixed .79* 0.36 0.028
Other/unknown/mixed White -1.11* 0.37 0.003