This paper examines whether the availability of consumer loans has a positive or negative effect on the indicators of financial well-being for consumers in the same area. By observing the number of consumer lending institutions and reducing those numbers to financial indicators, such as percentage in poverty and median household income, this paper observes any statistically significant. Results show a limited number of statistically significant relationships in the years following the 2008-2009 financial crisis.
The economic welfare variables are percent in poverty, median household income, and Chapter 7 bankruptcy filings. The lack of statistical significance in these regressions indicates that there must be some correlation in the U.S.
Introduction
The NAICS definition of consumer lending does not include credit card issuance, sales financing, or other secondary market financing. Access is measured by the number of consumer lending institutions present in a state or country. The presence and prevalence of consumer lending institutions will be influenced by both the legality of high interest lending and a demand within that state for consumer lending.
Because this study treats each business the same, it does not take into account the fact that one consumer lending institution may make many more loans than another business and therefore have a greater proportional effect on the state or country. This definition is quite broad, so the data does not identify how many of the loans made by consumer lending institutions are indeed small, high-risk loans.
Review of Other Studies
In 2013, the FTC released a debt-buying report that highlighted several flaws in the debt-buying industry. The FTC was particularly concerned about the lack of information and supporting documents being transmitted to the debt buyer. Without proper information about the principal balance, interest rate, time in default, etc., the debt buyer may attempt to collect an incorrect amount from the debtor.
Without supporting documents, the debtor will not be able to dispute the validity of the debt buyer's claim. As noted earlier, consumer lending institutions are likely to emerge in communities where the demand for high-risk credit is high, communities that are similar.
Legal Review of States’ Consumer Lending Laws
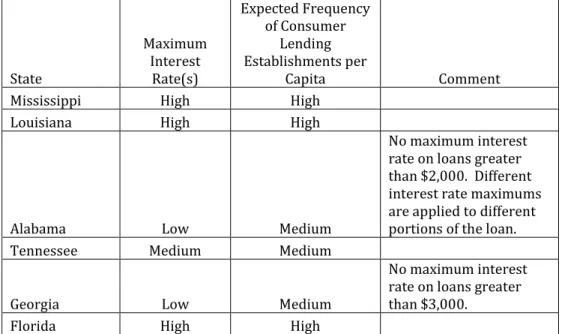
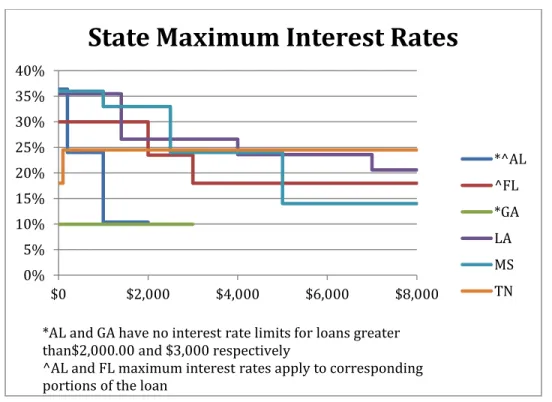
Most states allow relatively small interest-free fees, but the purpose of applying the maximum interest rate varies considerably. For loans received after June 30, 2013, the loan amount to which each maximum interest rate is applied has been increased, which is beneficial for consumer lending institutions. Alabama and Florida allow each interest rate cap to apply to that portion of the loan, so a loan can have multiple cap rates.
Alabama and Georgia have low maximum interest rates for small consumers, but no interest rate maximum for larger consumer loans. Categories for each state's maximum interest rate and expected frequency of consumer lending institutions per capita.
Data
- Sources
- Trends in Consumer Lending Establishments
- a. National Level Summary
- b. State Level Summary
Population estimates are available for each state and county for 2013.18 These estimates are used to calculate all per capita values, such as per capita consumer lending institutions and per capita Chapter 7 bankruptcy filings. GDP per capita is taken from Bureau of Economic Analysis - Regional Data - GDP and Personal Income.19 Changes in U.S. wages and incomes reflect the ability or inability of the population to maintain a stable income that might not be possible in the event of critical financial obligations. they cannot through the use of consumer loans.
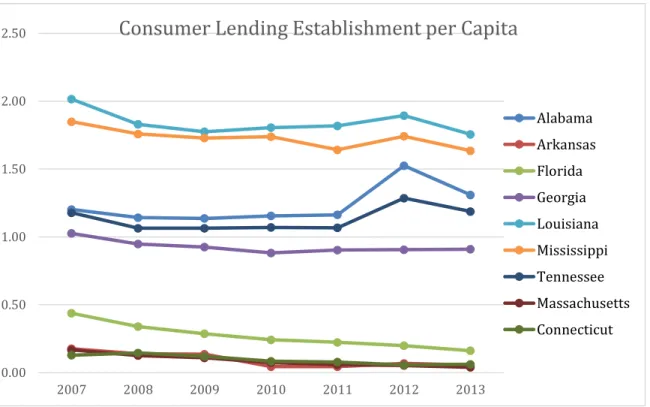
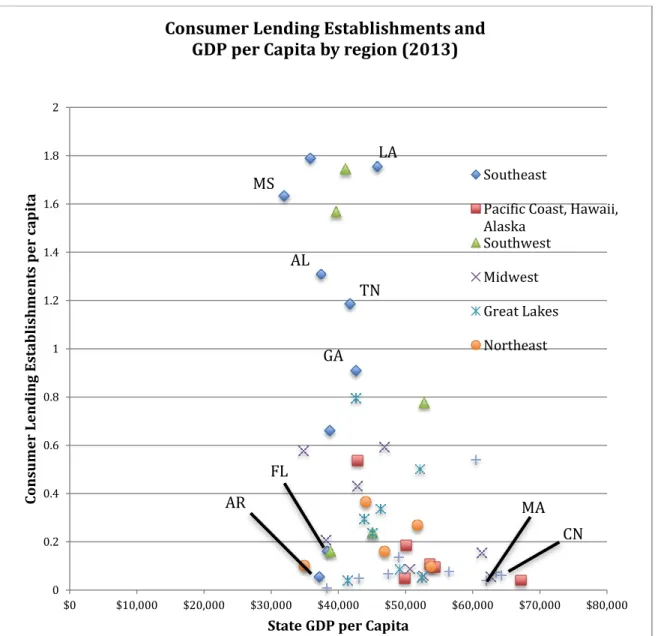
If consumer credit helps individuals meet basic financial needs, poverty rates should improve where the availability of consumer credit increases. There are more consumer loan sharks in the Southern states per capita than any other geographic area in the United States. Six states in this study have among the highest per capita consumer loan numbers in the nation with the exception of Florida, which has a below-average number of institutions per capita (0.161).
A look at which states have higher concentrations of consumer lending institutions next to the state's GDP provides economic context for the analysis of this study. Arkansas is unique among Southern states in that it expressly prohibits almost all consumer lending institutions. Northeastern and New England states have much lower concentrations of consumer lending institutions, and their GDPs sit among the middle to upper levels in the nation.
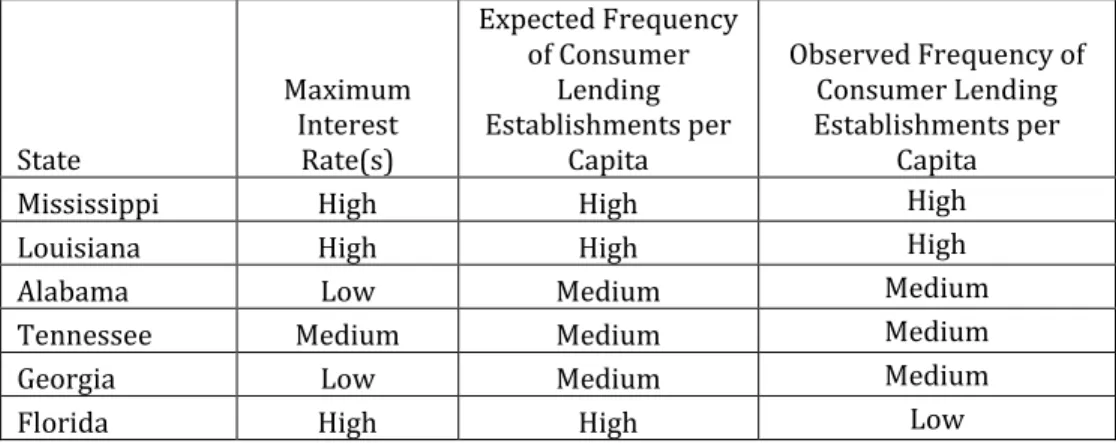
Some southwestern states, particularly Oklahoma and New Mexico, are scattered among the southeastern states with high levels of consumer lending institutions and may be worth examining in the future. Mississippi, Louisiana, Alabama, Tennessee, Georgia and Florida were identified as candidates for research due to their trends in consumer lending. Categories for each country's top interest rate, expected frequency of consumer loan institutions per capita, and observed frequency.
Regression Results
State Level Results
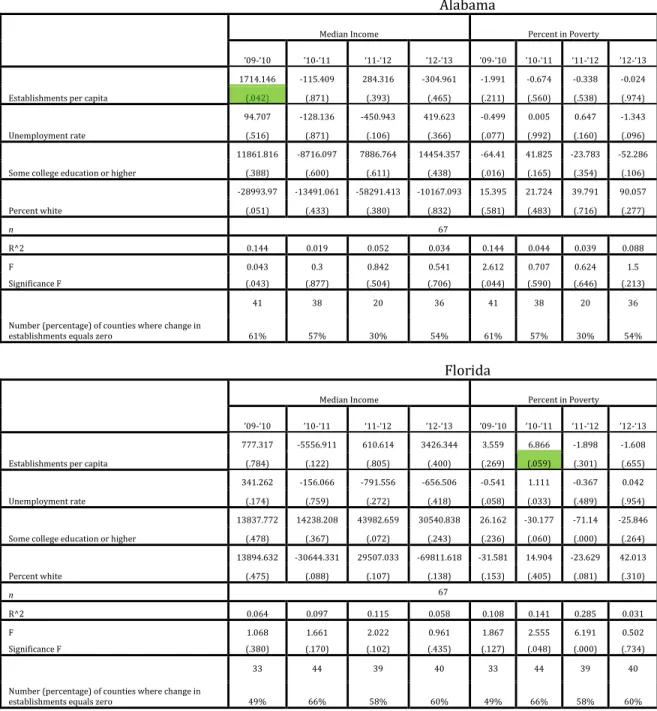
The three control variables are the change in the unemployment rate (∆Unempl), the change in the percentage of the population that has a college education or higher (∆PctColl), and the change in the percentage of the population that is white (∆PctWht). The three dependent variables (measures of changes in consumer financial well-being) are shown at the top and the independent variables are shown down the left side. The estimated coefficients are presented together with their p-values; Summary statistics of R2 and F are presented at the bottom of the table.
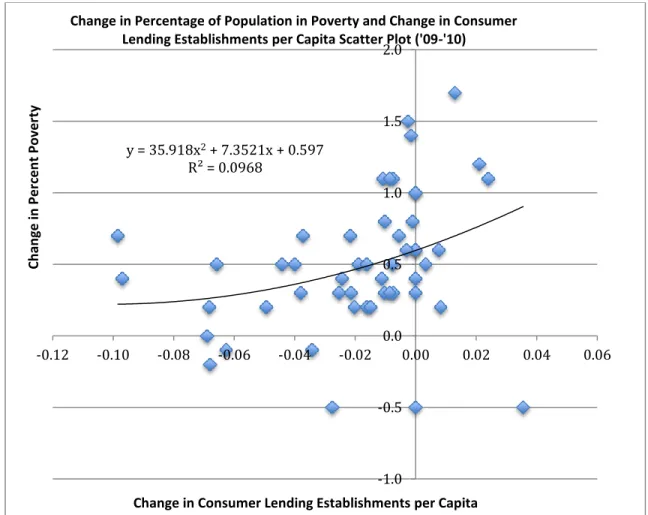
In the ∆Poverty Rate regression, the variable ∆NumEstbl is statistically significant for the periods '09-'10 and '10-'11, which occur shortly after the Great Recession of 2008. The positive coefficient for ∆NumEstbl indicates that in these periods, on average, in two periods, the percentage of people living in poverty fell in states where the number of establishments per capita fell, and in states where the number of establishments per capita increased , the percentage of people living in poverty also fell. The percentage of people living in poverty has increased. The coefficients of the two time periods have opposite signs, yielding mixed results as to how.
This relationship between the change in the poverty rate and the change in the number of consumer lending institutions is further illustrated in Figure 4. This supports the theory that consumer credit can have a net negative effect on consumers' financial well-being. If these three outliers are removed, the strength of the relationship between change in enterprise and change in the poverty rate increases greatly.
If so, areas hit hardest by the recession (resulting in less high interest loans). Change in percentage of population in poverty and change in consumer lending institutions per capita distribution plot. Change in consumer lending institutions per capita Change in percentage of population in poverty and change in consumer.
County-Level Results
The regressions use two measures of change in consumer welfare as dependent variables: the change in average household income (ΔMedian Income) and the change in poverty rate (ΔPoverty Rate). Again, the change in enterprises per capita (∆NumEstbl) is the main independent variable of interest. There are three control variables: the change in the unemployment rate (∆Unempl), the change in the percentage of the population that has a college education or higher (∆PctColl), and the change in the percentage of the population that is white.
A negative ∆NumEstbl coefficient in a ∆Poverty Rate regression indicates that consumer loans correspond to a lower poverty rate, which has a positive effect on the economy. This could happen if consumer lending provides an essential service to people who need credit. In areas where consumer loans became less available, county poverty is more likely to increase.
A positive coefficient ∆NumEstbl in a regression of the ΔPoverty rate indicates that consumer lending corresponds to higher poverty rates, a negative effect on the economy. In Figure 3 above, Florida has the fewest number of consumer lending companies, and this number has steadily declined since 2008. In 2009-10 and 2010-11 there is evidence that in Florida counties where companies decreased, the poverty rate decreased.
Louisiana and Tennessee have similar patterns in the number of businesses (Figure 3 above), and they also have usury laws that support consumer lending institutions. In '11-'12, Tennessee enrollment increased in 54 out of 59 counties, and the poverty rate decreased in 30 of those 54 counties. This supports the theory that consumer lending institutions are correlated with negative effects on consumers' financial well-being.
Limitations of the Study
Conclusion
Again, the results suggest that changes in bankruptcy rates are either a poor indicator of financial well-being, or changes in bankruptcy rates are unaffected by changes in per capita consumer lending institutions. Both the state-level and county-level regressions found evidence of a relationship between change in the number of consumer lending institutions and change in the poverty rate. Negative coefficients on the change in the number of consumer loan institutions and change in poverty rate regression may be the result of economic forces from the recession that forced consumer loan firms to close and drive up poverty rates.
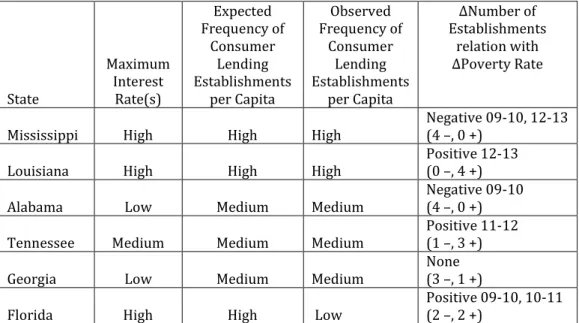
The states with negative coefficients (Alabama and Mississippi) have medium and high expected frequencies and observed frequencies of consumer lending institutions per capita, respectively. This suggests that consumer lending laws may have created a lending environment that was economically beneficial to consumers. Frequency and observed frequency of consumer lending institutions per capita, and ∆Number of enterprises relation to ∆Poverty rate.
The states with positive coefficients (Louisiana, Tennessee and Florida) have respectively high, medium and low observed frequency of consumer loans per inhabitant. Lawmakers and consumers should be aware that some states, such as Florida, may benefit from increasing the number of consumer lending institutions per capita. population is falling. There are few statistically significant correlations, but states like Louisiana and Tennessee may benefit from regulation that resulted in fewer consumer lending institutions per capita.
On the other hand, Mississippi and Alabama could benefit from the frequency of consumer lending. Consumer loans can provide borrowers with an essential line of credit that keeps consumers out of financial distress, especially in post-recession periods. Retrieved from https://www.census.gov/did/www/saipe/data/statecounty/data/index.ht ml.
Retrieved from http://factfinder.census.gov/faces/tableservices/jsf/pages/productview.xht ml?pid=PEP_2013_PEPANNRES&src=pt. GDP and personal income, annual gross domestic product (GDP) by country, real GDP per capita.