I want to thank Matt for all the help in the KNI and for the advice on how to become a better microscopist and scientist. I also want to thank Neal, Ryan, Kai and Viki, in addition to the rest of the Greer group members, for all the great conversations about science and life.
LIST OF TABLES
INTRODUCTION
- Brief History of Li-ion Batteries
- Li-ion Battery Operation
- Li Metal Solid-State Batteries
- Small-Scale Plasticity
- Thesis Overview
LiCoO2−xe−−xLi+ =Li1−xCoO2 (1.2) During charging, Li ions are driven by an external energy source from LCO through the electrolyte and intercalated into the graphene sheets of the anode. Finally, the last chapter will give a summary of the thesis and a view of the field in the future.
![Figure 1.1: Schematic of the components of a Li-ion battery adapted from Reference [15].](https://thumb-ap.123doks.com/thumbv2/123dok/10412551.0/14.918.254.664.105.427/figure-schematic-components-li-ion-battery-adapted-reference.webp)
ELECTROCHEMICAL AND MECHANICAL EXPERIMENTS PERFORMED IN THE SEM
- Solid-State Li Metal Batteries
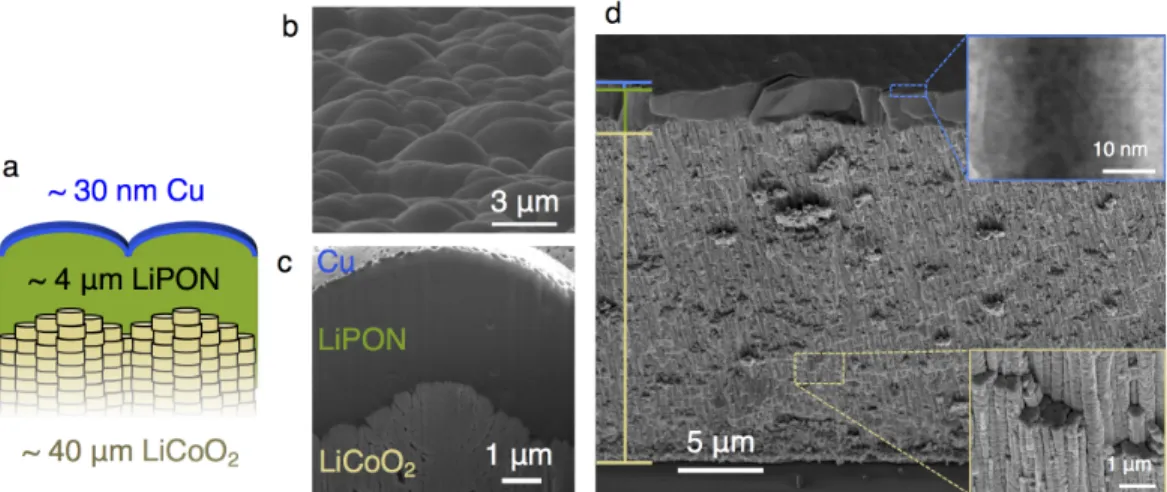
- Thin Film Solid-State Battery for In-situ SEM Experiments
- In-situ Uniaxial Compression
- Introduction-Li-free Cells
- Li Electrodeposition
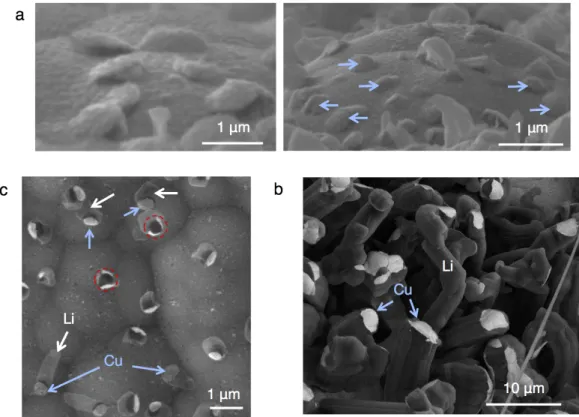
- Preferential Li Formation at Domain Boundaries
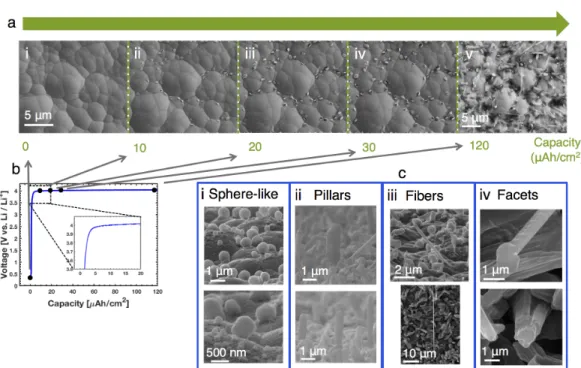
- Li Morphologies
- Conclusions
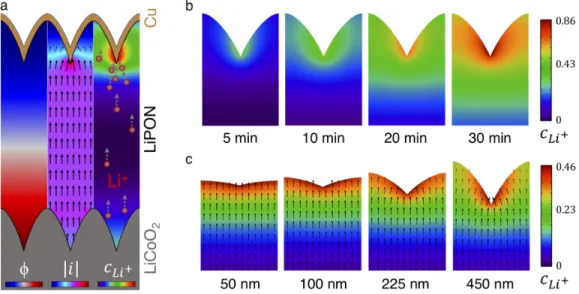
The open circuit voltage (OCV) is the voltage of the cell under no applied current. In the red areas, the Li morphology is more uniform / spherical, and the density of Li deposits is greater, both due to the effects of the surface topography.
MICROSTRUCTURE OF LI ELECTRODEPOSITED FROM A SOLID ELECTROLYTE
- Challenges Performing TEM Analysis on Li
- In-situ TEM
- Cryo-EM
- Microstructure of Electrodeposited Li via Cryo-EM
- Summary and Conclusions
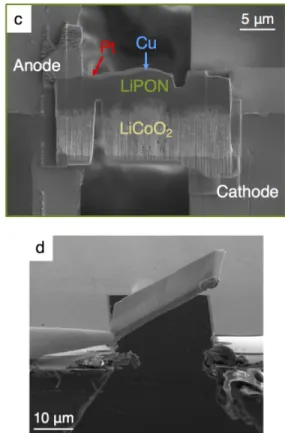
Next, a thin cross-section of the battery (IBID Pt/Cu/LiPON/LCO) was milled with a Ga+ ion FIB (30 kV unless otherwise noted) to about 25 µm wide and 14 µm deep and removed by using a nanoprobe (Omniprobe). The entire length of the sample was thinned/cleaned after bonding to the E-chip to help prevent shortening from redepositing material from previous, larger FIB cuts. The cell was broken with a razor blade in the glove box, and the remaining part of the cell was attached to the end of a SEM stub and placed vertically at a 90°.
The samples were therefore partially attached over the edge of the sample above the electrodes, and IBID Pt lines were used to connect the Au electrodes to the Cu/Pt and LCO. Some of the sample must be outside the edge of the E-chip to allow some Li to grow above vacuum in the TEM. Ag epoxy is applied to Cu tape attached to the top of the cell to make electrical connection.
The top of the cell is electrically bonded to the vessel with Ag epoxy to dampen movement in the SEM/FIB. This SAED pattern in Figure 4.6(b) corresponds to a body-centered cubic (bcc) crystal structure with a [311] zone axis (see the standard diffraction pattern overlaid in black); The experimental and standard models are in good agreement, with a slight discrepancy attributed to small discrepancies from the exact Bragg state.
MECHANICAL PROPERTIES OF LI ELECTRODEPOSITED THROUGH A SOLID ELECTROLYTE
- Young’s Modulus and Strength
- Mechanical Response in Context
- Possible Strengthening Mechanisms
- Implications for Solid-State Batteries
- Conclusions
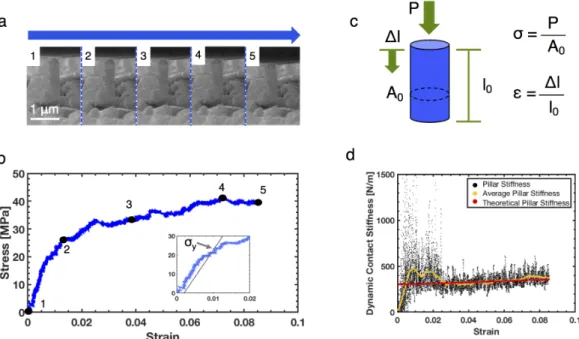
Lp is calculated from the CSM data of the pole with an initial length of L0 and. To calculate the theoretical dynamic stiffness of the column, a similar approach is taken in reverse, with modulus as input and dynamic stiffness as output. Due to the large noise in the CSM data, an appropriate part of the dynamic stiffness must be selected for the calculation of the elastic modulus.
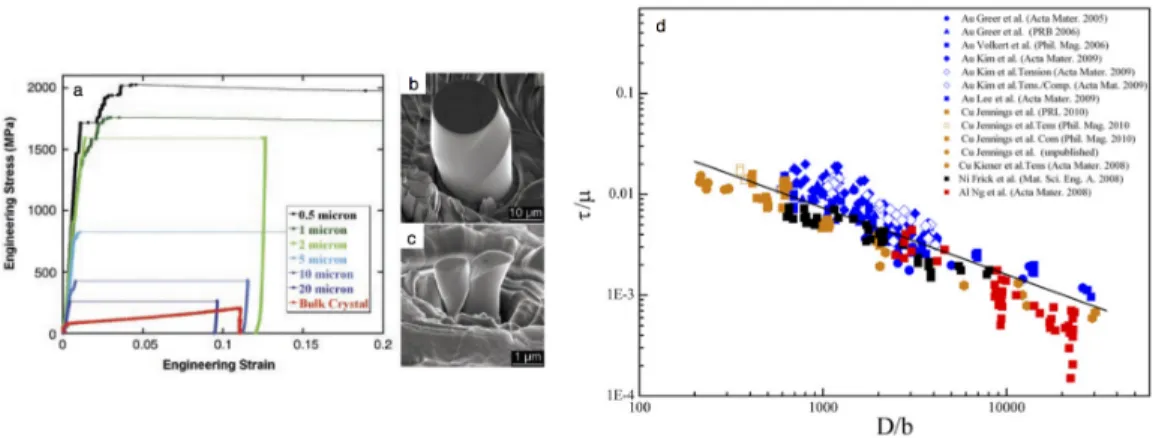
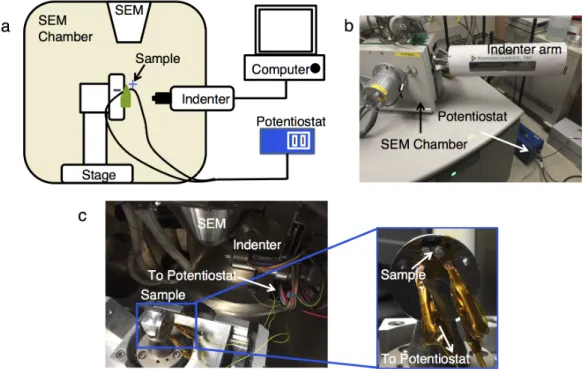
In addition to these load fluctuations in the post-yield, the general signature of the mechanical behavior, as well as the elastic modulus and the yield. The indenter tip hits a thin Li fiber at an angle, indicated by the green box to the left of the indenter tip. 7 places the yield stresses of the single crystalline electrolytically deposited Li-nano pillars in the strength vs.
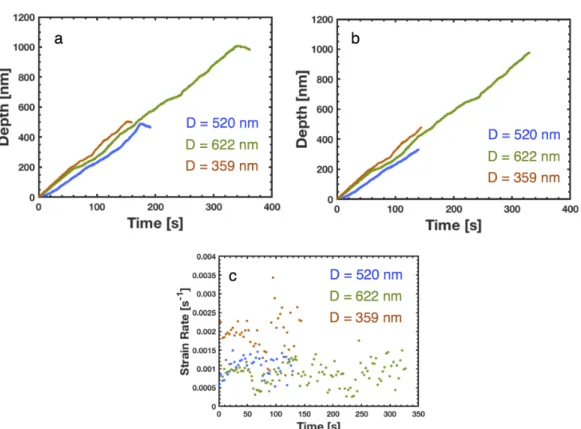
In this nucleation-driven regime, there is a strong temperature dependence, TlnT, of the nucleation stress. Nanoindentation in evaporated Li films was performed at strain rates from PÛ/P = 0.05 s−1 to 1 s−1, in addition to 12.5 µN/s; the maximum hardness revealed during indentation increased with strain rate, from 40 to 90 MPa [64, 65].
3D ARCHITECTED LI-ION CATHODES
Three-Dimensional Batteries
By intelligently using the electrode height, the mass loading can be increased while maintaining the short transport lengths of lithium ions and electrons [129, 130]. 3D electrodes are usually measured by their surface capacity (mAh/cm2), which can be improved by increasing the mass loading using electrode height [130]. These structures can increase the mechanical stability of the thin active material [141] and increase the surface area capacity of the thin film [139], but they require high aspect ratios to greatly reduce the diffusion paths of lithium ions, which limits their height, as the structures often collapse or solidify when are too high [41].
While many pseudo-3D and 3D electrodes can perform well in a liquid electrolyte by simply replacing a planar electrode, different electrode configurations must be used to reap the benefits of 3D batteries with a full solid-state cell (anode, electrolyte, and cathode ) to exploit. [130]. One of the most common electrode configurations is to use interdigital electrodes, which reduces the diffusion path between electrodes [146–148]. A single active material thickness and pore size is usually required to optimize the energy and power density of a cell, and a stochastic material will contain deviations from the optimum thickness and/or pore size [41, 151].
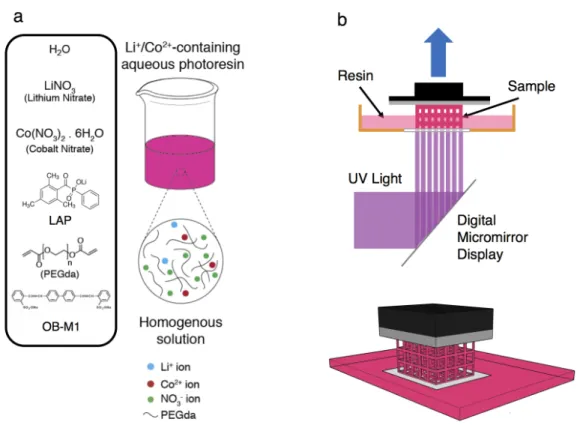
One of the biggest challenges for 3D printing LIB electrodes is the difficulty in printing non-polymeric materials commonly used in LIBs [165]. The use of a solid electrolyte with a 3D electrode is beyond the scope of this work, so a conventional liquid electrolyte was used to investigate the electrochemical performance of the networks.
Fabrication of 3D Architected LCO Electrodes
In this range, in addition to thermal decomposition, combustion of the nitrate salts and PEGda also took place. The water content in the printed structures gradually evaporated, causing the size of the structures to fluctuate due to the time between printing and calcining. The ordered pattern on the surface of the gratings likely results from the projector's pixels.
These cracks were more common when the thermal ramp rate of the calcination process was relatively high (1 °C / min). A high magnification image of the particle microstructure in the node crack. e) FIB cross-section image of the particles microstructure in the interior of an intact node. f) The side of a beam revealing the layers of the print, which can also be seen in the FIB cross-section (g). The layers of the printing process were also visible on the sides of the beams, seen in Figure 6.4(f).
The calcination reduced the mass of the grid to an average of 5.44% of the original mass. The shrinkage in height of about 35% is less than that of the other linear dimensions.
Materials Characterization of LCO Structures
The strength of brittle materials is largely controlled by the flaw size and population inherent in the material as a result of its processing, with the stress to propagate a crack proportional to 1/√. The large pores and defects in the grids will contribute to their low toughness by significantly reducing the stress needed to propagate cracks to break the structure. Co3+ ions lie in the center of O2− octahedra and the gray box outlines a unit cell.
The peaks in the CVs performed on sludge electrodes from LCO grids are practically identical to the peaks observed in the literature [181, 182]. The closer data points below 3.6 V on the anodic scan of the first cycle is due to a different data acquisition rate. The peaks in the second cycle were only 11 mV different on average compared to the first cycle, illustrating the reversibility of Li-ion intercalation and deintercalation in the fabricated LCO.
This peak is likely due to an impurity in the LCO material or in another part of the cell, such as the electrolyte, because LCO is not electrochemically active in this range [181]. The current decay between cycles is indicative of the irreversibility of this peak and the small currents suggest that the peak is due to a low impurity concentration.
![Figure 6.6: (a) XRD spectrum from a pulverized LCO lattice and reference spectrum taken from Reference [177]](https://thumb-ap.123doks.com/thumbv2/123dok/10412551.0/76.918.172.752.110.521/figure-spectrum-pulverized-lattice-reference-spectrum-taken-reference.webp)
Electrochemical Performance of 3D LCO Electrodes
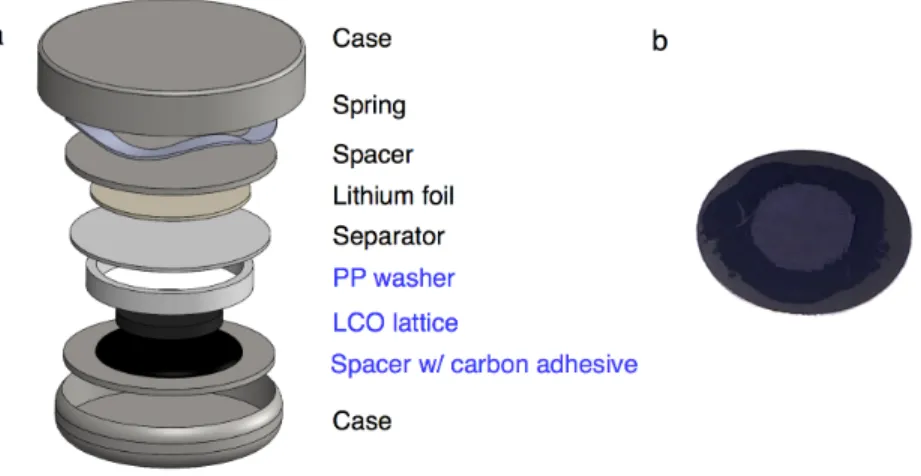
This highlights the reactivity of the cell environment and the importance of a conductive adhesive that is stable during cycling. The LCO grid was then carefully placed in the middle of the glue and the whole stack was dried for 4 hours at 35 °C (Figure 6.8(b)). The rings are placed around the LCO structure to support the tension of the coin cell spring.
In addition, the 10 wt% C conductive additive improves the high-speed performance of the slurry electrodes. The lower specific capacity of the slurry is surprising, as it should be comparable to that of the grid. The initial surface discharge capacity of the grids at C/40 is 7.6 mAh/cm2, ∼2 times larger than conventional slurry electrodes.
The concentration of salts could be optimized to control the dissolution and porosity of the structure. The voltage profile of the NCA gratings, measured by cycling at C/40 and C/20 between 3 and 4.3 V, is shown in Figure 6.12(c), which reveals a voltage slope with a sharp drop-3.4 V at discharge and a first discharge specific capacity of 135 mAh/g.
Conclusions
THESIS SUMMARY AND OUTLOOK
In-situ charge experiments in the SEM chamber enabled the transfer of Li to the SEM without air exposure. A small percentage of Li deposits grew into columnar morphologies and orientations favorable for performing uniaxial compression experiments. Another way to improve the performance of Li-based batteries is to use 3D battery electrodes to provide high energy and power.
New experiments have been conducted to characterize the properties of Li metal produced by methods that are very relevant to Li battery operating conditions. This thesis also highlights the importance of size and fabrication conditions on the mechanical properties of Li. Hopefully, the high Li strengths measured in a commercial thin-film semiconductor battery can help researchers design solid electrolytes that can more effectively control mechanical degradation.
Interest in Li mechanics has only recently emerged, and thus many questions remain, such as the effects of battery cycling under different conditions on the mechanical response of Li. Ultimately, in the future, some of the techniques and properties discussed here may be used to produce 3D, all solid-state Li-metal batteries.
Huang, “Lithium fiber growth on the anode of a nanowire lithium ion battery during charging,” Appl. Nan, “Direct observation of lithium dendrites inside garnet-type lithium-ion solid electrolyte,” Electrochem. Huang, “Three-dimensional Ni/SnO x/C hybrid nanostructured arrays for lithium-ion microbattery anodes with improved areal capacity,” ACS Appl.
King, “High-performance lithium-ion microbatteries from interdigital three-dimensional bicontinuous nanoporous electrodes,” Nat. Stein, “Synthesis and performance of monolithic macroporous carbon electrodes for lithium-ion secondary batteries,” Adv. Panat, “3D Printed Hierarchical-Porous Microarray Electrode Materials for Lithium-Ion Batteries with Extremely High Specific Capacity and Surface Capacitance,” Addit.
Amine, "3D-printed cathodes of LiMn1-xFexPO4 nanocrystals achieve both ultra-high speed and high capacity for advanced lithium-ion battery," Adv. Wiley, “Three-dimensional printing of a complete lithium-ion battery with fused filament fabrication,” ACS Appl.