The Factors Impact On Earnings Management On Indonesia Mining Company
Martinus Robert Hutauruk1*, Agus Riyanto2 , and Greacela Utami Putri3
1,2,3
Faculty of Economics, Widya Gama Mahakam University, Samarinda, Indonesia
Email Address:
[email protected]*, [email protected], [email protected]
*Corresponding author
Abstract: This purpose of this research to analyze the impact of size, age, profitability, and leverage on earnings management of the company. The data sampling was selected using a purposive sampling technique to obtain 20 mining companies listed on the Indonesia Stock Exchange IDX that can meet the criteria. The analysis in this study was binary logistic regression analysis through SPSS 26. The analysis found that firm size insignificant effect on earnings management. Company age has a negative and significant impact, profitability has no significant effect, and leverage insignificant effect on firm earnings management.
Keywords: Company Size; Company Age; Profitability; Leverage; Earnings Management.
Abstrak: Tujuan penelitian ini adalah menganalisis dampak ukuran umur, profitabilitas serta leverage terhadap manajemen laba perusahaan. Pengambilan data sampel adalah menggunakan teknik purposive sampling, dan diperoleh 20 perusahaan pertambangan yang listing di Bursa Efek Indonesia BEI serta memenuhi kriteria. Analisis pada studi ini adalah dengan analisis regresi logistik biner melalui SPSS 26. Hasil analisis menemukan bahwa ukuran tidak berdampak signifikan, umur berdampak negatif namun signifikan, profitabilitas tidak berdampak signifikan, dan leverage tidak berdampak signifikan terhadap manajemen laba perusahaan.
Kata Kunci: Ukuran Perusahaan; Usia Perusahaan; Profitabilitas; Leverage; Manajemen Laba.
INTRODUCTION
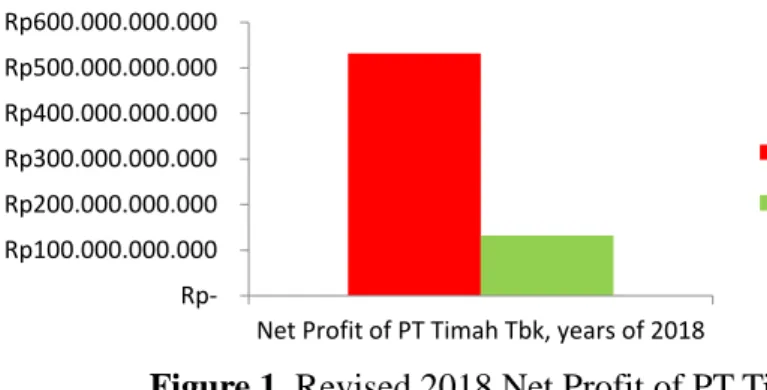
The earnings management phenomenon occurred in the case of PT Timah Tbk, where an error occurred in the recording of PT Timah Tbk's financial statements for the period 2018. The management of PT Timah Tbk reported a net profit of Rp 531.35 billion, even though the actual profit was only Rp. 132.29 Billion. There was a mark up of Rp.
399.06 billion. This case arises because the management of the company did not record the cost of goods sold for the sale of tin metal of Rp 640 billion. Under-recording the balance of Investment properties of Rp. 199 billion and over recording of fixed assets of Rp. 25 billion. Inaccurate method of recognizing income from the sale of house buildings,
uncollectible prepaid taxes, as well as transactions between companies in one group and so on (Jatmiko, 2020).
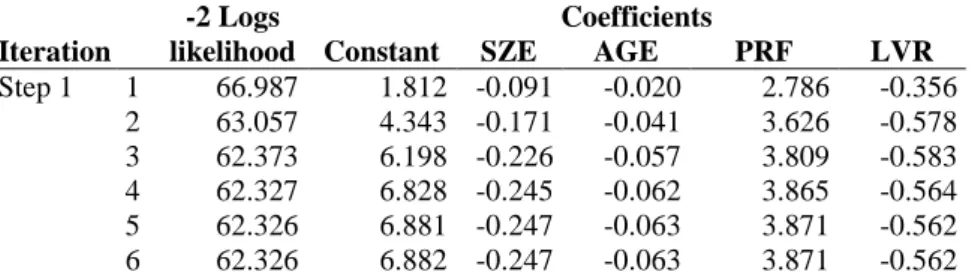
Figure 1. Revised 2018 Net Profit of PT Timah Tbk Source: The Company Financial Statements Listed on IDX, 2022, Jakarta
Based on the graph, the net profit at PT Timah before being revised was Rp.
531,350,000,000. After that, it was revised and the value became Rp.132.290 million, then there was a mark up of Rp.399.060.000.000. From the graph above, it can be seen that this case is included in the type of income maximization model of earnings management. The company's management strives to maximize revenue when profits decline by making the profit in the current period's financial statements higher than the actual profit. The goal is to get bigger bonuses, increase profits and to avoid breaches of long-term debt contracts (Scott, 2015). Another case occurred at PT Bumi Resources, where based on the investigation results from the audit team, it was stated that there was a financial diversion of US$500 million. It was also found that the company's profit had increased for five periods, with high profits the company should be able to increase its share price and vice versa, however, in fact in 2004 to 2005 the company experienced an increase in net profit from 1,079,520 to 1,222,099 and the price increased from 1,079,520 to 1,222,099 its shares decreased from 800 to 760, while in 2009 and 2011 the company experienced a decrease in profit, but its share price increased. Imbalances can occur due to earnings management actions with a pattern of maximizing revenue and minimizing income made by the management for their and company interests (Mariana, 2012).
The case of earnings management actions that have occurred at PT Grada Tujuh Buana Tbk (GTBO) also shows indications of fraud in the financial statements resulting in the falsification of financial statements for the period 2012. As of March 2013, PT Garda Tujuh Buana Tbk experienced a decrease in the percentage of sales by 78.75%, starting from Rp. 124.10 billion from the previous year to Rp. 26.37 billion. There was a decrease in the cost of goods sold from the previous cost of goods sold of Rp 61.85 billion, down to Rp 40.02 6 Billion and the previous year's gross profit of Rp 62.25 billion became a gross loss of Rp 13.64 billion. In addition, the income earned from the exchange rate difference is Rp. 2.73 billion, but the general and administrative expenses have increased to Rp. 7.75 billion. The previous year the company earned a profit before tax of 58.10 billion, and the following year the company experienced a loss before tax of Rp. 18.67 billion.
Meanwhile, the previous net profit per share was Rp 23.24, to a loss per share of Rp 7.47.
This problem arose because there was no acknowledgment of the cancellation of the marketing rights agreement contract with Agrocom amounting to 10 million metric tons of coal with a contract value of US$250 million and including the acknowledgment of the
Rp- Rp100.000.000.000 Rp200.000.000.000 Rp300.000.000.000 Rp400.000.000.000 Rp500.000.000.000 Rp600.000.000.000
Net Profit of PT Timah Tbk, years of 2018
Net profit before revision Net profit after revision
sale of marketing rights amounting to Rp 711.5 billion by PT Grada Tujuh Buana (Nabhani, 2013). Based on this case, the practice of earnings management has been carried out at the company PT Garda Tujuh Buana Tbk with a pattern of maximizing revenue.
Earnings management practices have also occurred at PT Ancora Minning Service (AMS); in 2011, the Community Care Forum for Justice (FMPK) reported allegations of fraud in financial statements to the General Taxes Directorate (DGT) of the Finance Ministry. Mustopo, as the head of the FMPK investigation section, informed that there were indications of fraud in terms of the income of Rp. 34.9 billion. However, there was no investment activity. Moreover, there is also payments interest evidence of Rp. 18 billion although PT Ancora Minning Service (AMS) admits it has no debt. As well as evidence of receivables amounting to Rp 5.3 billion by FMPK; however, there is no clarity on the transaction (www.republika.co.id, 2022). Based on the phenomena or cases that have happened to PT Timah, PT Bumi Resources, PT Grada Tujuh Buana, and PT Ancora Minning Service (AMS) it can be assumed that earnings management practices have been practiced in mining companies. Many manage the company, one of which is the manager manipulating the amount of profit contained in the financial report so that the firm can show good performance for shareholders, resulting in parallel losses for the company itself and also other parties such as external auditors, investors, and the government as regulator (Puspita, 2019). Four factors can affect earnings management: company size, company age, profitability, and leverage (Agustia and Suryani, 2018). Company size is a company scale or benchmark that can be seen and differentiated based on total assets, total sales, and share value (Widiastari and Yasa, 2018). The size of the company can affect earnings management and can be seen from the more significant the assets, the number of sales, and the value of the shares, the larger the company's size (Nisa, 2019). Previous research has been carried out by (Khuriyati, 2018) and (Puspita, 2019), where the results of the research say that company size has a positive impact on earnings management, and the differences in research conducted by (Agustia and Suryani, 2018), which eight research results say company size have not to affect earnings management.
The company's age is the time that shows from the beginning of the company's establishment to an unlimited time (Agustia and Suryani, 2018). The age of the company shows how long the company can survive and be able to compete in the economy. The company's age is very influential on earnings management because this is one part that investors need to look at when evaluating a company before deciding to invest their capital. In general, companies that have been around for a long time have more stable profits than companies that have just been established (Fahad Fajari, 2019). Previous research has been conducted by (Puspita, 2019) and (Agustia and Suryani, 2018), where the research results say that company age has a positive effect on earnings management, and research conducted by (Indracahya and Dewi, 2017) is different, where the results of the study say that age the company does not affect earnings management.
The ratio of profitability shows the firm's ability to produce profits for a certain period, and with a higher company profitability value, the company will experience an increase in performance and ability to generate profits (Agustia and Suryani, 2018).
Profitability influences earnings management because profitability is essential to the company's external parties. Where if the company has a high profitability value, of course, the company is assumed to be a company that has good performance, and if the company has a low profitability value, the company is assumed to be a company that has good
performance have poor performance so that profitability can affect earnings management (Nisa, 2019). Previous research has been conducted by (Lestari and Wulandari, 2019), where the research results say that profitability has a positive influence to earnings management, and the differences in study conducted by (Agustia and Suryani, 2018), where the results of the study say that profitability has no effect on earnings management.
Leverage is a ratio measurement used to measure how much assets are financed with debt (Fahmi, 2013). Leverage affects earnings management; this is because, in companies that have a high level of leverage, of course, managers will carry out earnings management by increasing the amount of profit so that it can attract investors' attention to show that the company has an effective and efficient performance, even though the actual condition of the company has high risk because the debt is large (Alfira, 2014). Empirical studies by (Agustia and Suryani, 2018) and (Khuriyati, 2018) find that leverage has a positive impact on earnings management, and it is different from (Nisa's, 2019), where the results of his research say that leverage does not affect earnings management. Based on research by (Agustia and Suryani, 2018), which aims to review the variables that affect earnings management because there are differences in research results (research gaps) from previous studies. The four variables used in this study are firm size, firm age, profitability, and leverage. The sample used in this study is mining companies listed on the IDX for 2018-2021.
THEORETICAL REVIEW
The Agency Theory. The theory of agency has explained the connection between two or more company owners and management, where company owners give trust to the duties and responsibilities of management, one of which is making decisions for the progress of the company. Agency theory first emerged because of the control and separation within the company, resulting in conflicts between management and company owners (Menz et al., 2021).
Positive Accounting Theory. Positive accounting theory explains that there are 3 things that become the hypothesis of earnings management actions, namely the first hypothesis that the bonus plan (reward) is an action taken by managers in choosing accounting procedures with the aim that managers can obtain maximum compensation. The two hypotheses of debt covenants are an attempt by a manager to increase the value of earnings. The goal is that the company can reduce contractual violations of debt agreements. The three political cost hypotheses are an attempt by a manager where the manager chooses an accounting method by reducing the amount of profit in order to avoid paying high taxes (Saragih et al., 2021).
The Earnings Management. Management of earning is a manager's effort to be able to choose accounting procedures to maximize company income or increase company welfare (Scott, 2015). Earnings management is the participation of managers in compiling financial information to be presented to parties outside the company, with the aim of obtaining personal gain (Kuang et al., 2015). It can be seen that earnings management is carried out in order to achieve various goals both for the company and for personal gain.
Company Size. The company size is an indicator to assess the performance of company for investors in the company (Kusumawardhani, 2012). The greater the number of a company's assets, sales, and value will also increasingly determine the intention of investors to invest in the shares of the company concerned.
Company Age. Company age is defined as the age calculated from the time the company was founded until it was able to run the business consistently. (Hoirul Fayyum, and Rustiana, 2019); (Indriani and Juniarti, 2020). For companies that have reached a long age, they will certainly gain the trust of parties outside the company, both investors, creditors and parties outside the company (Andries, 2017).
Profitability. Profitability is a value to identify the company's ability to generate maximum profits. In addition, profitability also shows the effectiveness of a manager in the company (Agustia and Suryani, 2018).
Leverage. Leverage is a financial ratio to identify how much the firm is financed with external capital or debt (Kustiyaningrum et al., 2016). The use of high debt certainly has a negative impact on the company. The company has a high debt burden and is included in the extreme debt category, which is struggling to reduce its debt burden. Therefore, the company needs to estimate how much debt will be used and pay attention to the sources included in the debt (Astuti et al., 2017).
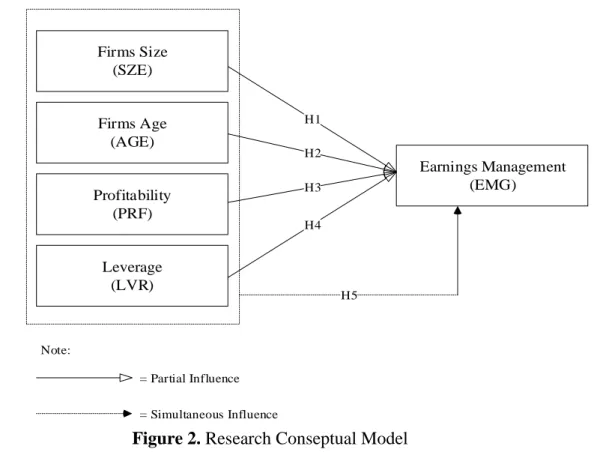
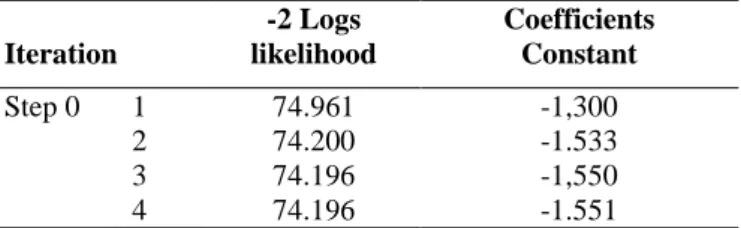
Conceptual Model
The conceptual research framework can describe in Figure 1 as follows:
Firms Size (SZE)
Firms Age (AGE)
Profitability (PRF)
Leverage (LVR)
Earnings Management (EMG)
H2 H3 H4 H1
H5
= Partial Influence
= Simultaneous Influence Note:
Figure 2. Research Conseptual Model
Impact of Company Size on Earnings Management. Company size is a measured by classify companies into large, medium, and small scales. Firm size affects earnings management, and when the number of assets, income, and market capitalization is large, the company is said to be a large company (Nisa, 2019). The large companies will undoubtedly get more attention from the outside, so companies will be more enthusiastic in preparing financial statements and explaining the company's conditions in more detail (Andries, 2017). Based on surveys (Rice, 2016), and (Puspita, 2019), where the size of company to affect earnings management.
H1: The Company Size Impact on Earnings Management.
Impact of Firms Age on Earnings Management. The age of the firms explains how the company continues to provide the best and proves that the company is able to compete and can take advantage of business opportunities that exist in the business world (Agustia and Suryani, 2018). The companies that have been in the business world for a long time will certainly gain the trust of the outside world. The company works well through operational management to gain the trust of outsiders, especially investors. However, due to the lack of attention to detail from outsiders, managers are free to apply yield management to attract investors' attention in order to improve their performance (Andries, 2017).
H2: The Firm Age Impact on Earnings Management.
Impact of of Profitability on Earnings Management. Profitability is an important factor in determining whether or not a company is healthy (Puspita, 2019). Profitability is an indicator that measures the ability of company to generate profits with the support of its assets, because the larger the size of the company's assets, the greater the potential profit that will be generated (Aprina and Khairunnisa, 2015). It is a commonplace that the greater the profit generated by a company, the greater the realization of earnings management practices in the company. This is because the more profitable a company is, the better the company's ability and performance to generate high profits (Ulya and Khairunnisa, 2015).
H3: The Profitability Impact on Earnings Management.
The Influence of Leverage on Earnings Management. Leverage is the company's funding of equity and debt and can be calculated based on the relative size of different sources (Subramanyam and Wild, 2014). The debt contract hypothesis explains that when things change and a company's debt payment date approaches, managers pass next year's earnings into the current period and choose accounting policies. This is to ensure that the company does not neglect to pay. Future debt (Andries, 2017).
H4: The Leverage Impact on Earnings Management.
The influence of firm size, firm age, profitability, and leverage simultaneously on Earnings Management. The fifth hypothesis is a claim or tentative answer related to the relationship between independent variables such as firm size, firm age and profitability as
well as the dependent variable, namely earnings management simultaneously (Agustia and Suryani, 2018), (Millenia and Jin, 2021).
H5: Firm Size, Firm Age, Profitability and Leverage as Simultaneously Affect on Earnings Management.
METHODS
The research type is a quantitative, and the data used is in the form of secondary data obtained from the annual reports of mining companies listed on the Indonesia Stock Exchange by accessing the website www.IDX.co.id. The population is all mining companies listed on the Indonesia Stock Exchange during the 2018-2021 period, or there are as many as 48 companies. The sampling technique uses purposive sampling, i.e., the sampling determining by using predetermined characteristics. After applying these criteria steps to the population in this study, the following is a description of the number of companies that do not meet the requirements, along with the elimination of the population:
Table 1. The Sampling Technique
Criteria Total
The mining companies listed on the Indonesia Stock Exchange during 2018, 2019, 2020 and 2021
48 Companies that do not present financial report during 2018, 2019, 2020 and 2021 (20) Companies that have experienced losses in 2018, 2019, 2020 and 2021 (8) The number of samples selected according to the sample selection criteria
Year of observation
Total data observation = 20 x 4 =
20 4 80
Variables and Variable Operational Definitions
The Size of Company. The size is measured using a ratio scale by calculating the natural logarithm of total assets (Febriyanti and Yahya, 2021), here is the company size formula:
………………... (1) Information: Company Size Formula; Ln = Natural Logarithm; Total Assets = Total Company Assets as a Whole.
Company Age. In this study, the age of the company measuring by using a ratio scale by calculating the difference between the research year and the year the company was founded (Agustia and Suryani, 2018), expressed by the following formula:
…………...(2)
Information: Company Age Formula; Research Year = Research year period; The year the company was founded = Period The year the company was founded
Profitability. Profitability is measured using a ratio scale, and the calculation is carried
out through the distribution of net income to the company's total assets using the formula (Hery, 2016). The calculation formula is as follows:
………………... (3)
Information: ROA = Return on Assets; Net Income = Net Profit; Total Assets = Firms assets as a whole
Leverage. The leverage, in this case, is measured using a ratio scale, namely the ratio between total liabilities to total assets using the formula (Azlina, 2010) as follows:
……………….……...………... (4)
Information: DAR = Debt to total asset ratio; Total Liabilities = Shorterm and Longterm Liabilities; Total Assets = Total Existing Assets at The Firm
Management of Earnings. The management of earnings is measured using earnings management measurements from the modified Jones model (Dechow et al., 1995) through several calculation stages, namely:
Total accruals(TAC):
………...……….………(5)
.
Total accruals estimated with the OLS (Ordinary Least Square) regression equation:
………...………(6)
Nondiscretionary Accruals(NDA):
………....………….(7)
Discretionary accruals (DA)
:
………....………(8)
Information:
NIit = net profit in the current year period;
CFOit = Operating activities cash flow from in the current year period;
TACit = total accruals in the current year period;
DACit = discretionary accruals in the current year period;
NDAit = non-discretionary accruals in the current year period;
Ait-1 = The company total assets in the previous year;
REVit = the difference between the company's current year's revenue and the company's revenue the previous year;
RECit = the difference between the company's trade receivables in the current and the trade receivables the previous year;
PPEit = amount of fixed assets in the current year period;
1 2 3 = regression coefficient;
= error
After calculating through several calculation stages above, then use the earnings management criteria calculation results: (a) If the value of discretionary accruals produces a positive value, then the company is considered to be doing earnings management; and (b) If the value of discretionary accruals produces a negative value, then the company is considered not to do earnings management (Paulo and Martins, 2012). The calculation of earnings management in this study uses a dummy variable measurement scale or a dichotomous scale as follows: 1 = Do eraning management; and 0 = do not earning management.
Data analysis technique. This reserach uses data analysis techniques with binary logistic regression. The use of this analysis is based on the existence of a dichotomous dependent variable (dummy) scale. In this analysis it is not necessary to use a normal distribution for the independent variables (Ghozali, 2018). The binary logistic regression equation is as follows:
…………...………… (9)
Information:
= Earnings Management (variable dummy) consists of 2 categories,
namely (a) Earnings management value is less than 0.01 then the company does not carry out earnings management and is given a value of 0; and (b) Earnings management value is more than 0.01, then the company carries out earnings management and is given a value of 1.
The next = Constant;
1 2 3 4 = Variable coefficient;
= Company Size;
= Company Age;
= Profitability;
= Leverage;
= Variable error, assuming e = 0.
RESULTS
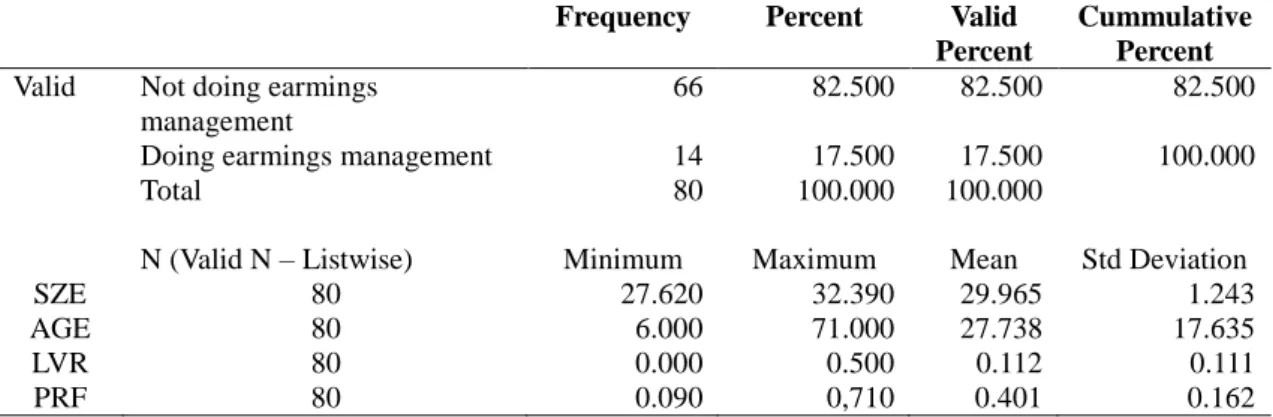
Descriptive Statistics Test. In this study where statistical analysis was carried out to provide an overview (description) variable data used, both independent and dependent variables. The independent variable (independent) consists of company size which is symbolized by SZE, the age of the company is symbolized by AGE, profitability is symbolized by PRF and leverage is symbolized by LVR, in which the four independent
variables can know the mean, minimum, maximum and standard deviation values. As for the dependent variable (dependent), namely earnings management with somlolized EMG, it will be explained with frequency (amount) this is because the data held by earnings management is nominal.
Table 2. Results of Descriptive Statistical Analysis of Earnings Management
Frequency Percent Valid Percent
Cummulative Percent Valid Not doing earmings
management
66 82.500 82.500 82.500
Doing earmings management 14 17.500 17.500 100.000
Total 80 100.000 100.000
N (Valid N – Listwise) Minimum Maximum Mean Std Deviation
SZE 80 27.620 32.390 29.965 1.243
AGE 80 6.000 71.000 27.738 17.635
LVR 80 0.000 0.500 0.112 0.111
PRF 80 0.090 0,710 0.401 0.162
The SPSS output results, shows the descriptive statistical test in table 2 can be concluded that during 2018 to 2021 the dependent variable is earnings management from 20 companies with 80 observational data showing that there are only 14 companies that carry out earnings management and the remaining 66 companies that do not. Perform earnings management. The descriptive statistical test of the independent variable SZE on the Table 2 shows a mean of 29.964, a minimum of 27.620, a maximum of 32.390 with standard deviation of 1.243, and means that the spread of data is considered good by reason of the mean value is greater. Of the standard deviation. This also shows that the minimum value is owned by PT Radiant Utama Interinsco Tbk in 2018. While the maximum value is owned by PT United Tractors Tbk in 2018. Descriptive statistical tests for the company age or AGE indicator shows that the mean value is 27.737 while the standard deviation is 17.634, so it can be concluded the value is greater than the standard deviation, means the data distribution is considered good. The minimum value of 6.000 is owned by PT Merdeka Cooper Gold Tbk in 2018. While the maximum value of 71.000 is owned by PT Bukit Asam Tbk in 2021. The descriptive statistical test of the independent variable LVR shows where the mean value is 0.112 and for the standard deviation value is 0.111, in this case it can be seen that this mean value is greater than the standard deviation.
, so it can be concluded that the distribution of the data is considered good. The minimum value is 0.000, which is owned by PT Darma Henwa Tbk in 2020-2021 and the maximum value is 0.500, which is owned by PT Bayan Resources Tbk in 2021. Then the descriptive statistical test of the independent variable PRF which can be seen from table 6 shows the mean value of leverage is 0.401 and the standard deviation value is 0.162, this shows the value is greater than standard deviation so that it can be concluded the data distribution is considered good. The minimum value is 0.090 which is owned by PT Harum Energy Tbk in 2020 and the maximum value is 0.710 which is owned by PT Astrindo Nusantara Infrastruktur Tbk in 2019-2020.
Hypothesis Testing Results. In this study, the dependent variable is a dichotomous or dummy scale. So that the valid analysis to use is binary logistic regression in hypothesis testing.
Output Binary logistic regression results. In this study, the relationship between the independent and dependent variables was analyzed with binary logistic regression. Thus, in accordance with the provisions in logistic binary regression, there is no need to test the classical assumptions. So, in principle, binary regression analysis has many similarities with multiple linear regression, but the difference lies only in the dependent variable in a dummy.
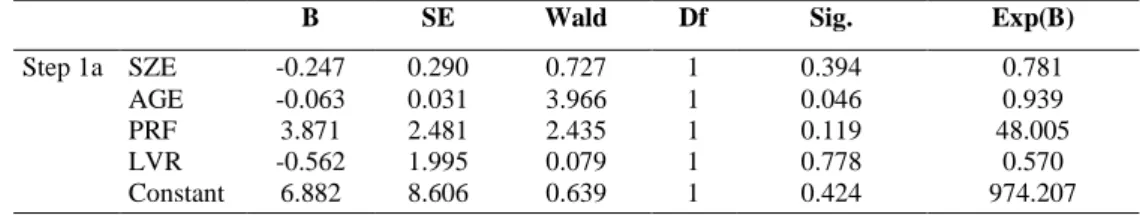
Table 3. Binary Logistics Regression Analysis Results
B SE Wald Df Sig. Exp(B)
Step 1a SZE -0.247 0.290 0.727 1 0.394 0.781
AGE -0.063 0.031 3.966 1 0.046 0.939
PRF 3.871 2.481 2.435 1 0.119 48.005
LVR -0.562 1.995 0.079 1 0.778 0.570
Constant 6.882 8.606 0.639 1 0.424 974.207
From the results of data management through SPSS, a binary logistic regression model can be made as follows:
……..…... (10)
Based on the translation of binary logistic regression results, a logistic regression equation found a constant value of 6.882. Where this value is a constant, which means that if the appointed independent variables are firm size, age, profitability, and leverage, the value is 0, then the value of earnings management is permanent. The regression coefficient of firm size on earnings management is -0.247, so it concluded that every 1 percent increase in firm size would indicate a decrease on earnings management level of 0.247 percent, and there is also a negative relationship between firm size and earnings management. The coefficient of regression resulting the company age in earnings management is -0.063, so it can conclude that every 1 percent increase in the age of the company indicates a decrease in the level of earnings management by 0.063 percent, and there is also a negative relationship between company age and earnings management. The regression coefficient of profitability on earnings management is 3.871. Every 1 percent increase in profitability will indicate an increase in earnings management by 3.871 percent and a positive insignificant relationship between profitability with earnings management.
In the binary logistic regression equation above, the regression coefficient of leverage on earnings management is -0.562, so it concluded that every 1 percent increase in leverage indicates a decrease in earnings management by 0.562 percent and a negative insignificant relationship between leverage to earnings management.
Test Chi Square Hosmer and Lameshows Goodnes. The feasibility test of the model with Hosmer and Leme shows that Chi-Square measured the test of conformity. This model also tests whether there is a match between the empirical data and the model. So it
will be known whether the data has no difference from the model or is classified into the fit category. In this case, it is also determined that if the probability value is above 5 percent, then the model is confirmed to be feasible.
Table 4. Hosmer and Lameshows Goodnes
Step Chi-square df Sig.
1 10.673 8 0.221
From the table above, it shows that this test produces a significant value of 0.221 which is more than five percent, so it can be concluded that the existing research data as many as 80 sample data can be said to be able to predict the observation value and because the model is following the data, or the model can be accepted.
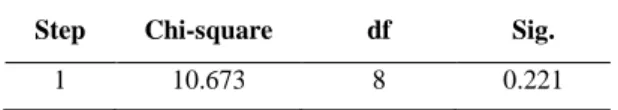
Test Model Fit and Overall Model Fit. Assessment of this analysis is done by comparing the value of the first -2LL with the next -2LL, where if the value of -2LL block number equaly with 0 is greater than the value of -2LL at the end of the block number equalty with 1, it can be concluded that there is a decrease and states that the hypothesized model is fit.
with existing data or a better regression model.
Table 5. A value of -2LL consisting only of Constants
Iteration
-2 Logs likelihood
Coefficients Constant
Step 0 1 74.961 -1,300
2 74.200 -1.533
3 74.196 -1,550
4 74.196 -1.551
Table 5 above to show the value of -2LL which only consists of constants and can to support a good regression model analisys.
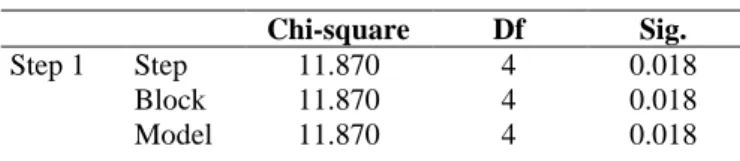
Table 6. The value of -2LL which only consists of Constants and Independent Variables
Iteration
-2 Logs likelihood
Coefficients
Constant SZE AGE PRF LVR
Step 1 1 66.987 1.812 -0.091 -0.020 2.786 -0.356 2 63.057 4.343 -0.171 -0.041 3.626 -0.578 3 62.373 6.198 -0.226 -0.057 3.809 -0.583 4 62.327 6.828 -0.245 -0.062 3.865 -0.564 5 62.326 6.881 -0.247 -0.063 3.871 -0.562 6 62.326 6.882 -0.247 -0.063 3.871 -0.562
While table 6 is the value of -2LL which consists of constants and independent variables. Tables 5 and 6 show that there has been a decrease in the value of -2Log Likelihood. There also shows that the regression model is classified as good or the hypothesized model is fit. Thus, further data can also see through the constant values in
table 5, namely the value of -2LL which only consists of the constant only shows the value constant is 74.196, while table 6, which is the value of -2LL which consists of the constant value and the independent variable (independent) shows a constant value of 62.326 so that it can be concluded that there is a decrease, and there is also a difference between the two values of -2LL of 11.870 which can be seen through the table 7 below.
Table 7. Value Comparison -2LL
Chi-square Df Sig.
Step 1 Step 11.870 4 0.018
Block 11.870 4 0.018
Model 11.870 4 0.018
Table 7 is an illustration that shows the comparison on the value of -2LL which consists of the constant value only with the value of -2LL which consists of the value of the constant and the variable of independent. The comparison or difference is carried out following the chi square distribution so that the chi square value shows a value of 11.870 with a degree of freedom (df) of 4. In addition, table 7 shows a significant value of 0.018, with this it can be seen that simultaneously company size, company age, profitability and leverage affect management of earnings. This is because 0.018 is smaller than five percent, and so this can prove the simultaneous influence of independent variables on the variable of dependent.
Coefficient of the determination (Nagelkerke R Square). This analysis will show how much variability exists in the dependent variable. On the other hand, the value of the coefficient of determination in this logistic regression can also be seen through the Nagelkerke R Square, shown in Table 8 below:
Table 8. Nagelkerke R Square (R2)
Step
-2 Logs likelihood
Cox & Snell R Square
Nagelkerke R Square
1 62.326 0.138 0.228
The Table 8 above, it can see that the value of Nagelkerke R Square is 0.228. These results also show that independent variable can explain dependent variable by 22.800 percent, while remaining 77.200 percent explain by other variables outside this study and error factor.
Classification Matrix. The section will show an overview of the number of opportunities from the regression model to determine how likely it is for mining companies to carry out earnings management.
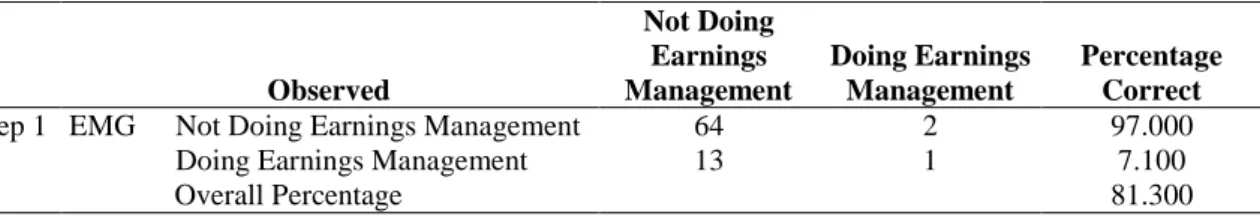
Table 9. Classification Matrix
Observed
Not Doing Earnings Management
Doing Earnings Management
Percentage Correct
Step 1 EMG Not Doing Earnings Management 64 2 97.000
Doing Earnings Management 13 1 7.100
Overall Percentage 81.300
Based on the Table 9 above, it can see that it is predict that mining companies that carry out earnings management will reach 7.100 percent, which shows that the regression model used is only 1 out of 14 companies that perform earnings management, while those that do not perform earnings management have a predictive power of of 97 percent, which shows that model of regression used is 64 out of 66 mining companies that do not perform earnings management, so it can be concluded to predictive power of the model in classifying observations is 81.300 percent.
Wald test. Wald's test determines whether the independent variable partially affects the dependent variable. If the significance value produces a value below five percent, it indicates that one of the independent variables significantly impact the variable of dependent.
Table 10. Wald Statistical Test
B SE Wald df Sig. Exp (B)
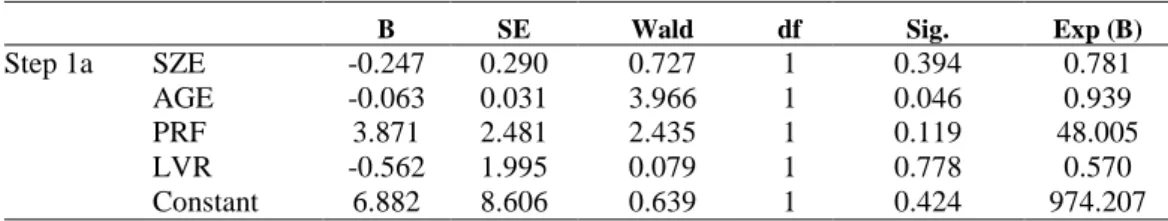
Step 1a SZE -0.247 0.290 0.727 1 0.394 0.781
AGE -0.063 0.031 3.966 1 0.046 0.939
PRF 3.871 2.481 2.435 1 0.119 48.005
LVR -0.562 1.995 0.079 1 0.778 0.570
Constant 6.882 8.606 0.639 1 0.424 974.207
From the table above, the Wald test results can be concluded, that company size (SZE) obtained a coefficient value of -0.247 with level of significant of 0.394, which is a significance value more than 0.050. Thus, can be concluded that H1 is rejected and H0 accepted, meaning that company size has no effect on earnings management. The company age (AGE) obtained a coefficient value of -0.063 with a significant level of 0.046, where the significance value is less than 0.050. Concluded that H2 is accepted and H0 is rejected, meaning that the age of the company has a negative effect on earnings management. Profitability (PRF) obtained a coefficient value of 3.871 with a significant level of 0.119, where the significance value is greater than 0.050. So, it can be concluded that H3 is rejected and H0 is accepted, meaning that profitability has no significant effect on earnings management. Leverage (LVR) obtained a coefficient value of -0.562 with a significance level of 0.778, where the significance value is greater than 0.050. So it can be concluded that H4 is rejected and H0 is accepted, and meaning leverage has no effect on earnings management.
DISCUSSION
The Firm Size Impact on Earnings Management. The coefficient value is -0.247. Then the resulting significance level of 0.394, which value is known more than five percent, so that the conclusion is H1 is rejected and H0 is accepted, which means the company size has no effect on earnings management. This is due to strict supervision within the company, where those who supervise are certain parties such as the government, analysts, investors and stakeholder. With the party that oversees the company and the manager also wants earnings management practices not to be known by the supervisor, the manager will reduce or even eliminate the earnings management action (Sari, 2014). This study found that firm size has no impact on earnings management, which is in line with agency theory, which explains the relationship between company owners (shareholders), which in this relationship can cause conflict for managers (Jehnsen and Meckling, 1976). With this, the manager will try to provide good job prospects so that it can be in accordance with the wishes of the shareholders to avoid conflict. This result is also in line with positive accounting theory, this is because based on the bonus plan hypothesis, which is an action, managers can choose a method to maximize their utility, namely the value of satisfaction or benefit (Watts and Zimmerman, 1986). With this, the manager will try to provide a good job prospect in order to achieve maximum compensation (bonus). This result is in line with (Agustia and Suryani, 2018) as well as (Guna and Herawaty, 2010) namely the size of the company has no impact on earnings management. These results illustrate that firm size is not absolute for achieving earnings management. The professionalism of the manager as a manager is more critical in achieving optimal company profits.
The Company Age Impact on Earnings Management. The resulting coefficient value is -0.063. And the significance level obtained is 0.046 or it can less of five percent, which means H2 is accepted and H0 is rejected. It was concluded that the age of the company has a negative effect on earnings management. Based on the results of the study which states that the age of the company has a negative effect on earnings management, this is in line with agency theory which explains that there is a relationship between the owner of the company or the shareholders and the manager where there can be conflicts in it (Jehnsen and Meckling, 1976). With this, managers from both young and established companies will provide good work performance in order to attract attention and retain investors (shareholders). This result is also in line with positive accounting theory, this is because in the hypothesis the bonus plan is one of the managers' methods to maximize their income (Watts and Zimmerman, 1986). With this, the manager will try to provide good job prospects and improve the company's performance in order to achieve maximum compensation (bonus). This result is in line with (Indracahya and Dewi, 2017), (Yatulhusna, 2015) and (Fahad, 2019), namely the age of the company has a significant negative effect on earnings management. The age of the company has a significant impact on earnings management. The older the age of the company or the longer the company operates, the more experience will be gained, which will minimize the possibility of interventional actions taken by management in determining company profits based on the desire to fulfill personal gain.
The Profitability Impact on Earnings Management. The coefficient value was 3.871.
And also the resulting significance level is 0.119, where the significance value obtained is more than five percent, so H3 is rejected and H0 is accepted, meaning that profitability has no significant effect on earnings management. So it can be seen that companies that have high or low profitability make the level of earnings management practices within the company low (Agustia and Suryani, 2018). This is because the value of ROA is ignored by investors so that managers are no longer motivated to practice earnings management (Bestivano, 2013), so that when the company has either high or low profitability, it will not affect the level of earnings management in the company. The study results to indicate that profitability has no significant effect on earnings management, this can be said to be in line with agency theory which explains the existence of conflicts that can occur between shareholders and managers (Jehnsen and Meckling, 1976). With this, the manager will pay attention to the performance of effective and efficient performance so as to avoid conflicts with shareholders or company owners. And, the study results are in line with positive accounting theory which in the bonus plan hypothesis the manager will use a method that can maximize the company's income (Watts and Zimmerman, 1986). With this, the manager will try to pay attention and provide effective and efficient job prospects in order to achieve maximum compensation (bonus). This result is in line with (Sari, 2015), and (Eka Putri, 2020) namely profitability has no significant influence on earnings management. Profitability insignificant effect on earnings management, and it also shows that the occurrence of profits or losses generated by the company's operations does not rule out the possibility of concrete earnings management actions involving managers' assessments to achieve company profits by utilizing accounting policies as a means to cover up their illegal actions. The role of sound and continuous supervision from top management is also very decisive in this situation.
The Leverage Impact on Earnings Management. This study results, the coefficient value is -0.562. Then the significance level is 0.778, which is smaller than five percent so it can be concluded that H5 is rejected and H0 is accepted, meaning that leverage has no effect on earnings management. This is because if the company experiences an increase in leverage with a high amount of course the company will face a situation where it is not able to fulfill its obligations, so that earnings management actions cannot be a company mechanism to avoid being unable to pay its obligations (Jao and Pagulung, 2011). In general, companies that can be said to be in a safe leverage position are companies that are able to pay their obligations, so that managers do not become motivated to practice earnings management within the company (Elfira, 2014). Based on the results of research which states that leverage has no effect on earnings management, this is in line with agency theory, which explains that the relationship between shareholders (company owners) and managers can cause problems (Jehnsen and Meckling, 1976). With this, the manager certainly does not take actions that can harm shareholders so that managers will reduce or eliminate earnings management practices when the level of leverage reaches low or high numbers, such as manipulating the amount of the company's debt value. However, this result is not in line with positive accounting theory, which in the debt covenant hypothesis, earnings management actions taken by managers aim to avoid breaches of long-term contracts by transferring next year's earnings to the current year (Watts and Zimmerman, 1986). However, the results of this study indicate that the company does not
need earnings management measures to overcome the problem of low or high leverage levels. These results are the same as the research conducted (Bestivano, 2013) and (Nisa, 2019) namely leverage has no effect on earnings management. The situation of the company's leverage is also something that does not have an impact on an activity on earnings management that involves the role of managers to manipulate earnings in order to increase positive information related to the company and how they can operate to maintain stability in operational growth as the value of the company's advantages.
The Influence of Firm Size, Firm Age, Profitability and Leverage Simultaneously on Earnings Management. This study found all of independent variables simultaneously significantly affected to dependent variable. Thera can be seen in table 5.180, where the significance value is 0.018. The value of significance is less than five persent. The company size affecting earnings management, this is because the operational activities carried out by large companies will be more complex (many) when compared to small companies, so that it can allow for earnings management carried out by managers (Medyawati and Dayanti, 2016). The age of the company can affect earnings management, this is because as the age of the company increases, the company will gain more trust from investors. The company will show how long the company is able to compete and run the company's operations (Agustia and Suryani, 2018).
Profitability affects earnings management, meaning that the higher the profitability value of the company, the company will show the assets obtained and will determine the right method in achieving maximum profit (Nisa, 2019). Leverage can affect earnings management, because earnings management practices can be carried out when the company experiences a high level of leverage due to debt levels being greater than assets (Agustia and Suryani, 2018). This result is in line with (Agiusia and Suryani, 2018) and (Yatulhusna, 2015) that is simultaneously the size of the company, the age of the company, profitability and leverage affect earnings management. It focuses on accrual and natural earnings management supported by company size and age, profitability, and leverage to see the two activities carried out by managers in communicating information through the presentation of financial report and operational actions to report to users regularly, where there are indications of being entirely concentrated on the market. Inviting manager actions that significantly impact changes in earnings presentation to meet targets quickly.
CONCLUSION
The study results conclude the firm size has not affect to earnings management.
Company age has a negative however significant influence on earnings management.
Profitability has no significant effect on earnings management. Likewise, leverage does not affect earnings management. Meanwhile, size, age, profitability, and leverage simultaneously significantly affect earnings management of the firm. With reliable corporate governance, it can help produce financial information that is relevant and reliable to reduce the risk of falsifying records and increasing profits that mislead users of company reports. Based on these conclusions, several suggestions can use for further research in future research, and researchers can use the annual report in the latest year or period so that it can produce different results from this research. Principled on the current findings, it is suggested that the next research should add new independent variables, such
as total asset turnover, corporate governance, and corporate social responsibility (CSR).
There is expected to produce results that complement the findings in this study. For future research, researchers can use binary logistic regression analysis because for earnings management research, and there are still few that use binary logistic regression analysis with the condition that the earnings management measurement scale is a dichotomy (dummy) scale.
REFERENCES
Agustia, Y. P. and Suryani, E. (2018). Pengaruh Ukuran Perusahaan, Umur Perusahaan, Leverage, Dan Profitabilitas Terhadap Manajemen Laba (Studi Pada Perusahaan Pertambangan yang Terdaftar di Bursa Efek Indonesia Periode 2014-2016). Jurnal Aset (Akuntansi Riset), 10 (1), 2018, 63-74, 10(1). doi: 10.17509/jaset.v10i1.12571.
Agustia, YP, & Suryani, E. (2018). The Effect of Company Size, Company Age, Leverage and Profitability on Earnings Management (Study of Mining Companies Listed on the Indonesia Stock Exchange 2014-2016 Period). Journal of Assets (Research Accounting), Vol.10, No. 01.
Alfira, A. (2014). The Effect of Bonus and Leverage Compensation on Earnings Management. Padang State University.
Amelia, W., & Hernawati, E. (2016). The Influence of Independent Commissioners, Company Size, And Profitability on Earnings Management. Business Economics, 66-77.
Andries, J. (2017). The Effect of Profitability, Leverage, Company Age and Company Size on Earnings Management in Property and Real Estate Sector Companies Listed on the Indonesia Stock Exchange for the 2012-2015 Period. Journal of Accounting, Institute of Business and Informatics.
Aprina, DN, & Khairunnisa. (2015). The Effect of Firm Size, Profitability and Bonus Compensation on Earnings Management. E-Proceeding Of Management, Volume 2, No. 3, 3251.
Astuti, AY, Nuraina, E., & Wijaya, AL (2017). Effect of Firm Size and Leverage on Earnings Management. The 9th Fipa: Scientific Forum for Accounting Education, Vol. 5. No. 1, 501-514.
Bestivano, W. (2013). The Effect of Firm Size, Firm Age, Profitability, and Leverage on Profit Smoothing in Companies Listed on the Stock Exchange. Padang State University Accounting E-Journal.
Cashmere. (2013). Financial Statement Analysis. Sixth Printing. Edition 1. Rajawali Pers, Jakarta.
Debnath, P. (2017). Assaying The Impact Of Firm's Growth And Performance On Earnings Management: An Empirical Observation Of Indian Economy.
International Journal Of Research In Business Studies And Management, 30-40.
Eka Putri, SW. (2020). Effect of Profitability, Leverage, Company Age, Firm Size, And.
Journal of Accounting Research.
Elfira, A. (2014). The Effect of Bonus and Leverage Compensation on Earnings Management (Empirical Study on Manufacturing Companies Listed on the Indonesia Stock Exchange 2009-2012). Journal of Accounting, Faculty of Economics and Business, Diponegoro University, Semarang Vol. 2 No.02.
Fahad Fajari, M. (2019). The Effect of Company Size, Leverage and Company Age on Earnings Management (Empirical Study on Manufacturing Companies in the Consumer Goods Industry Sector on the Indonesia Stock Exchange 2014-2017 Period). Journal of Accounting Research, Islamic University of Indonesia Yogyakarta.
Fahmi, I. (2013). Financial Statement Analysis. Bandung: Alphabeta.
Fauziyah, N., & Isroah. (2017). The Effect of Good Corporate Governance and Leverage on Real Earnings Management in Manufacturing Companies Listed on the Indonesia Stock Exchange 2010-2012 Period. Journal Profita, Vol. 2, 1-14.
Febriyanti, A. D. and Yahya. (2021). ‘Pengaruh Ukuran Perusahaan, Profitabilitas, Likuiditas, dan Pertumbuhan Penjual Modal’, Jurnal Ilmu dan Riset Manajemen, 6(5).
Ghozali, I. (2018). Multivariate Analysis Application With Spss 25 Program (7 Th Ed.).
Semarang: Diponegoro University Publishing Agency.
Harry. (2016). Know And Understand The Basics Of Financial Statements. Jakarta: PT Grasindo.
Hoirul Fayyum, N. H and Rustiana, S. H. (2019). ‘The Effect of Audit Tenure, Company Age, and Company Size on Audit Report Lag with Manufacturing Industrial Specialization Auditors As ModerationVariables (Empirical Study on Manufacturing Companies Listed on the Indonesia Stock Exchange)’, KnE Social Sciences. doi: 10.18502/kss.v3i26.5421.
https://www.republika.co.id/berita/157626/laporan-keuangan-aneh-ancora-mining-service- dilaporkan-ke-ditjen-pajak, accessed on 10 August 2022.
Indracahya, Erik, and Dei A. Faisol. (2017). The Effect of Good Corporate Gobernance Elements, Leverage, Firm Age, Company Size, and Profitability on Earning Management (Empirical Study of Manufacturing Companies in BEI 2014-2016, Profita: Komunikasi Ilmiah dan Perpajakan, Vol.10, No.2, pp.203-227.
Indrawati. (2015). Management and Business Research Methods. Bandung: Convergence of Communication and Information Technology.
Indriani, M. D. and Juniarti. (2020). ‘Influence of Company Size, Company Age, Sales Growth, and Profitability on Tax Avoidance’, Department of Accounting Indonesian College of Economics, (2016).
Jatmiko, BP. (2020, April 16). Pt Timah Revised Financial Statements, What's Up? Taken
Back From Www.Money.Kompas.Com:
Https://Money.Kompas.Com/Read/2020/04/16/113814926/Pt-Timah-Revisi- Laporan-Keuangan-Ada-Apa?Page=All.
Jehnsen, & Meckling. (1976). The Theory Of The Firm: Manajerial Behaviour, Agency Cost, And Ownership Structure. Journal Of Financial And Economics Vol. 3, 305- 360.
Khuriyati. (2018). The Effect of Good Corporate Governance, Leverage and Company Size on Earnings Management (Study on Basic and Chemical Industry Sector Companies Listed on the Indonesia Stock Exchange 2015-2017 Period). Journal of Accounting Research.
Kuang, Y. F., Qin, B. and Wielhouwer, J. L. (2015) ‘CEO origin and accrual-based earnings management’, Accounting Horizons, 28(3). doi: 10.2308/acch-50810.
Kustiyaningrum, D., Nuraina, E., & Wijaya, AL. (2016). Effect of Leverage, Liquidity, Profitability, and Bond Age on Bond Rating. Journal of Accounting and Education, Vol. 5, No. 1, 25-40.
Kusumawardhani. (2012). The Influence of Size, Prosperity, Legislative Size, Leverage on Financial Performance of Local Governments in Indonesia. Accounting Analysis Journal Vol.9 No. 1, 41-54.
Lestari, KC, & Wulandari, SO. (2019). The Effect of Profitability on Earnings Management (Case Study on Banks Listed on the Indonesia Stock Exchange 2016- 2018). Journal of the Academy of Accountancy, Volume 2, No.1.
Mariana. (2012). Taken Back From Www.Rimanews.Com.
Medyawati, H., & Dayanti, AS. (2016). The Effect of Firm Size on Earnings Management: Panel Data Analysis. Journal of Economics and Business, Volume 21 No.03.
Menz, M. (2021). ‘Corporate Strategy and the Theory of the Firm in the Digital Age’, Journal of Management Studies, 58(7). doi: 10.1111/joms.12760.
Millenia, E. and Jin, F. T. (2021) ‘Determinan Manajemen Laba: Financial Leverage, Profitabilitas, Dan Karakteristik Perusahaan Ellysia Millenia’, Jurnal Bisnis dan Akuntansi, 23(2).
Nabhani, A. (2013). Manipulation of Financial Statements-Bei Imposing Sanctions for the Guards of the Seven Worlds. Taken Back From Neraca.Co.Id.
Naftalia, VC, & Marsono. (2013). The Effect of Leverage on Earnings Management With Corporate Governance as Moderating Variable. Diponegoro University E-Journal.
Nisa, AK. (2019). The Effect of Profitability, Leverage, Company Size, Company Age and Total Asset Turnover on Earnings Management (Empirical Study on Property Adn Real Estate Companies Listed on the Indonesia Stock Exchange for the 2015- 2017 Period). Journal of Accounting Research, Muhammadiyah University, Surakarta.
Paulo, E. and Martins, E. (2012). ‘A Theoretical and Empirical Analysis of Discretionary Accrual Estimation Models in Earnings Management Research’, SSRN Electronic Journal. doi: 10.2139/ssrn.1439836.
Purwanti, L. (2021). Weton Determinants of Earnings Management Practices. Poor.
Puspita, AR. (2019). Company Size, Company Age, Leverage, Profitability and Independent Commissioner on Earnings Management (Empirical Study on Manufacturing Companies Listed on the Stock Exchange in 2015-2018). Journal of Accounting Research, Muhammadiyah University of Magelang.
Ramadan. (2017). Analysis of Factors Affecting Earnings Management in Manufacturing Companies Listed In Bei. Proceedings of the National Seminar and Call For Paper on Economics and Business, 464-476.
Ramadhan, FZ. (2015). The Effect of Production Costs and Operational Costs on Net Profit (Case of Manufacturing Industry Companies in the Consumer Goods Industry Sector of Sub-Cigarettes Listed on the Indonesia Stock Exchange (IDX)). Journal of Accounting Research.
Rice. (2016). The Influence of Financial Factors on Earnings Management With Corporate Governance as Moderating Variable. Journal of Wira Mikroskil Economics Volume 6, Number 01.
Riyanto, A., Adriani, A., & Norlena. (2021). The Effect of Good Corporate Governance Mechanisms and Disclosure of Corporate Social Responsibility on Earnings Management Practices. Journal of Economics (Management, Accounting and Sharia Banking) Vol. 10, No.01.
Robert H., M., Sutarmo, Y., & Bachtiar, Y. (2022). Research Methodology For Social Sciences Humanities With Quantitative Approach: Proposals, Research Activities, Research Reports. Jakarta: Salemba Empat.
Saputra, R. (2019). Analysis of the Factors Influence of Tax Motivation on Transfer Pricing Policy in Companies Listed on the Indonesia Stock Exchange in 2013-2017.
Saragih, S. L. (2021). ‘Approaches and criticisms of positive accounting theory and its economic consequences’, International Journal of Multidisciplinary Research and Growth Evaluation, 2(4).
Sari, LR. (2014). The Effect of Company Size and Ownership Structure on Income Smoothing Practices in Manufacturing Companies Listed on the Indonesia Stock Exchange. Padang State University Accounting E-Journal.
Sari. (2015). Analysis of Factors Affecting Earnings Management In Manufacturing Companies Listed In Bei. E-Journal of Economics, University of Riau.
Savitri, E. (2014). Analysis of the Effect of Leverage and Life Cycle on Earnings Management in Real Estate and Property Companies Listed on the Indonesia Stock Exchange. Journal of Accounting Vol. 3, No. 1, 72-89.
Scott, WR. (2015). Financial Accounting Theory. Toronto: Pearson Prentice Hall.
Subramanyam, K., & Wild, JJ. (2014). Financial Statement Analysis, 11th Edition. New York: McGraw-Hill International Edition.
Ulya, N., & Khairunnisa. (2015). The Influence of Firm Size, Profitability, Financial Leverage and Audit Quality on Earnings Management Practices. E-Prociding Of Management, Vol. 2, No. 1, 324-331.
Watts, R., & Zimmerman, J. (1986). Positive Accounting Theory. Englewood Cliffs, New Jersey: Prentice-Hall.
Wibowo. (2016). Performance Management (Fifth Edition).
Widiastari, PA, & Yasa, GW. (2018). Effect of Profitability, Free Cash Flow, And Firm Size Firm Value. E-Journal of Accounting, Udayana University, Vol 23, 966.
Wildani, A. (2008). Analysis of Factors Affecting the Practice of Income Smoothing in Manufacturing and Financial Companies Listed on the Bei. Diponegoro Journal Of Accounting, Volume 1, No. 1, 1-13.
Yatulhusna, N. (2015). Effect of Profitability, Leverage, Age and Company Size on Earnings Management (Empirical Study on Manufacturing Companies Listed on the Indonesia Stock Exchange 2010-2013 Period).