F INANCIAL P L ANNING
Planning is a big part of modern corporate life, especially in large companies. Firms plan their futures constantly, addressing everything from cash flow and short-term profitability to long-run strategy.
Generally, the higher in management people are, the more time they devote to planning. It isn’t unusual for top executives to spend 80% of their time thinking about the future. At the same time, some planning functions involve virtually everyone in management. For example, one thing you can be sure you’ll do in your first management job is prepare a budget.
This chapter deals primarily with financial planning. Simply put, that means projecting a company’s financial statements into the future. However, financial planning is a part of a broader activity known asbusiness planning. To really appreciate financial planning, we have to understand the nature and pur- pose of business planning, and see how the financial element fits into the broader concept.
BUSINESS PLANNING
The easiest way to describe business planning is in terms of its result. The process produces a document called a business plan, which can be thought of as a picture or model of what a business unit is expected to become in the future. The business plan generally looks like a magazine (with graphs and diagrams rather than pictures), and consists of a combination of words and numbers that describe the business.
The numbers in a plan are largely projected financial statements. That is, they’re estimates of what the firm’s statements will look like in the future if the assumptions about the business made by the planners come true. Such statements based on hypothetical circumstances are called pro forma, mean- ing they are cast “as if” the planning assumptions are true.
Business Planning
Component Parts of a Business Plan The Purpose of Planning and Plan
Information
Credibility and Supporting Detail Four Kinds of Business Plan The Financial Plan as a Component
of a Business Plan Making Financial Projections
Planning for New and Existing Businesses
The General Approach, Assumptions, and the Debt/Interest Problem Plans with Simple Assumptions Forecasting Cash Needs
The Percentage of Sales Method—A Formula Approach
The Sustainable Growth Rate Plans with More Complicated
Assumptions
A Comprehensive Example—A Complex Plan for an Existing Business
Planning at the Department Level The Cash Budget
Management Issues in Financial Planning
The Financial Plan as a Set of Goals Risk in Financial Planning in General Financial Planning and Computers
C H A P T E R O U T L I N E
4
CHAPTER
The words in a business plan describe the operation in a realistic yet concise way.
They discuss broad strategic issues, detail the handling of short-term tactical questions, and amplify the financial projections.
The overall image conveyed by a good business plan is very comprehensive. It includes information on products, markets, employees, technology, facilities, capital, revenue, profitability, and anything else that might be relevant in describing the organization and its affairs.
COMPONENT PARTS OF A BUSINESS PLAN
Although the detail within business plans varies a great deal from company to com- pany, most follow a fairly standard overall format. A typical outline follows.
a. Contents
b. Executive Summary
c. Mission and Strategy Statement d. Market Analysis
e. Operations (of the business) f. Management and Staffing g.Financial Projections h. Contingencies
The first two sections are introductory. The table of contents is just that, and the executive summary is a one-page overview of everything that follows.
The mission and strategy section lays out the basic charter of the business and establishes its long-term direction. The market analysis attempts to demonstrate why the business will succeed against its competitors. The chapter on operations describes how the firm creates and distributes its product or service. The management and staffing chapter details the firm’s projected personnel needs and in some cases lays out the credentials of key managers.
The financial section of the business plan projects the company’s financial results into the future, and is the firm’s financial plan. How that projection is put together will be our main focus in this chapter. The section on contingencies tells what the company will do if things don’t go as planned.
THE PURPOSE OF PLANNING AND PLAN INFORMATION
The two major audiences for a firm’s business plan and the information it contains are the firm’s own management and outside investors.
The Managerial Value of Planning
Business planning has several managerial benefits. One has to do with the process of creating the plan, while the others are related to using the finished product.
The Planning Process
The planning process can pull a management team into a cohesive unit with common goals. It helps everyone understand what the objectives of the organization are, why they’re important, and how the organization intends to achieve them. Creating a plan forces the team to think through everything that has to be done in the coming period, making sure everyone understands what they have to do.
A Road Map for Running the Business
A business plan functions as a road map for getting an organization to its goal.
Comparing the details of operating performance with the plan and investigating A firm’s financial
planis a projec- tion of its financial statements into the future.
The planning processhelps to pull the manage- ment team together.
A business planis a model of what management expects a business to become in the future expressed in wordsand financial projec- tions.
deviations is an important management process. When a business goes off course, such a comparison is the best way to understand the firm’s problems and come up with solutions. The idea is illustrated in Figure 4.1.
A Statement of Goals
A business plan is a projection of the future that generally reflects what management would like to see happen. Accordingly, it can be viewed as a set of goals for the com- pany as a whole and for its individual departments.
A plan contains revenue targets, departmental expense constraints, and various development goals for products and processes. Different people are responsible for dif- ferent goals, and performance against them can be measured and evaluated.
It’s especially common to tie executive bonuses to the achievement of goals within business plans. We’ll have more to say about goals within plans later in the chapter.
Predicting Financing Needs
Financial planning is extremely important for companies that rely on outside financ- ing. Only through accurate financial planning can a corporate treasurer predict when he or she will need to turn to financial markets to raise additional money to support operations.
Communicating Information to Investors
A business plan is management’s statement about what the company is going to be in the future, and can be used to communicate those ideas to investors. A plan predicts the future character of the enterprise. It makes an estimate of profitability and cash flow. The financial information tells equity investors what returns they can expect and debt investors where the firm will get the money to repay loans.
Small firms use the business plan document itself in dealing with investors. Large companies convey selected plan information to securities analysts who use it and past performance as a basis for recommendations to clients.
A completed plan serves as a road mapfor guiding a business toward the goals stated in the plan.
The financial plan is especially important for anticipating financing needs.
The business plan is a vehicle for communicating with potential investors.
Figure 4.1
Using a Plan to Guide Business Performance
Planned Performance
Same
Continue as Before
Actual Performance
Deviation
Corrective Action Comparison
Business Planning in Divisions of Large Companies
Large companies are usually organized into decentralized operating divisions that function more or less like independent companies. Most large firms engage in a nearly continuous planning process. Divisions produce their own plans, which are consolidated to create overall corporate plans.
The business planning process is an important vehicle through which divisions communicate with corporate managements. A division’s final business plan is a state- ment of its goals that reflects the parent company’s expectations as well as its own.
Divisional plans are generally approved by corporate management after lengthy reviews, and nearly everything a division does is compared with its plan.
Success and failure at the division are defined relative to the business plan.
CREDIBILITY AND SUPPORTING DETAIL
Predictions of the future may not come true. Everyone knows that, so there’s always an issue of believability surrounding business plans. Financial plans are especially sub- ject to skepticism because it’s usually hard to tell how the planners developed the numbers in the projected statements. Let’s consider a simplified example to illustrate the idea.
Suppose Poorly Inc. has revenue of $100 million and profit of $1 million this year.
The board of directors is pressuring management for better performance and has demanded a plan showing an improvement. In response, management submits the following.
Poorly Inc.
Financial Plan
This Year Next Year
Revenue $100 million $120 million
EAT 1 million 12 million
Technically, this projection satisfies the board’s request for a plan showing improve- ment, but the obvious question is why should the board members believe it. In the sit- uation described, they probably would not.
The problem is that this “plan” as presented lacks supporting detail. A reader doesn’t know whether it’s something made up just to satisfy the board’s demand or represents the summarized product of a great deal of analysis. In other words, it doesn’t tell the reader enough about the thinking behind the financial figures to make them believable.
A competent plan may display summarized financial projections, but the figures are supported by enough detail to show that they’re the product of logical thinking. For example, revenue projections are usually supported by schedules showing the products and quantities to be sold, their prices, and which sales organizations are expected to do the selling. These schedules in turn are backed up by reasoning that tells why cer- tain products are expected to sell more than others and why some salespeople will outsell their rivals. The point is that a planner can’t just write down a revenue figure that’s plucked out of thin air and expect people to believe it.
Supporting detail shows how the numbers in the financial plan were developed.
The detail doesn’t all have to be included in the plan document itself, but should be available if a reader has questions.
As we proceed, we’ll see that financial plans are constructed with varying levels of supporting detail depending on their use. It’s important to match the level of detail to the purpose of the plan.
A good business plan shows enough support- ing detailto indi- cate that it is the product of careful thinking.
FOUR KINDS OF BUSINESS PLAN
There are as many as four variations on the basic idea of business planning. Each serves a different purpose and results in a separate document. Large, sophisticated companies tend to do all of these different kinds of planning. Small firms usually do only one plan that combines features of the four variations.
The four kinds of planning are (1) strategic planning, (2) operational planning, (3) budgeting, and (4) forecasting.1,2They differ according to three attributes: the length of the planning period (the planning horizon), the kinds of issues addressed, and the level of financial detail projected.
Strategic Planning
Strategic planning involves broad, conceptual thinking about the nature of a business, whom it serves, and what it does. It’s generally a long-term exercise in which man- agers try to predict in rough terms what the business will do and become over a period of several years. A five-year horizon is the most common.
Strategic planning begins by questioning the company’s very existence. Why is the firm doing what it does? Would it be better off doing something else? What customer need does it serve? How? What opportunities are present in the marketplace? What threats? Strategy demands that a company develop a mission and a charter and that it define what it does and why, while stating its loftiest goals.
Once that base is established, strategic planners look forward over several years and consider broad, sweeping issues. At the end of five years, will the firm be in the same lines of business? In the same geographic areas? How large will it have grown? Who will be its competitors, and how will it fight them? And so on.
Strategic planning deals with concepts and ideas expressed mostly with words rather than numbers. The numbers used tend to be simple and approximate. For example, a firm’s strategic plan might establish a goal of being the number one or two rated company in its industry based on some measure such as sales or market share. Or a firm might set a sales goal of about $500 million a year, stating that revenue figure without a lot of supporting detail.
Strategic plans include projected financial statements, but they’re approximate and ideal, and usually not supported by much detail. The plan’s last (usually fifth) year gener- ally shows financial results that reflect the best the business could ever be expected to do.
Strategic plans are often called long-range plans or five-year plans.
In a nutshell, systematic strategic thinking says that a business must first analyze itself, its industry, and the competitive situation. Then it must construct an approach to doing business that takes advantage of its strengths and minimizes the vulnerabilities created by its weaknesses. A strategic plan is a vehicle for documenting this kind of thinking.
Operational Planning
Operational planning involves translating business ideas into concrete, shorter-term projections usually encompassing about a year. Projections are a great deal more detailed here than in strategic planning.
The strategic plan addresses broad, long-term issues, and contains only summarized, approximate finan- cial projections.
1. Planning terminology isn’t consistent among companies. In some firms, people talk about an annual operating budget, while others make a long-term forecast. The words “outlook” and “view” are also common. The important distinction is the length of the planning horizon: Multi- (usually five) year—
long-term, strategic. One year—intermediate term, operating. Three to six months—short-term, budgetary. Two weeks to three months—very short-term, forecast.
2. Budgets and forecasts are abbreviated business plans and often don’t have all the parts described earlier. They are predominantly financial projections.
Among other things, operational plans specify how much the company will sell, to whom, and at what prices. They also spell out where the firm will get its inputs and equipment, what those things will cost, and what the firm expects to earn.
The word “operational” or “operating” means having to do with the day-to-day running of the business. Major short-term goals are generally set up in the operat- ing plan. Revenue targets are established along with profit objectives. Sales quotas and product development milestones are laid out. Compensation and bonus sys- tems are also specified. Most companies do an annual plan that is an operational plan, and is generally their most important planning exercise.
A typical annual operating planis conceptually an almost even mix of words and numbers. The document explains what’s going on verbally, but backs the explanation up with financial projections containing substantial supporting detail.
Budgeting
In many industries, business conditions change rapidly and an annual operating plan can be badly out of date by the second half of the year it covers. Budgets are essentially short-term updates of annual plans, typically covering three-month quar- ters. In addition, they usually contain supporting detail beyond that found in the annual plan.
A budget ties down exactly how much money, material, and labor will flow through the organization and fixes responsibility on specific people for making it happen. The budgeting process involves trying to predict exactly how much of which products will be sold and at what cost. Along with that, it attempts a precise estimate of how many dollars will be spent in each department, on exactly what items: salary, material, travel, and so on.
It’s important to realize that the budgetary time frame is too short to make major conceptual changes in the businesses. Policy issues and long-term direction aren’t usu- ally discussed, so budgets have relatively fewer words and more financial detail than annual plans. Clearly, a budget can also be considered an operating plan because it details the day-to-day operation of the business.
Forecasting
Forecasts are quick estimates of short-term financial results. They’re essentially projections of where the financial momentumof a business will carry it over a short period. They usually consist almost entirely of numbers with very little supporting verbiage.
Forecasts are generally made either to estimate cash flows or when management gets worried about how the company will close out a period in terms of profits.
Short-term forecasting is especially important with respect to cash requirements. If a company is to pay its bills and make its payroll, it has to have an accurate picture of the cash ins and outs that can be expected over the next few weeks and months. If a temporary shortage is predicted, bank borrowing has to be arranged to keep the firm running until collections catch up with disbursements.
Acash forecastis a financial projection made with the explicit purpose of predict- ing short-term cash needs. Most large firms do monthlycash forecasts.3
The annual oper- ating planproj- ects the business in detailover a year, and is the most important planning exercise.
Budgetsare short-term updates of the annual plan when business condi- tions change rapidly.
Forecastsare very short-termprojec- tions of profitand cashflow.
3. The words “plan” and “forecast” have slightly different implications when used as nouns and verbs. A forecast (noun) tends to mean a short-term projection. A plan (noun) has a longer-term implication.
The verbs are used more generally and don’t tend to be tied to the length of the planning horizon.
Hence, we routinely talk about forecastingthe numbers within a plan or planningthe numbers within a forecast.
The Business Planning Spectrum
It helps one’s understanding of planning to imagine the different kinds of plan arrayed along a spectrum. The broad, conceptual thinking of long-term strategic planning is on one end, while the numerical detail of short-term forecasting is on the other. The idea is illustrated in Figure 4.2. As we move from left to right, the planning horizon (time covered) gets shorter, and the documents progress from qualitative to quantitative—
that is, from being mostly words to mostly numbers.
Ideally, companies practice the whole spectrum of planning. That’s the way most large companies operate, producing all the different documents. In such an environ- ment, the strategic plan and the annual operating plan are each produced once a year about six months apart.4In addition, there are usually four quarterly budgets and any number of forecasts.5
Relating Planning Processes of Small and Large Businesses
In the small business world, the planning spectrum is usually compressed into one document known simply as the company’s “business plan.” It tends to be produced when the firm is getting started and updated later when money is needed from a bank or another outside source.
The business plan produced by small companies can be related to the full planning spectrum found in larger firms. The idea is illustrated in Figure 4.3. The (small) busi- ness plan overlaps three of the exercises along the spectrum. It includes everything we normally think of as operational (annual) planning, as well as elements of both strate- gic planning and budgeting.
The entrepreneur’s plan must do everything the big corporation’s annual operating plan does. It has to provide a thorough rationale for the concrete actions planned in the next year and make some fairly detailed projections of quantities, staffing, and dollars over that period.
Figure 4.2
The Business Planning Spectrum
4. It’s important to notice that even though the strategic plan covers five or more years, it is revised annually.
5. Companies in very stable businesses may omit the budget segment of the spectrum. Producers of basic foods and certain regulated utilities are examples. Their revenues don’t change much from year to year, so it may not be necessary to rebudget quarterly to keep up with changing business conditions. High- tech industries represent the opposite extreme. Technology and the markets for it change rapidly, and the companies constantly engage in replanning.
When in need of funding, small businessestend to do a single business planthat contains both strategic and oper- ating elements.
The Small Business Administration offers some helpful tips and information on run- ning a small business including financial guidance at http://www.sba.gov
http://
The Business Planning Spectrum
Strategic Plan
Annual Operating
Plan
Quarterly Budgets
Short-Term Forecasts
Long Term Short Term
General, Conceptual
Detailed, Numerical
With respect to strategy, however, the small business plan doesn’t need to cover the broadest issues. For example, it doesn’t have to discuss why the entrepreneur chose this business over others because that decision has already been made. The plan does have to establish that a market clearly exists and that it can be served by the business. The small business plan must also make longer-term strategic projections of what the business will be three to five years in the future.
Finally, a small business plan has to get under an operating plan and project at least the first year in budget-like detail. Investors generally demand at least this much pre- cision from entrepreneurs.6
THE FINANCIAL PLAN AS A COMPONENT OF A BUSINESS PLAN
A financial plan is simply the financial portion of any of the business plans we’ve been talking about. It is a set of pro forma financial statements projected over the time period covered by the plan.7
It’s important to appreciate the role of the financial plan in each of the four plan- ning documents we discussed earlier. No business plan is complete without a financial projection, but it’s of secondary importance in the strategic plan. That document is an exposition of thoughts and ideas that discusses the how and why of a business. The financialsare pieces of the projection, but generally aren’t central to the presentation.
In an annual plan, on the other hand, the financial projection is the centerpiece of the document. In operational terms, a company’s financial plan is its business plan.
There are usually a great many words in an annual plan, but they tend to be explana- tions of how the operating figures are to be achieved rather than discussions that stand by themselves.
Budgets and forecasts, especially the latter, are almost entirely financial planning exercises.
MAKING FINANCIAL PROJECTIONS
Projecting financial statements involves translating planned physical and economic activity into dollars. That generally means making a sales forecast first, and then developing what the rest of the company needs to do to support the activity implied.
Those physical projections lead to the dollar figures in the financial statements.
Figure 4.3
Relating Business Planning in Large and Small
Companies
The financial plan is an integral part of the overall business plan.
6. For a comprehensive treatment of business planning in the context of small business, see The Perfect Business Plan Made Simpleby William Lasher (New York: Random House, 2005).
7. The terms “financial plan” and “financial planner” have a common meaning that shouldn’t be confused with their use in this chapter. Personal financial advisors who set up investment programs (financial plans) for clients are known as “financial planners.” The field has nothing to do with business planning or projecting financial statements.
The Business Owner’s Toolkit at
http://www.toolkit.
cch.com/tools/tools.
asp
offers some great financial planning ideas for small busi- nesses.
http://
The Business Planning Spectrum
Strategic Plan
Annual Operating
Plan
Quarterly Budgets
Short-Term Forecasts
The Small Business “Business Plan”
PLANNING FOR NEW AND EXISTING BUSINESSES
Financial plans are constructed for both new and ongoing businesses. The processes are conceptually similar, but as a practical matter it’s a good deal harder to plan for an operation that’s either very new or has yet to be started.
It’s difficult to forecast how much a new business will sell or how much support it will need, because there’s no history on which to base projections. That means every- thing has to be developed from the ground up. Forecasting for an established business is much easier, because recent results and the existing base of assets and liabilities can be used as points of departure for the projection.
The Typical Planning Task
Most financial planning is done for existing businesses. Basically, it involves forecast- ing changes to what’s been going on in the past. The changes are generally referred to asplanning assumptions. Anything about which an explicit assumption isn’t made is implicitly assumed to remain unchanged from the previous year. (For a new business, everything has to be explicitly assumed.)
For example, an existing business might plan next year’s operations assuming the following changes.
• A 10% growth in unit sales
• A 3% reduction in product price
• A $2 per unit increase in the cost of materials
• Overall labor cost increases of 4%
• An improvement in inventory turnover from 5.3 to 6.3
• An improvement in the ACP from 45 to 40 days
• An increase in interest rates from 7% to 9%
• And so on.
The financial planner’s task is to put together a plan, benchmarking from last year’s performance, that reflects these changes in the projected financial statements.
THE GENERAL APPROACH, ASSUMPTIONS, AND THE DEBT/INTEREST PROBLEM
In this section we’ll outline how any financial planning problem is tackled, and con- sider the peculiar problem of forecasting debt and interest. We’ll begin by establishing exactly what we’re trying to forecast and exactly what we have to start with.
What We Have and What We Need to Project
Every financial planning problem involves forecasting future financial statements beginning with the next period given the results of the last period.8,9Only the income statement and balance sheet have to be forecast. The statement of cash flows is devel- oped from those two without any additional projections.
Most financial planning involves forecasting changes in ongo- ing businesses based on plan- ning assumptions.
8. For discussion purposes, we’ll assume yearly time periods.
9. Most of the time, planning for a particular year is done toward the end of the preceding (current) year.
That means planners don’t have actual financial results for the current year with which to work. However, because year end is close, they generally have relatively good estimates of the year’s actual results.
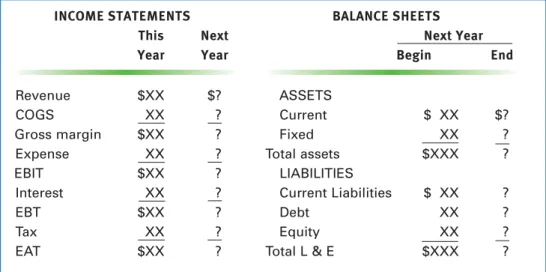
Figure 4.4 shows the planner’s task conceptually. The current (this) year’s income statement is available, as is the ending balance sheet (which is next year’s beginning balance sheet). These items are indicated by $XX in the figure. Using those as refer- ences, next year’s income statement and ending balance sheet must be forecast incor- porating the physical and economic assumptions made in the plan.
If the plan is for a new business, the $XXs are simply all zeros.
Planning Assumptions
We introduced the idea of an assumption briefly in the last section. At this point we’ll define the concept more precisely and illustrate how it works.
Aplanning assumptionis some physical or economic condition that is expected to exist during the planning period. Assumptions can reflect any of the forces that influence a firm’s financial results. Some things originate outside the company, like interest rates and taxes. Others come from planned management actions, like pricing or cost control. Still others come from customer behavior, like the volume response to a price change.
In general, each line on a projected set of financial statements is forecast on the basis of one or more assumptions about the business. Here’s a simplified example to illustrate the idea.
This year Crumb Baking Corp. sold 1 million coffee cakes per month to grocery distributors at
$1 each for a total of $12 million. The firm had year-end receivables equal to two months of sales or $2 million. Crumb’s operating assumptions with respect to sales and receivables for next year are:
1. Price will be decreased by 10% in order to sell more product.
2. As a result of the price decrease, unit sales volume will increase to 15 million coffee cakes.
3. Collection efforts will be increased so that only one month of sales will be in receiv- ables at year end.
Forecast next year’s revenue and ending receivables balance on the basis of these assump- tions. Assume sales are evenly distributed over the year.
INCOME STATEMENTS BALANCE SHEETS
This Next Next Year
Year Year Begin End
Revenue $XX $? ASSETS
COGS XX ? Current $ XX $?
Gross margin $XX ? Fixed XX ?
Expense XX ? Total assets $XXX ?
EBIT $XX ? LIABILITIES
Interest XX ? Current Liabilities $ XX ?
EBT $XX ? Debt XX ?
Tax XX ? Equity XX ?
EAT $XX ? Total L & E $XXX ?
Figure 4.4
The Planning Task
Example 4.1
A planning assumptionis an expected condi- tionthat dictates the size of one or more financial statement items.
SOLUTION: There are three interrelated planning assumptions in this example. The first reflects a management action with respect to pricing, and the second defines the expected customer response to that action. Together, they establish the revenue forecast: Next year, 15 million coffee cakes will be sold at $.90 each, so total revenue will be
revenue15,000,000$.90 $13,500,000
The third assumption is that the company’s credit and collection activities will be more effective next year. This will be reflected by a decrease from two to one in the number of months of revenue that remain uncollected in accounts receivable at year end.
A/R$13,500,000/12$1,125,000
Notice that the receivables calculation depends on all three assumptions, because it uses the revenue projection developed from the first two as well as the third assumption about the effectiveness of credit and collections.
The Procedural Approach
Financial plans are built by attacking line items one at a time starting with revenue, doing the kind of thing illustrated in Example 4.1.
The substance of financial planning is the logical translation of assumptions into the forecast figures they imply. It’s important to realize that the calculations required for that translation differ, depending on the line item and the nature of the assump- tion. Some are very simple while others can become involved. We’ll go through some more examples shortly.
The procedure moves down the income statement through cost and expense, stop- ping just beforethe interest expense line. Then the balance sheet projections are addressed. All the asset and liability accounts other than long-term debt and equity are forecast. At that point the planning procedure encounters a problem.
The Debt/Interest Planning Problem
The next items needed to complete the financial statements are interest expense on the income statement and debt on the balance sheet. The problem is that each depends on the other, so a straightforward forecast is impossible.
It’s important to understand the reason for this difficulty, but the explanation can be a little hard to follow. The problem is described in the following paragraphs and illustrated in Figure 4.5. Read the explanation carefully, referring to the illustration at the same time.
Start by examining Figure 4.5. $XXs imply dollar forecasts have already been made and question marks (?) indicate they haven’t. Notice that on the income statement we lack a forecast of interest expense and everything below it, including earnings after tax (EAT). On the balance sheet we have forecasts for all the asset and liability accounts other than debt and equity. Notice that we do have the total liabilities and equity figure, because it’s equal to total assets.
To complete the income statement, we need a forecast of interest expense. But interest is calculated by applying the interest rate to the average projected debt bal- ance during the coming year. We know the beginning debt balance, but we have to forecast the ending figure to get an average.
Forecasting ending debt requires that we complete the ending balance sheet, which requires that we forecast ending equity. Ending equity is computed by adding the The debt/interest
dilemma: Planned debt is required to forecast inter- est, but interest is required to fore- cast debt.
year’s EAT from the income statement (less any dividends to be paid plus any new stock that will be sold) to beginning equity.
But we don’t have a forecast for EAT because we weren’t able to complete the income statement without interest expense, which we don’t have because we don’t have a forecast for ending debt. In other words, the problem is circular. We need debt to calculate interest, but we have to have interest to calculate debt (through EAT and equity).
All this means we can’t make a direct forecast of either debt or interest expense.
Therefore, we can’t complete the financial plan with the direct line-by-line approach we’ve been using so far. Every financial plan runs into this technical impasse.
An Iterative Numerical Approach
The problem is solved using a numerical technique that begins with a guess at the solution. The guess is usually wrong, but it gives us a starting point from which we can work toward the correct answer.
The procedure works as follows.
1. Interest:Guess a value of interest expense.
2. EAT:Complete the income statement.
3. Ending equity:Calculate ending equity as beginning equity plus EAT (less divi- dends plus new stock to be sold if either of these exist).
Figure 4.5
The Debt/Interest Planning Problem
INCOME STATEMENTS BALANCE SHEETS
Next Year
Next Year Beginning Ending
Revenue $XX ASSETS
COGS XX Current $ XX $ XX
Gross margin $XX Fixed XX XX
Expense XX Total assets $XXX $XXX
EBIT $XX LIABILITIES
Interest ? Current $ XX $ XX
EBT ? Debt XX ?
Tax ? Equity XX ?
EAT ? Total L&E $XXX $XXX
EAT (less dividends) is added to beginning equity to arrive at ending equity,
which is required to compute ending debt.
Ending debt is averaged with beginning debt and multiplied by the interest rate to calculate
interest expense.
4. Ending debt:Calculate ending debt as total L&E (total assets) less current lia- bilities less ending equity.
5. Interest:Average beginning and ending debt. Calculate interest by multiplying average debt by the interest rate.
6. Test results:Compare the calculated interest from step 5 to the original guess in step 1.
a. If the two are significantly different, return to step 1, replacing the guess at interest with the value just calculated and repeat steps 2 through 6.
b. If the calculated value of interest is close to the guess, stop.
Procedures like this one that find solutions to problems though a repetitive series of calculations are known as numerical methodsoriterative techniques. Each pass through the procedure is an iteration. It rarely takes more than two or three iterations to arrive at an acceptable solution regardless of the initial guess. An example will make the method clear.
The following partial financial forecast has been done for Hanover Inc. Complete the financial plan, assuming that Hanover pays interest at 10% and has a flat income tax rate of 40% includ- ing federal and state taxes. (We’ll generally assume a simple, flat tax rate in our examples.) Also assume no dividends are to be paid and no new stock is to be sold.
Financial Plan for Hanover Inc. ($000)
INCOME STATEMENT BALANCE SHEETS
Next Year
Next Year Beginning Ending
Revenue $10,000 ASSETS
Cost/Expense 9,000 Total assets $1,000 $3,000
EBIT $ 1,000 LIABILITIES
Interest ? Current liabilities $ 300 $ 700
EBT ? Debt 100 ?
Tax ? Equity 600 ?
EAT ? Total L&E $1,000 $3,000
SOLUTION: First notice that we’re assuming a rather large growth rate in this illustration.
Hanover’s assets are forecast to triple in one year. That’s possible, but unusual. In this case, it will cause the company’s debt to increase rather dramatically in the coming year.
We’ll complete the forecast using the procedure outlined above, considering each step in turn.
1. Guess at interest:In most practical situations, the interest paid last year makes a good starting guess for next year’s interest. Since we don’t have that here, we’ll make an arbitrary guess of $200,000.
The forecast is completed in the next three steps. We’ll display the result now, and then show the detail of steps 2 through 4. The bottom of the income statement and the liabilities and equity portion of the balance sheet based on our interest guess are as follows.
An iterative, numerical approachsolves the debt/interest problem.
Example 4.2
First Iteration ($000) EBIT $1,000 LIABILITIES & EQUITY
Interest 200 Current liabilities $ 300 $ 700
EBT $ 800 Debt 100 1,220
Tax 320 Equity 600 1,080
EAT $ 480 Total L&E $1,000 $3,000
The following steps get us to this result.
2. Compute EAT:Assuming interest expense of $200,000, EAT is $480,000 calculated as follows.
EBIT $ 1,000,000
Interest 200,000
EBT $ 800,000
Tax (@ 40%) 320,000
EAT $ 480,000
3. Ending equity:Ending equity is beginning equity plus EAT.
Beginning equity $ 600,000
EAT 480,000
Ending equity $ 1,080,000
4. Ending debt:Ending debt is total L&E less ending equity less ending current liabilities.
Total L&E $ 3,000,000
Ending equity (1,080,000)
Current liabilities (700,000)
Ending debt $ 1,220,000
At this point we have a set of financial statements based on our guess at interest expense.
Next we test to see whether the calculated debt and the implied interest are consistent with that guess.
5. Interest:The interest implied by our calculated debt is the product of average debt and the interest rate.
average interest $100,000 $1,220,000
.10 $66,000
debt rate 2
6. Test results:Our next step is to test the calculated interest from step 5 against the original guess. As is usually the case, the two aren’t very close. The original guess of
$200,000 is much higher than the calculated interest of $66,000.
We begin the next iteration of the procedure by using the calculated interest figure ($66,000) in place of the guess. Verify that steps 2 through 4 result in the following figures (rounded to the nearest thousand dollars).
Second Iteration ($000) EBIT $1,000 LIABILITIES & EQUITY
Interest 66 Current liabilities $ 300 $ 700
EBT $ 934 Debt 100 1,140
Tax 374 Equity 600 1,160
EAT $ 560 Total L&E $1,000 $3,000
Given these results, average debt is
$100,000$1,140,000
$620,000 2
and interest is
$620,000.10$62,000
Thus, the second guess and the calculated result are off by only $4,000 out of $62,000.
As an exercise, demonstrate that one more iteration gives a result that’s accurate to within a thousand dollars with interest of $62,000 and ending debt of $1,143,000.
PLANS WITH SIMPLE ASSUMPTIONS
Financial plans can be constructed roughly or with great precision. The difference lies in the amount of thought and detail put into the assumptions on which the plans are based. A rough plan is based on just a few assumptions about the future, while a detailed plan can involve a great many. In this section we’ll look into creating a financial plan for an existing business in simple, rough terms.
The Quick Estimate Based on Sales Growth
Thepercentage of sales methodis a simple, approximate approach to forecasting financial statements for an existing business. The method involves estimating the company’s sales growth rate, and assuming that all income statement and balance sheet line items grow at the same rate. The technique implicitly assumes that the firm’s efficiency and all of its operating ratios(Chapter 3) stay the same through the growth period.
The assumption that everything varies proportionately with (grows at the same rate as) sales is an oversimplification that’s of theoretical interest, but isn’t usually applicable in prac- tice. Most of the time, the method is modified to assume that most, but not all, things vary directly with sales. We’ll call such an approach the modified percentage of sales method. Here’s an example.
The Underhill Manufacturing Company expects next year’s revenues to increase by 15% over this year’s. The firm has some excess factory capacity, so no new fixed assets beyond normal replacements will be needed to support the growth. This year’s income statement and ending balance sheet are estimated as follows.
Underhill Manufacturing Company This Year ($000)
INCOME STATEMENT BALANCE SHEET
Percentage of salesmethods assume most financial state- ment line items vary directlywith revenue.
from the CFO
Example 4.3
Revenue $ 13,580
COGS 7,470
Gross margin $ 6,110
Expense* 3,395
EBIT $ 2,715
Interest 150
EBT $ 2,565
Tax 1,077
EAT $ 1,488
*Includes marketing, engineering, and administration.
ASSETS
Cash $ 348
Accounts receivable 1,698
Inventory 1,494
Current assets $ 3,540
Net fixed assets 2,460
Total assets $6,000
LIABILITIES & EQUITY
Accounts payable $ 125
Accruals 45
Current liabilities $ 170
Debt 1,330
Equity 4,500
Total L&E $6,000
Assume the firm pays state and federal income taxes at a combined flat rate of 42%, borrows at 12% interest, and expects to pay no dividends.
Project next year’s income statement and balance sheet using the modified percentage of sales method.
SOLUTION: In this problem we’ll grow everything except net fixed assets by 15%. That means we’ll multiply the following items by 1.15: revenue, COGS, expense, all current assets, and all current liabilities. Then we’ll hold net fixed assets constant because of the assumption that the firm has excess capacity, and will just replace equipment that wears out. The result is reflected in the following incomplete statements.
Incomplete Statements for Next Year ($000)
INCOME STATEMENT BALANCE SHEET
At this point we’re at the debt/interest impasse. To complete the projection, we have to guess at interest and work through the procedure illustrated in the last section. This time, however, we have last year’s interest of $150,000 to use as a starting guess. That and Underhill’s other projected figures result in the following first iteration.
Debt/Interest Calculation—First Iteration ($000)
INCOME STATEMENT BALANCE SHEET
Next This Next
Year Year Year
Taking the average debt at 12% yields a calculated interest of approximately $86,000, which is considerably less than the $150,000 assumed. Two more iterations yield the following com- plete financial projection.
Revenue $15,617
COGS 8,591
Gross margin $ 7,026
Expense* 3,904
EBIT $ 3,122
Interest —
EBT $ —
Tax —
EAT $ —
*Includes marketing, engineering, and administration
196
ASSETS
Cash $ 400
Accounts receivable 1,953
Inventory 1,718
Current assets $4,071
Net fixed assets 2,460
Total assets $6,531
LIABILITIES & EQUITY
Accounts payable $ 144
Accruals 52
Current liabilities $
Debt —
Equity —
Total L&E $6,531
EBIT $3,122
Interest 150
EBT $2,972
Tax 1,248
EAT $1,724
ASSETS
Total assets $6,000 $6,531
LIABILITIES & EQUITY
Current liabilities $ 170 $ 196
Debt 1,330 111
Equity 4,500 6,224
Total L&E $6,000 $6,531
Underhill Manufacturing Company Next Year ($000)
INCOME STATEMENT BALANCE SHEET
Revenue $15,617 ASSETS
COGS 8,591 Cash $ 400
Gross margin $ 7,026 Accounts receivable 1,953
Expense* 3,904 Inventory 1,718
EBIT $ 3,122 Current assets $4,071
Interest 84 Net fixed assets 2,460
EBT $ 3,038 Total assets $6,531
Tax 1,276
LIABILITIES & EQUITY
EAT $ 1,762
Accounts payable $ 144
*Includes marketing, engineering,
Accruals 52
and administration.
Current liabilities $ 196
Debt 73
Equity 6,262
Total L&E $6,531
FORECASTING CASH NEEDS
Recall that a key reason for doing financial projections is to forecast the firm’s exter- nal financing needs. We can observe that need quickly in the preceding example by comparing Underhill’s beginning and ending debt balances for the forecast year. If the balance increases, the plan implies the firm will need more cash than it is generating through operations, and will have to borrow more. A decrease in debt implies that cash will be generated beyond the firm’s immediate needs, so debt can be paid down.10 In this example, Underhill is planning to generate $1,257,000 in cash, enough to pay down its debt from $1,330,000 to $73,000.
When a plan shows increasing debt, the implication is that additional external financing will be needed during the forecast year. Of course, the funds could be acquired by selling additional stock (equity) rather than borrowing. That would be reflected as an increase in the ending equity account beyond the addition of EAT to retained earnings, which in turn would reduce the amount of ending debt required to balance the balance sheet.
THE PERCENTAGE OF SALES METHOD—A FORMULA APPROACH
In Example 4.3 we used a modified percentage of sales method to create a financial projection based on an assumed growth in revenue and a separate assumption about fixed assets. If we’re willing to assume that net fixed assets also grows proportionately with revenue, the percentage of sales method can be condensed into a single formula for the purpose of estimating external funding requirements. We’ll call the formula theEFRrelationship for external funding requirement.
The idea behind the EFR relationship is very simple: A growing firm must have enough money on hand to purchase the new assets it needs to support its growth.
10. A negative figure for ending debt is possible and implies that cash will be generated beyond the firm’s beginning debt level. The negative debt would generally be shown as increasing the cash account.
However, that funding requirement is reduced by two automatic sources, (1) the amount by which current liabilities grow11and (2) the amount the firm earns during the year but doesn’t pay out in dividends.12In other words, for the year being planned (next year):
growth in assets
(4.1)
growth in current liabilities earnings retainedexternal funding requirement
Expression 4.1 is true for any financial projection, but can be written in simple terms when sales, earnings, assets, and current liabilities are all assumed to grow at the same rate, which we’ll call g.
We generally define g in terms of sales growth. That is, g increase in sales
salesthis year
For example, if this year’s sales are $100,000 and next year’s are projected to be
$115,000, g.15 or 15%.
In terms of expression 4.1, the assumption that assets and current liabilities grow at rate g means
(4.2)
growth in assetsgassetsthis year and(4.3)
growth in current liabilitiesgcurrent liabilitiesthis year (The following derivation of the EFR can be skipped without loss of continuity.Just resume reading at equation 4.6 or page 134.)
To develop an expression for current earnings retained in terms of profits and divi- dends, begin by recalling the expression for return on sales (ROS) (Chapter 3, page 89).
ROS EAT
sales Solve for EAT in terms of ROS and sales.
EATROSsales
Notice that since we’re assuming both EAT and sales grow at the same rate, ROS will remain constant from year to year. Then next year’s EAT can be written as the con- stant ROS times next year’s sales, which are just (1g) times this year’s sales. So
(4.4)
EATnext yearROS(1g)salesthis yearNext write the dividend payout ratio, which is defined as the ratio of dividends paid to EAT.
d dividends EAT The EFRrelation-
ship provides an estimate of fund- ingneeds assum- ing all financial items vary directly with sales.
11. Current liabilities are said to provide spontaneous financing, because they reflect the acquisition of assets that don’t have to be paid for immediately. We will examine this idea in more detail in Chapter 16.
12. In the unmodifiedpercentage of sales method, we shortcut the iterative debt/interest procedure by assuming EAT grows at the same rate as sales. This is equivalent to assuming that the return on sales ratio (ROS) stays constant.
From that definition, earnings (EAT) are split between those paid out as dividends, d(EAT), and those retained, (1d)EAT.13
Then for next year,
earnings retained(1d)EATnext year Substituting for EATthis yearfrom expression 4.4 yields
(4.5)
earnings retained(1d)ROS(1g)salesthis year Now, to get the EFR relation, rewrite expression 4.1 as an equation, substituting from 4.2, 4.3, and 4.5.EFRg(assetsthis year)
(4.6)
g(current liabilitiesthis year)[(1d)ROS][(1g)salesthis year] Although equation 4.6 looks messy, it’s easy to use because everything on the right side comes from this year’s financial statements and the growth rate assumption.
Reforecast the external financing requirements of the Underhill Manufacturing Company of Example 4.3, assuming net fixed assets and EAT grow at the same 15% rate as sales. However, also assume the firm plans to pay a dividend equal to 25% of earnings next year.
SOLUTION: First note Underhill’s sales, assets, and current liabilities for this year (page 130) as well as its payout ratio. Then calculate its return on sales. (Omit $000 as before.)
salesthis year$13,580 assetsthis year$6,000 current liabilitiesthis year$170 d25.0%
ROS 11.0%
Next write equation 4.6 and substitute.
EFRg(assetsthis year)
g(current liabilitiesthis year) [(1d)ROS] [(1g)salesthis year] EFR.15($6,000).15($170)
[(1.25)(.11)] [(1.15)($13,580)]
EFR $413.9
This result says that Underhill will generate enough funds during the projected year to reduce its debt by about $414,000.
$1,488
$13,580 EAT
sales
Example 4.4
13. The expression (1 d) is called the retention ratio.
It’s important to keep in mind that the EFR approach and the related unmodified percentage of sales method are of limited value because of the general impracticality of the assumption that everything varies directly with sales. To see that, notice that the $414,000 net cash flow in Example 4.4 is substantially lower than the forecast in Example 4.3 of $1,257 (see Forecasting Cash Needs on page 132 immediately follow- ing the example). About half of the $843,000 difference comes from the fact that we assumed a dividend in Example 4.4 that wasn’t in Example 4.3. The other half, how- ever, comes from the fact that the percentage of sales method forces an assumption of a 15% growth in Net Fixed Assets, which in this case is probably unrealistic.
THE SUSTAINABLE GROWTH RATE
A firm’s sustainable growth rateis a theoretical measure of its strength. It is the rate at which the firm can grow if none of its financial ratios change and if it doesn’t raise any new equity by selling stock. These conditions are equivalent to the assumptions of the unmodified percentage of sales method.
Sustainable growth is simply the growth in equity created by profits. We can develop an expression for the rate by noticing that business operations create new equity equal to the amount of current earnings retained. That can be written as
(1d)EAT
where d is the dividend payout ratio, the fraction of earnings paid to stockholders as dividends.
This implies a sustainable growth rate in equity, gs, equal to the amount of new equity created divided by equity itself.
(4.7a)
gsEAT (1d)equity from which
(4.7b)
gsROE(1d)because ROEEAT/equity.
Notice that although the idea of sustainable growth implies that no new equity is raised through the sale of stock, it does require new borrowing to keep the debt/equity ratio constant as equity grows through retaining earnings.
The value of the sustainable growth concept is largely theoretical. It gives an indi- cation of the determinants of a firm’s inherent growth capability. Recall from our study of Du Pont equations (Chapter 3, pages 92–96) that ROE can be written as
ROEROStotal asset turnoverequity multiplier Substituting this expression for ROE into 4.7b, we have
gs(1d)[ROStotal asset turnoverequity multiplier]
which can be written more explicitly as
(4.8)
gs(1d)Equation 4.8 says a firm’s ability to grow depends on four fundamentals:
A firm can grow at its sustainable growth ratewith- out selling new stock if its finan- cial ratios remain constant.
EAT sales
sales assets
assets equity
1. Its ability to earn profits on sales as measured by its ROS (EAT/sales)
2. Its talent at using assets to generate sales as measured by its total asset turnover (sales/assets)
3. Its use of leverage (borrowed money) as measured by the equity multiplier (assets/equity)
4. The percentage of earnings it retains as measured by (1d), the earnings retention ratio
These ideas can be used to analyze why a particular firm’s growth has been good or bad in relation to that of other firms.
For example, after having lower than average growth, Slowly Inc. might compare its sustainable growth rate with an industry average as follows.
total asset equity gs (1d) ROS turnover multiplier
Industry 13.5% .75 6% 1.2 2.5
Slowly Inc. 4.8 .40 8 1.0 1.5
Notice that Slowly’s sustainable growth rate is much lower than the average. The question is why. The comparison immediately shows that profitability is not the prob- lem, as Slowly’s ROS is better than average. It’s also apparent that total asset turnover is a bit low, but not enough to make much difference.
Slowly’s growth problem seems to be associated with its modest use of leverage.
The firm’s equity multiplier is substantially lower than average, meaning it is financed with proportionately less debt and more equity than other firms. Its earnings retention ratio, (1d), is also lower than average.
These things may explain why the firm isn’t growing rapidly. It’s paying most of its earnings out in dividends rather than reinvesting them in growth opportunities. At the same time, it’s constrained not to raise much money by borrowing. This is a low- risk strategy but it doesn’t lead to rapid growth.
PLANS WITH MORE COMPLICATED ASSUMPTIONS
The percentage of sales methods (modified and unmodified) are appropriate for quick estimates, but aren’t generally used in formal plans because they gloss over too much detail.
It’s usually possible to make intelligent estimates of a large number of individual items within a financial plan. Putting those separate pieces of intelligence into the projections clearly makes sense. That’s done by incorporating a series of detailed assumptions into the process. Each assumption is worked into the plan in a manner that depends on the way the related item is managed and on its accounting treat- ment. As an illustration, let’s take a closer look at the treatment of fixed assets for the Underhill Manufacturing Company of Example 4.3.
In that example we made the assumption that the firm had excess factory capacity, which implied that a certain amount of growth could be accommodated in the plant without adding new assets. Hence, net fixed assets could be expected to remain roughly constant. That assumption is reasonable but somewhat simplistic. It would rarely be used in a serious operating plan.
Real plansgener- ally incorporate complex assump- tionsabout impor- tant financial items.
Acquiring fixed assets calls for the commitment of large amounts of money, and tends to be analyzed very carefully. That means a great deal of information about fixed assets is usually available.
In fact, the business planning process generally includes a capital plan, a list of the assets and projects on which the firm intends to spend money during the coming period.
In the next example, we’ll assume a capital plan has been done for Underhill, and show how some of the information it contains can be worked into the financial plan.
Assume the following for the Underhill Manufacturing Company of Example 4.3.
1. The ending balance sheet for the current year contains the following fixed asset accounts.
Gross $5,600,000
Accumulated depreciation (3,140,000)
Net $2,460,000
2. Next year’s depreciation on the assets owned at the end of this year is $450,000, and there are no plans to dispose of old assets.
3. The capital plan indicates that assets will be acquired next year at an estimated total cost of $1.2 million.
4. The average depreciation life of the new equipment will be five years. Straight line depreciation will be used. Assume one-half year of depreciation will be taken on new assets in the first year to reflect less than a full year’s use.
Notice that items 1 and 2 are not