The author, developers and publisher have made every effort to ensure the accuracy and functionality of the text material and/or programs in this package;. The sole remedy for any claims is expressly limited to replacement of the book and only at the publisher's discretion.
Navigation 193
Flight Plan 249
Converting a Piston Engine
Good Practices and Lean
PREFACE
Runway Ready – Lights, Camera, Action
So move in the direction your heart desires, to the tune it sings and dances to. Flying is not about loving the smooth and hating the rough sky; as it turns out, indifference is the opposite of love, not hate.
Road Map
The mechanical forces applicable to the drones are discussed as the next step, followed by the introduction of the proportional, integral and derivative control concepts. If it weren't for those individuals, the Earth would still be flat and the center of the universe, with the Sun as one of its moons.
ACKNOWLEDGMENTS
C ONNECTION BETWEEN 1
A ERONAUTICS AND T HERMO -F LUID S CIENCES
- Thermo-Fluid Sciences
- A Brief History of Temperature Measurements
- Atmospheric Thermodynamics Through the Ages
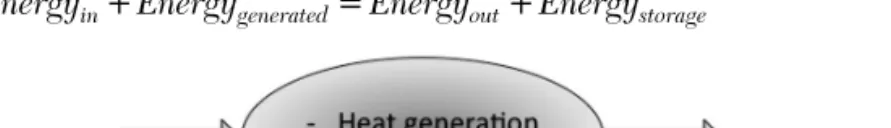
- Energy Balance
Samuel Pierpont Langley, an American astronomer, physicist, inventor of the bolometer, and pioneer of aviation, published a widely read article entitled "On the Moon Observations". On the other hand, internal energy is time-dependent (transient); focuses on the variation of the internal energy, which appears in the form of the heat capacity of the continuum.
M ETEOROLOGY
For Class G airspace for altitudes below 1,200 ft AGL, 3-mile visibility at night and Rule 152 apply. For Class G airspace for altitudes below 1,200 ft AGL, 1 statute-mile daytime and cloud-free visibility conditions apply.
C LIMATE AND A TMOSPHERIC T HERMODYNAMICS
Thermodynamics of Air
This movement is the result of convective air parcels mobilized by the heat radiation of the sun. Heat is transferred from the air part with a higher temperature to the one with a lower temperature.
Layers and Components of Atmosphere
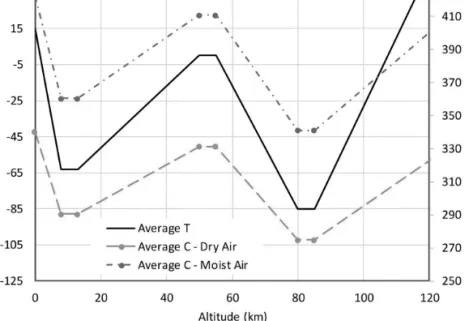
The uppermost layer of the stratosphere, where the temperature remains constant with increasing altitude, is called the stratopause. Water vapor is found mainly in the lower troposphere, up to a height of about 6 km from sea level - the thickness of this layer changes with latitude, falling over the tropics and rising over the poles.
Temperature
- Dry-Bulb Tempe rature
- Wet-Bulb Temperature
- Dew-Point Temperature
- Virtual Temperature
- Potential Temperature
- Isentropic-Saturation Temperature
- Speed of Sound
The thermodynamic definition of temperature (T) is then defined as the change in entropy (dS) relative to the change in internal energy (dE). Other factors, such as the composition of the atmosphere (e.g. carbon dioxide content), affect the speed of sound and thus the ratio between the speed in dry and moist air.
Pressure
- Static Pressure
- Stagnation Pressure
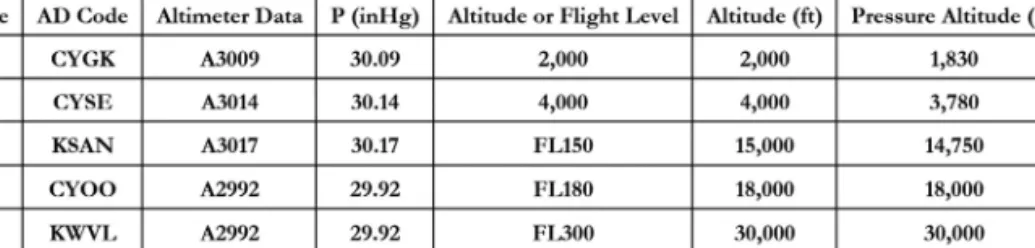
- Pressure Altitude
Stagnation pressure, also known as total pressure (Pt), is the pressure exerted by a fluid in motion. This pressure is equal to the standard pressure at an altitude of 2,080 ft (600 m) below MSL.
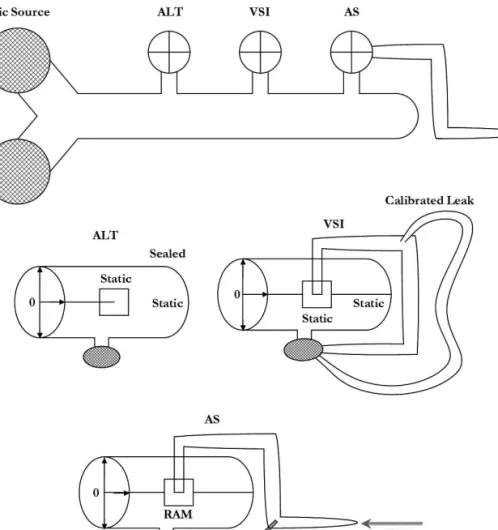
Speed of Aircraft
- Mach Number
- Indicated Airspeed
- Calibrated Airspeed
- True Airspeed
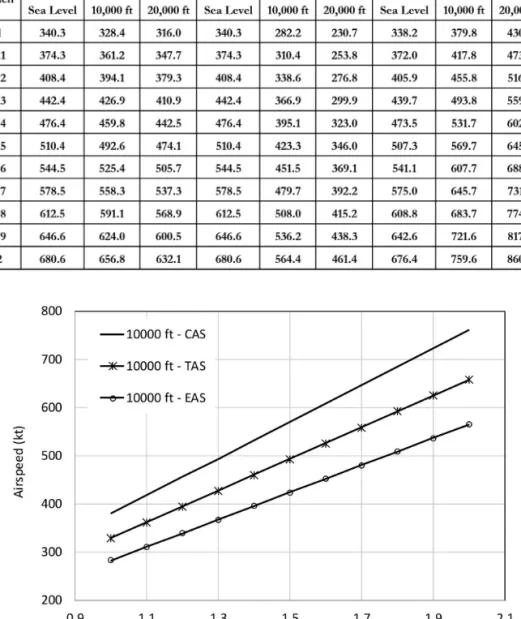
- Comparison of Different Airspeeds
The Mach number is a dimensionless quantity that is a ratio of an aircraft's TAS to that of the speed of sound under local conditions. For a compressible flow, equation (17) is used to calculate the IAS, where is the ratio between the heat capacities at constant pressure and those at constant volume.
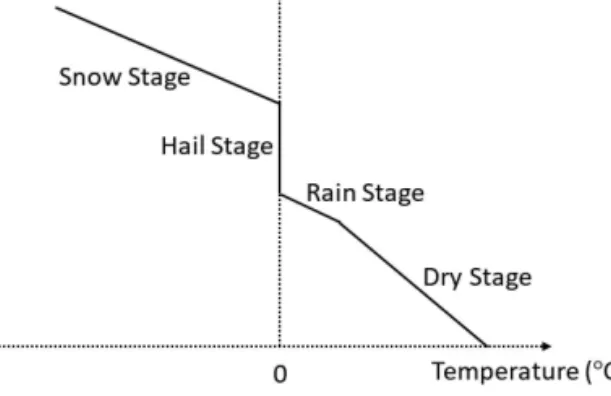
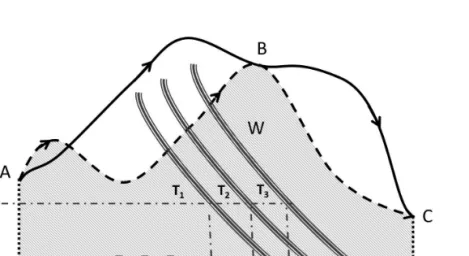
Lapse Rate
The air parcel still rises with a reduced rate of decay due to the release of the latent heat of vaporization during the rain phase. After the completion of the snow phase, where precipitation in the form of snow has left the air parcel, ie.
Density
- Specific Volume
- Density Altitude
Humidity
- Mixing Ratio
It can also be expressed as the ratio between the partial pressure of the vapor and the equilibrium state at constant temperature. On the other hand, the humidity ratio is the ratio of the mass of water vapor to the mass of dry air.
Enthalpy
- Static Enthalpy
- Stagnation Enthalpy
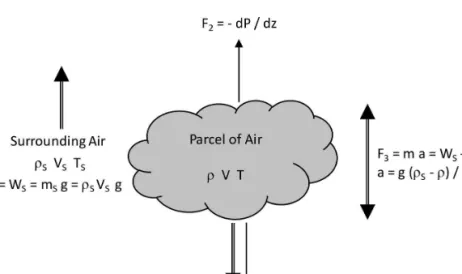
Stability
This scenario requires that the upward force exerted on the body by the surroundings and the downward force exerted on the air parcel by gravity are not equal—the difference is the acceleration force (F3 in Figure 9). Conversely, when the temperature of the air parcel is higher than the temperature of its surroundings, in this case the acceleration is positive, which means that the air parcel is accelerating upwards (unstable).
Examples
- Case Study – Pressure Altitude
- Case Study – Lapse Rate
- Case Study – Density Altitude
- Case Study – True Airspeed (TAS) versus the Calibrated Airspeed (CAS)
- Case Study – Passenger Luggage
Assuming that the parcel of air in figure 9 is homogeneous, which means that its density and therefore its volume do not vary in space (ie, horizontally or vertically), the condition that is possible in some hurricanes, you you can calculate the rate of transition for the homogeneous atmosphere by combining the hydrostatic relation - equation (32) - and the equation of state - equation (56) - P RT - to obtain equation (51), in which the homogeneous temperature gradient or the lapse rate is a function of the mass of the air parcel and the gas constant. As a result, the equation (52) is obtained, in which the homogeneous height is a function of the absolute standard temperature of the atmosphere, the mass of the air parcel and the universal molar gas constant. The density ratio can be used to calculate the forces due to the use of mercury versus air - the cross section of the tube does not change between the two scenarios.
Thermodynamics of Dry Air
For an isothermal process, equation (55) simplifies to equation (58) - also known as Boyle and Mariotte's law, which states that pressure and volume are inversely related at a constant temperature. For an isobaric process, equation (55) simplifies to equation (59) - also known as Charles' law, which states that absolute temperature and volume are inversely related at constant pressure. For an isochoric process, equation (55) simplifies to equation (63) - also known as Gay-Lussac's law, which shows that absolute temperature and pressure are inversely related at constant volume.
Thermodynamics of Moist Air
Weather Models
- Stüve Diagram
- Emagram
- Tephigram
- Skew-T Log-P Diagram
- Theta-Z Diagram
- Psychrometric Chart
The pressure to power of the heat capacity ratio (P ) (ordinate) decreases upward as a function of the reference point (100 kPa) versus temperature (abscissa) increasing to the right. FI GURE 18 The Skew-T log-P diagram as a tool for calculating the properties of moist air with a pressure range of 20 kPa to 100 kPa [97]. Three independent parameters including pressure level are needed to obtain other properties of moist air.
![FIGURE 15 Stüve Diagram as a means to calc ulate properties of the moist air with a pressure range of 20 kPa to 100 kPa [97].](https://thumb-ap.123doks.com/thumbv2/123dok/10237551.0/85.819.137.656.124.828/figure-stüve-diagram-means-ulate-properties-moist-pressure.webp)
Weather Reports
- METAR
- SIGMET
- PIREP
- AIRMET
- IWXXM
It is similar to the TAF and is issued by a person located at the associated airport and is valid for 3 hours [108]. It is similar to the TAF and is included at the end of a METAR report. A UA suffix is included at the beginning of the report to identify it as urgent.
Wind
Wind speed measurement on the ground is done using an anemometer consisting of a vertical column and four attached cups that can freely rotate around the column's vertical axis and capture the magnitude of the horizontal wind. The strength of the wind in crosswind situations is a determining factor in an aircraft's ability to land or take off safely. On the left side of the agony line – where the variation is zero – the westerly variations must be added to the wind data, while on the right side of the agony line the easterly variations must be subtracted from the wind direction data.
Examples
- Case Study – Temperature
- Case Study – METAR – Kingston, Ontario, Canada
- Case Study – TAF – Kingston, Ontario, Canada
- Case Study – Weather Report Time Zones
Q Wind direction and magnitude: Wind direction is true south-southwest from 190° with magnitude 10 kt–19010KT. Q Wind direction and magnitude: Wind direction is southwest from 200° with magnitude 5 kt–20005 KT. Q Levels and Cloud Cover: There is little cloud at 1000 ft AGL, meaning the cloud cover is between 1/8 and 2/8 at that level –.
![TABLE 11 Encoded METAR data [124].](https://thumb-ap.123doks.com/thumbv2/123dok/10237551.0/103.819.155.636.629.831/table-encoded-metar-data.webp)
- Airfoil Shape
- Angle of Attack
- Forces in Flight
- Examples
- Case Study – Drag and Lift Coefficients
- Case Study – Balance of Forces and Wind Interference
This causes the lift force to rotate away from the vertical axis with the angle of the bank. In this attitude there will be a component of the weight parallel to the direction of motion (mgSin), which can compensate for a fraction of drag (in a powered case) or all the drag (for a glider), as in equation (84). This example considers the balance of the forces in the direction of the aircraft motion.
![FIGURE 26 Exa mple of lift and drag curves versus the angle of attack for the Clark Y airfoil design at an aspect ratio of 6 (raw data extracted from [131]).](https://thumb-ap.123doks.com/thumbv2/123dok/10237551.0/111.819.152.642.588.869/figure-curves-versus-attack-clark-airfoil-design-extracted.webp)
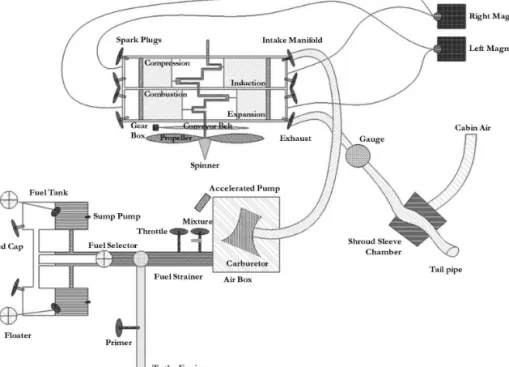
P ISTON E NGINE AND C OMBUSTION P ROCESS
Piston Engine
- Alternator
- Fuel System
- Carburetor and Venturi Tube
If the air passage is blocked for any reason, such as the accumulation of ice and debris in the air duct inlet, fuel starvation can occur. The ratio of fuel to air is the determining factor in whether the combustion process is efficient. The flow of the air-fuel mixture is then controlled by a butterfly (throttle) valve connected to the throttle control lever.
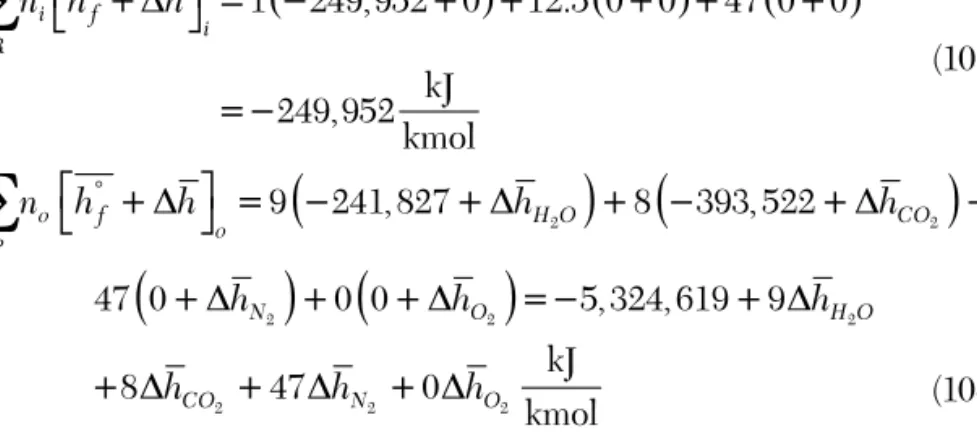
Combustion Process
Spark plugs ignite the air-fuel mixture at the end of the compression stage in a piston engine. For example, when carbon dioxide is produced from the elements oxygen and carbon, the enthalpy of formation of the product carbon dioxide is the amount of heat required to create it by combining the reactants. Details of the models are presented in the case studies at the end of this section.
![TABLE 21 Heat values of common AVGAS fuels (“l” and “g” stand for liquid and gas) [135,136,137,138].](https://thumb-ap.123doks.com/thumbv2/123dok/10237551.0/138.819.189.664.495.941/table-heat-values-common-avgas-fuels-stand-liquid.webp)
Engine Performance
This is followed by an increase and decrease in the temperature and pressure of the fuel mixture in the cylinder. The ratio between the maximum volume in the combustion chamber and the minimum volume is the compression ratio (r V1/V2 in Figure 40). Engine efficiency () is given by equation (101), where is the ratio between heat capacity at constant pressure and heat capacity at constant volume.
Examples
- Case Study – Octane Fuel Analysis
- Case Study – Octane-Heptane Fuel Analysis
- Case Study – Exhaust Gas Temperature
- Case Study – Piston Engine
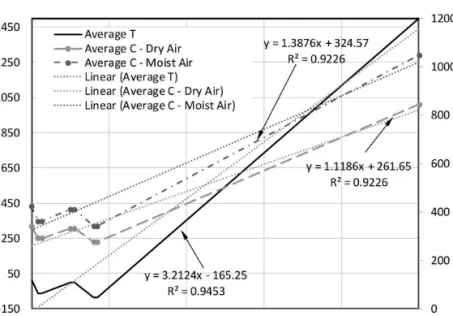
However, it is possible to predict the adiabatic flame temperature trend by combining the three sets of data given a valid trend based on the linear relationship (Figure 44) or power relationship (Figure 45) to present the mass ratio of actual air vs. theoretical air vs. heat release. It is possible to plot the total heat release as a function of the combustion temperature or the actual air mass ratio to the theoretical air (A/At) (Figure 44 and Figure 45). The heat release as a function of temperature given by equation (108) in kJ/kmol can be multiplied by the molecular mass in kmol/kg of the fuel to obtain the energy per mass of fuel (kJ/kg)—also.
U NMANNED F LYING O BJECTS
UAVs Through the Ages
Germany produced a variety of UAVs during World War II (eg the V-1 flying bomb, also known as the buzz bomb, maybug, cherrystone, and doodlebug). During the war of attrition between Israel and Egypt, the use of drones expanded with the addition of surveillance cameras. The use of unmanned aerial vehicles without the lives of aircrew further expanded during the second Gulf War in 1991.
Satellites
Equation (117) shows the relationship between the orbital velocity (v), mass of the parent (celestial body) whose object orbits it (mh), and R, the radius of the celestial body. Note that the Earth's rotation plays a partial role in generating the jet stream. Note the increase in acceleration with decreasing distance from the center of the Earth.
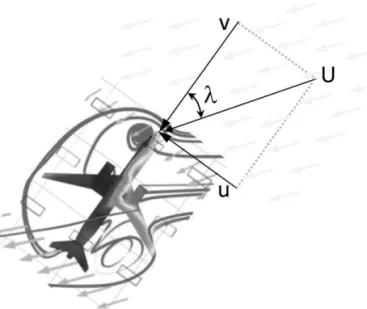
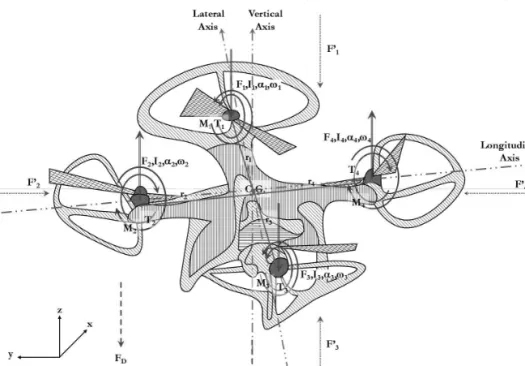
Drones
Equation (121) can be written in the form of equation (122), where y is the second derivative of the position vector (y) along the y-coordinate—. In order for the drone to move horizontally, it must be tilted forward so that the thrust vector has a component in the direction of motion. Equation (133) can be rewritten to represent the time-dependent acceleration vector (u(t)) as a function of the remaining parameters - Equation (134) - Figure 68.
Examples
- Case Study – Distance between Two Aerodromes
- Case Study – Planetary Data
- Case Study – Orbital Data for the Largest Moons
- Case Study – Single-Rotation Angular Velocity
- Case Study – Double-Rotation Angular Velocity
The density is obtained by dividing the mass of the celestial body (mh) by its volume e (V) ( mh/V), assuming a spherical shape. A planetary day, expressed in Earth days, is the ratio of a planetary day to an Earth day (24 hours). The circular orbital velocity is obtained from voc Gmhp/R d where mhp is the mass of the celestial parent (eg Earth is the parent of the Moon).
![TABLE 26 Seven largest moons and ISS, periods and orbital velocities [156].](https://thumb-ap.123doks.com/thumbv2/123dok/10237551.0/184.819.168.690.268.466/table-seven-largest-moons-iss-periods-orbital-velocities.webp)
P ERFORMANCE C HARTS
Statistical Analysis Through the Ages
The use of a calculator for regression analysis began in the 1950s, and the solutions were reported to take up to 24 hours at times. For example, it is possible that the TAF reports the visibility of an aerodrome as marginal VFR when it is in fact an IFR condition. It is possible to predict base ceiling and surface winds using MOS; however, the multiple ceiling predictions that TAFs can provide are not possible.
Statistical Analysis of Performance Data
- Pressure Altitude and Temperature
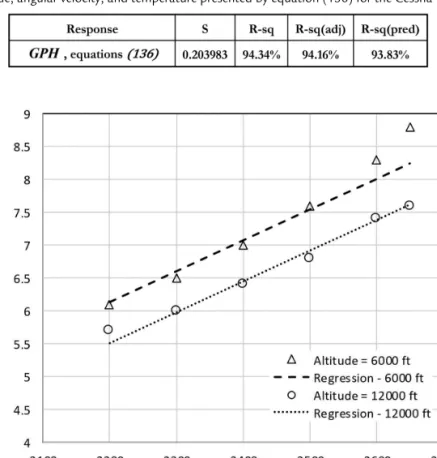
A summary of regression analysis is usually given in the form of a table showing the variance (the mean of the squared deviation), the squared of the variance, the sum-squared (summation of the errors squared), and the root-mean-square of the data. The R2 value describes the proportion of the variance in the dependent variable that the model can predict from the independent variables. Let's examine a relatively simple example of a regression analysis of the temperature variation with altitude.
![TABLE 27 Performance data for Cessna 172M [157,158,159,160].](https://thumb-ap.123doks.com/thumbv2/123dok/10237551.0/191.819.154.633.539.936/table-performance-data-for-cessna-m.webp)
Cruise Performance
- Rate of Fuel Usage
- Brake Horsepower
- True Airspeed (TAS)
It can be seen that the fitted diagram closely matches the regression analysis results presented by equation (135). The output of the regression model is plotted with dotted lines or dotted lines, while the raw data is represented by hollow circles or triangles. The output of the regression model is plotted with dotted lines or dotted lines, while the raw data is represented by hollow circles or triangles.
![FIGURE 16 Emagram as a means to calculate pro perties of the moist air with a pressure range of 20 kPa to 100 kPa [97].](https://thumb-ap.123doks.com/thumbv2/123dok/10237551.0/87.819.128.664.112.843/figure-emagram-means-calculate-perties-moist-pressure-range.webp)
