1
Fission-fusion Processes Weaken Dominance Networks of Female Asian Elephants In A 1
Productive Habitat 2
3
Shermin de Silva1,2,3*, Volker Schmid4, Wittemyer1,5 4
5
1 Colorado State University, Department of Fish Wildlife and Conservation Biology 6
*Corresponding author: [email protected] 7
2 EFECT, Colombo, Sri Lanka 8
3Smithsonian Conservation Biology Institute, 1500 Remount Road, Front Royal VA, 22630, 9
USA (current address) 10
4 University of Regensburg, Germany 11
5 Save The Elephants, Nairobi, Kenya 12
13 14
Abstract 15
16
Dominance hierarchies are expected to form in response to socioecological pressures and 17
competitive regimes. We assess dominance relationships among free-ranging female Asian 18
elephants (Elephas maximus) and compare them to those of African savannah elephants 19
(Loxodonta africana), which are known to exhibit age-based dominance hierarchies. Both 20
species are generalist herbivores, however, the Asian population occupies a more productive and 21
climatically stable environment relative to that of the African savannah population. We expected 22
this would lower competition relative to the African taxon, relaxing the need for hierarchy. We 23
tested: 1) whether observed dominance interactions among individuals were transitive 2) whether 24
outcomes were structured either by age or social unit according to four independent ranking 25
methods and 3) whether hierarchy steepness among classes was significant using David’s Score.
26
E. maximus displayed less than a third the number of dominance interactions as observed in L.
27
africana, with statistically insignificant transitivity among individuals. There was weak but 28
significant order as well as steepness among age-classes, but no clear order among social units.
29
2
L. africana showed significant transitivity among individuals, with significant order and 30
steepness among age-classes and social units. E. maximus had a greater proportion of age- 31
reversed dominance outcomes than L. africana. When dominance hierarchies are weak and 32
nonlinear, signals of dominance may have other functions, such as maintaining social 33
exclusivity. We propose that resource dynamics reinforce differences via influence on fission- 34
fusion processes, which we term “ecological release.” We discuss implications of these findings 35
for conservation and management when animals are spatially constrained.
36 37
Keywords: Hierarchies, ranking algorithms, socioecology, social dominance, triads, ecological 38
release 39
40
3 Background
41 42
Competition for resources can lead to self-organizing mechanisms, such as the formation 43
of dominance hierarchies, by which individuals minimize the costs and likelihood of conflicts, 44
making foraging or mate searching more efficient (Sutherland 1996; Hemelrijk 1999; Chase et 45
al. 2002; Bradbury & Vehrencamp 2014). While reproductive dominance (skew), concerns the 46
distribution of reproduction (Vehrencamp, 1983), social dominance is a system for settling non- 47
reproductive conflicts (Hand 1986; Drews 1993). While social dominance as well as 48
reproductive skew among males may be largely governed by individuals’ age- or size-related 49
physical ability to monopolize resources or females (Emlen & Oring 1977; Boehm 1999;
50
Clutton-Brock & Huchard 2013), other system-specific competitive factors are thought to shape 51
female relationships (Kappeler & van Schaik, 2002; Payne et al. 2003). Here we focus on the 52
structure of social rank hierarchies among females.
53 54
Socioecological models originally derived from studies of ungulates, and attempted to 55
explain the ecological factors shaping social systems (Geist 1974; Jarman 2010). Subsequently, 56
they have focused on the interaction of predation, intra-specific competition, and social pressures 57
including infanticide in driving both female gregariousness as well as their dominance relations, 58
particularly in primates (Broom et al. 2009; Isbell & Young, 2002; Koenig et al. 2013; Sterck &
59
Watts, 1997; van Schaik & van Hooff, 1983; Wrangham, 1980). Strong hierarchies are expected 60
where resources are monopolizable and there is strong competition within and between groups 61
while egalitarian systems are expected when resources are non-monopolizeable and thus favor 62
individual dispersal, when strong between-group competition favors philopatric resource 63
4
defense, or both (Koenig et al., 2013; Sterck & Watts, 1997). In this context, ‘despotic’ societies 64
are those in which social hierarchies are strongly linear, whereas ‘egalitarian’ ones are those in 65
which linearity is statistically insignificant (de Vries et al. 2006; Hand, 1986; Hemelrijk, 1999).
66
However, linear hierarchies appear to be commonplace across diverse taxa (Shizuka &
67
McDonald, 2012) irrespective of foraging ecology, suggesting other critical factors may be at 68
play. For instance, water rather than forage can be a limiting resource for ungulates and thus a 69
key determinant of movements (Rubenstein 1994; Wittemyer et al. 2008; Loarie et al. 2009a;
70
Shrader et al. 2010; Rubenstein et al. 2015), whereas many nonhuman primates seldom need to 71
drink. Gaps in our understanding of how ecological conditions relate to gregariousness and 72
dominance therefore persist despite decades of effort, particularly with respect to the egalitarian 73
end of the spectrum. Broader taxonomic perspective may provide more general insights into the 74
factors that regulate hierarchy formation than clade-specific treatments (Silk 2007; Clutton- 75
Brock & Janson 2012).
76 77
Proboscideans present an interesting clade for exploring socioecological models as they 78
share similarities with both primates and ungulates. Gregariousness among African savannah 79
elephants is favored in their relatively open environments due to the vulnerability of calves to 80
large nonhuman predators and that of adult elephants to humans, which have co-evolved as their 81
top predators (Power & Compion 2009; Ben-Dor et al. 2011). Asian elephants, which generally 82
occupy more closed environments with historically few direct predators, generally favor 83
crypticity and smaller, less conspicuous aggregations (de Silva & Wittemyer 2012). Females 84
usually do not face harassment from males except during their oestrus periods, which are 85
minimally spaced two years apart due to lengthy gestation and nursing periods (de Silva et al.
86
5
2013) and therefore favors a roving male strategy. Like female-bonded primates, female African 87
savannah elephants (Loxodonta africana) and Asian elephants (Elephas maximus) maintain 88
extensive networks of social relationships, typically, though not always, among related matrilines 89
(Fernando and Lande 2000; Wittemyer et al. 2005; Vidya and Sukumar 2005; Archie et al. 2006;
90
Wittemyer et al. 2009; de Silva et al. 2011; de Silva and Wittemyer 2012). Both species are 91
generalists capable of consuming a diverse diet alternating among graze, browse and fruit 92
depending on season and geography (Loarie et al. 2009; Campos-Arceiz and Blake 2011). Like 93
equids, elephants are hind gut fermenters and thus require a constant source of forage. But unlike 94
many ungulates or primates, their dietary flexibility potentially allows greater behavioral 95
flexibility. Although there is no discernible reproductive skew among females (de Silva et al., 96
2013; Moss & Poole 1983), African savannah elephants exhibit clear dominance hierarchies, 97
which are age/size-based and weakly nepotistic in apparent contrast to expectations under 98
socioecological models (Archie et al. 2006; Wittemyer & Getz 2007), indicating that within- and 99
between-group competition is greater than gross foraging ecology would initially suggest. The 100
nature of dominance relations among Asian elephants has not previously been described, 101
presenting an opportunity for understanding what governs hierarchies among large-bodied, non- 102
territorial, wide-ranging species. Here we compare social dominance behavior in female Asian 103
and African elephants at the individual and population levels.
104 105
E. maximus are physically and ecologically similar to L. africana as mega-herbivores, 106
with an evolutionary divergence time of approximately six million years (Shoshani & Tassy 107
1996). A naïve expectation based only on their generalist feeding habits and morphological 108
similarities would be that hierarchies in Asian elephants should resemble those in African 109
6
elephants, structured either by age (correlated with size) or family unit. However, the Asian 110
species occupies habitats that are generally more mesic than the African savanna species, with 111
more predictable rainfall regimes and fewer non-human predators. Patchy, scarce resources, as 112
found in more xeric systems, are hypothesized to impose ecological constraints on group sizes 113
(Rubenstein 1994; Chapman et al. 1995; Faulkes et al. 1997; Rubenstein et al. 2015). If group 114
size and stability increases with ecological productivity and stability, one would hypothesize that 115
Asian elephants could form larger aggregations, with more stable intraspecific bonds and 116
dominance hierarchies than African savannah elephants, given their wetter and more predictable 117
environments. However, group living is itself costly (Alexander, 1974) due to factors such as 118
increased local competition and higher risk of exposure to pathogens, which must be 119
compensated for by other benefits. Female Asian elephants, in fact, exhibit very dynamic fission- 120
fusion contact patterns where social affiliates are often split up among smaller aggregations at 121
any given time (de Silva et al., 2011), with less discrete stratification than observed in African 122
populations (de Silva & Wittemyer 2012). The greater fluidity of associations among Asian 123
elephants, coupled with the generally higher availability of resources may make despotic 124
relationships avoidable, unlike among female savannah elephants. First we test whether the 125
outcomes of dominance interactions among individual females are more linear than expected by 126
chance, then we examine whether they are ordered either by age or social unit. We compare 127
results from the two elephant species, discussing the insights they offer for understanding what 128
drives dominance hierarchies. Finally we discuss the practical implications for conservation and 129
management of E. maximus in the wild and in captivity.
130 131
Methods 132
7 133
Study site 134
135
Road-based field observations of Asian elephants were conducted from January 2007- 136
December 2012 (805 field days) at Uda Walawe National Park (UWNP), located in south-central 137
Sri Lanka. UWNP receives 1510 mm of annual precipitation on average, and surrounds a large 138
man-made reservoir and several smaller water sources situated on the Walawe river. All water 139
sources, including the main reservoir, dry out substantially or completely during the dry seasons, 140
which generally occur from May-September. Elephants aggregate periodically during dry 141
seasons to use the dry reservoir bed for forage as well as remnant water and mud. Mature trees or 142
vines bearing large fruits accessible to elephants are rare or absent within the UWNP, however 143
clusters of seed pods produced by B. racemosa are consumed by elephants. At the time of the 144
study, the protected area contained tall grassland and a dense understory shrub community, with 145
small tracts of open-canopy deciduous forest. Leopards are the largest terrestrial non-human 146
predators found in Sri Lanka, and occur within the protected area but are not known to pose a 147
threat to elephants.
148 149
Data collection 150
151
The study population consisted of 286 known adult or sub-adult females and their calves 152
as well as periodic seasonal occupants. Identities of all known individuals within an observed 153
group were recorded upon encounter. All individuals were assigned to 10 year estimated age 154
classes (Table 1 & Figure 2 in de Silva et al. 2013). Analyses were based on 1923 hours of focal 155
8
animal sampling (Altmann 1974) as well as behaviors among non-focal individuals and group- 156
level responses recorded ad libitum. Specific behaviors included all forms of social interaction, 157
feeding, water-associated behavior, wallowing, dust bathing, resting and movement. The 158
majority of dominance interactions occurred among non-focal subjects and were therefore 159
recorded with all-occurrence sampling (Altmann 1974). We included indicators of dominance as 160
well as subordination where the former were defined as supplants or displacements at localized 161
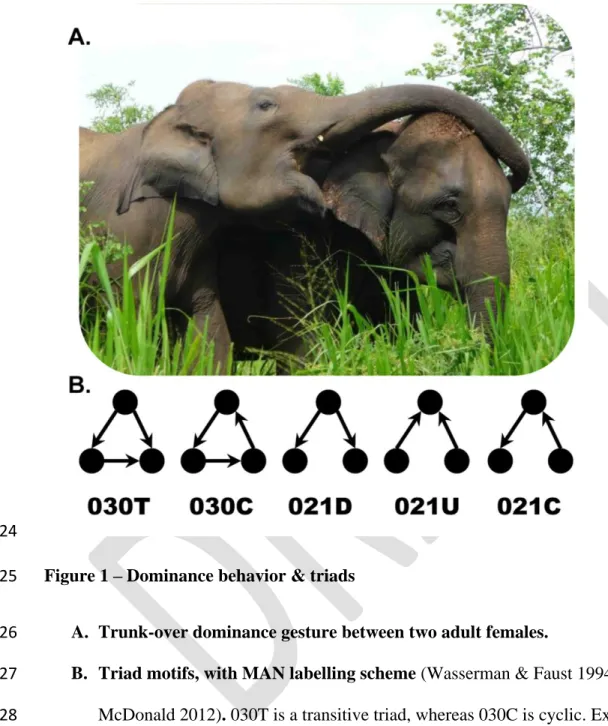
resources, gestures (trunk over the head, neck or back of the other individual, Figure 1A), and 162
overtly aggressive behaviors (pushing, chasing, grabbing the tail with the trunk, and attempts to 163
bite or poke the other individual; video at http://youtu.be/yjgtjiBEWuU). Indicators of 164
subordination were freezing upon being approached or touched, head-shaking, turning away 165
when approached, looking over the shoulder, backing or moving away, and avoidance at a 166
resource (such as waiting to approach a water source until it had been vacated by another). If a 167
series of interactions occurred during a particular event, the winners/losers were determined only 168
upon conclusion of the event, when individuals or groups moved apart.
169 170
We compared dominance interaction patterns among female Asian elephants to those of 171
female African elephants at Samburu and Buffalo Springs National Reserves, Kenya, described 172
by Wittemyer & Getz (2007). This savannah ecosystem receives on average 350 mm of rainfall 173
and is situated along the Ewaso N'giro River. Dominance interactions were observed from 2001- 174
2003, during 1161 hours of focal monitoring over 206 field days (5.5 hours per day on average).
175
Sampling focused on between-group interactions and dominance interactions were also recorded 176
ad libitum apart from focal observations. General behavioral classifications were analogous to 177
9
those described above but only agonistic interactions were used to determine dominance 178
outcomes.
179 180
In the Asian dataset, both agonistic and submissive behavior included 75 interactions 181
among 74 females aged 11 to 60< (six age classes), distributed among 28 social units. The 182
African dataset contained 264 agonistic interactions among 66 females aged 12 to 55 (five age 183
classes) and 34 social units. To control for the difference in number of observed interactions 184
between the two systems, we repeated analyses with a randomly downsampled African dataset 185
containing 75 interactions, which then included only 53 individuals. We did not match both the 186
number of interactions and the number of individuals, as this would introduce artificial distortion 187
to density of the L. africana network.
188 189
Data analysis 190
191
Binary dominance matrices were constructed for both species by assigning the value 1 to 192
the individual that won the majority of interactions for any given dyad and 0 to the other. Where 193
dyadic dominance status was not clear (because outcomes were tied), the matrix elements were 194
both assigned 0.5 (this occurred only among African elephants). The matrix included only 195
individuals that were involved in at least one dominant/subordinate interaction, excluding the 196
majority of individuals in the population. In addition, many matrix elements were empty where 197
individuals were never observed to interact (see results).
198 199
10
Because sparsity in matrices distorts or precludes standard tests of linearity (de Vries et 200
al. 2006; Shizuka & McDonald 2012; Wittemyer & Getz 2006), we tested dominance at the 201
individual-level using network triad motifs (Shizuka & McDonald 2012; Wasserman & Faust, 202
1994) (Figure 1B). Transitivity is a property of triads whereby A>B , B>C and A>C. Cyclicity 203
is a property of triads whereby A>B, B>C and C>A. Multiple transitive relations that are 204
consistent with one another yield an orderly linear hierarchy, whereas cycles disrupt linearity.
205
Order and transitivity are related but not synonymous; all transitive systems are ordered but a 206
system with consistent cycles, such as the rules governing the rock-paper-scissors game, can be 207
ordered but not transitive. Shizuka & McDonald’s (2012) technique examines the network 208
context of dominance interactions, comparing the observed to the expected proportion of 209
transitive vs. cyclic triads through randomization with the expectation that the greater the degree 210
of transitivity, the greater the linearity within a system. We further extended this technique to 211
incomplete triads. For incomplete, two-edge motifs, we assessed transitivity by comparing the 212
proportion of motifs representative of transitive triads (double dominants or double subordinates) 213
relative to those which could represent either cyclic or transitive triads (pass-along motifs). To 214
generate the expected null distribution for each motif, the winner of each pairwise interaction 215
was randomized such that each individual had equal (0.5) probability of winning. 10,000 216
randomized datasets were generated and the frequencies of each type of motif in the observed 217
and randomized datasets through triad census were assessed using the Statnet package in R 218
v.3.03. Mutual edges (tied relationships) were not considered (Shizuka & McDonald, 2012). We 219
rejected the null hypothesis that the observed frequencies of triad motifs could be obtained by 220
chance if the Euclidean distance between the observed set of triad motifs and the centroid (mean) 221
of randomized datasets was greater than or equal to the distance between the centroid and 95% of 222
11
randomized datasets. We used this rather than the simple Chi Square test for goodness of fit in 223
order to avoid making assumptions about the underlying distribution. Tests were performed in R 224
v.3.0.03 (R development core team, 2012).
225 226
We next tested whether rank orders corresponded to individuals classified by age or 227
social unit. In the African dataset ‘social unit’ refers to second-tier units generally understood as 228
families comprising one or more matrilines with high rates of association (Archie et al. 2006;
229
Wittemyer et al., 2005; Wittemyer et al., 2009). In the Asian dataset, ‘social unit’ refers to sets 230
of individuals who are statistically clustered together based on their multi-year association rates.
231
Such units also likely consist of maternal relatives (Fernando & Lande 2000; de Silva et al. 2011;
232
de Silva & Wittemyer 2012). The triad-motif test could not be used because there are far fewer 233
classes than there are individuals; the test would therefore have little statistical power. Instead, 234
we aggregated outcomes by class, such that each cell in the dominance matrix represented the 235
sum total of wins by individuals of one class against individuals of another (Figure S1). We refer 236
to these as matrices “collapsed” by class. Note that although the original dominance matrices 237
were binary, the collapsed matrices are not, a condition necessary for statistical testing 238
(discussed below). Also, as interactions between members of the same class were discarded in 239
the process of collapsing, the total remaining number of interactions among classes differed 240
between age- and social-unit-collapsed matrices.
241 242
We assessed hierarchy linearity among classes with h’, the modified version of Landau’s 243
h (de Vries 1995). We then tested rank differentiation among classes (age or social unit) by 244
treating them statistically as individuals. We calculated David’s Score as a basis for evaluating 245
12
steepness, a measure of the degree of rank differentiation among classes (David 1987; David 246
1988; de Vries et al. 2006). We tested the significance of hierarchy steepness through 247
randomization (de Vries et al. 2006), using a binomial distribution of dyadic winning proportions 248
together with a correction for chance (detailed in Appendix 2).
249 250
We further devised an alternative statistical test to determine whether there was 251
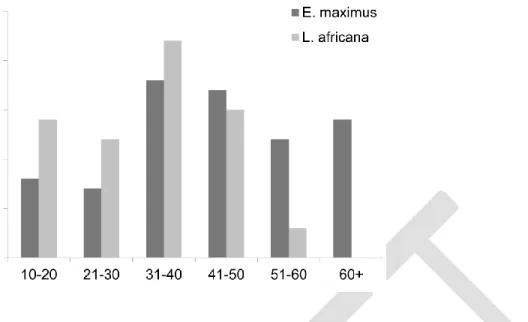
significant ordering among classes. We reordered the collapsed matrices using four different 252
ranking methods: the I&SI method (Schmid & de Vries, 2013), the Batchelder-Bershad-Simpson 253
index (henceforth BBS, (Jameson et al. 1999)), Colley’s Rating method (henceforth CRM, 254
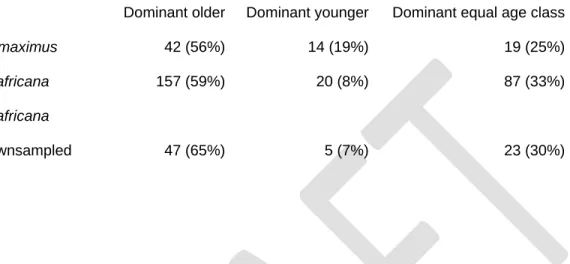
(Langville & Meyer, 2012)), and the Park-Newman Index (henceforth PNI, (Park & Newman, 255
2005)). The four different algorithms were employed to ensure robustness of results. We then 256
calculated the sum-of-reversals (SOR), i.e. the sum of entries which fall below the diagonal 257
under a particular order (Figure S1). This quantity is the total number of directional interactions 258
that are opposite the overall rank order. The more ordered a system, the fewer reversals it should 259
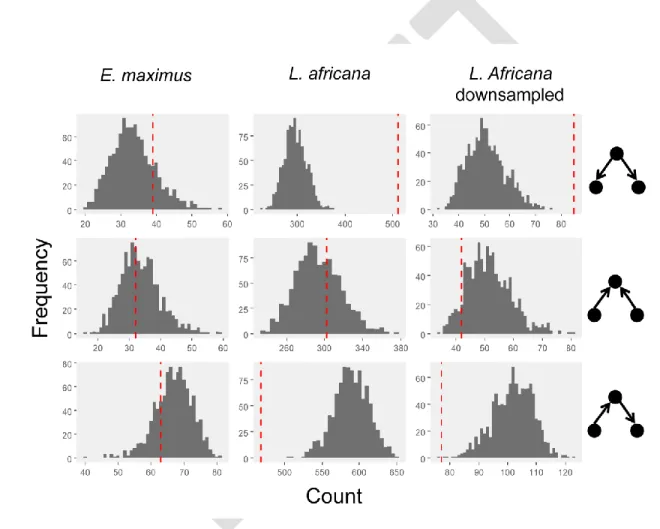
have. We rejected the null hypothesis that a dataset is ordered by class if the observed SOR was 260
less than the SOR obtained in randomized datasets with a one-sided significance threshold after 261
Bonferroni correction for multiple testing set at 0.00625. Henceforth we shall refer to this test as 262
the Sum-Of-Reversals test, or SOR test. For any particular collapsed dominance matrix – 263
observed or randomized – these ranking methods might yield multiple equivalent orderings of 264
classes. In such cases, we calculated the mean SOR from a sample of equivalent orders 265
(Appendix 1). To test whether the dominance outcomes we observed were more orderly than 266
expected by chance, we compared the observed SOR for a particular matrix with the SORs 267
obtained through 10,000 randomized datasets, where the SOR values were calculated under each 268
13
of the four algorithms. Linearity, steepness and SOR tests were performed in Excel using an 269
extended version of DomiCalc (Schmid & de Vries 2013), which is included in a supplementary 270
file. All p-values are one-tailed.
271 272
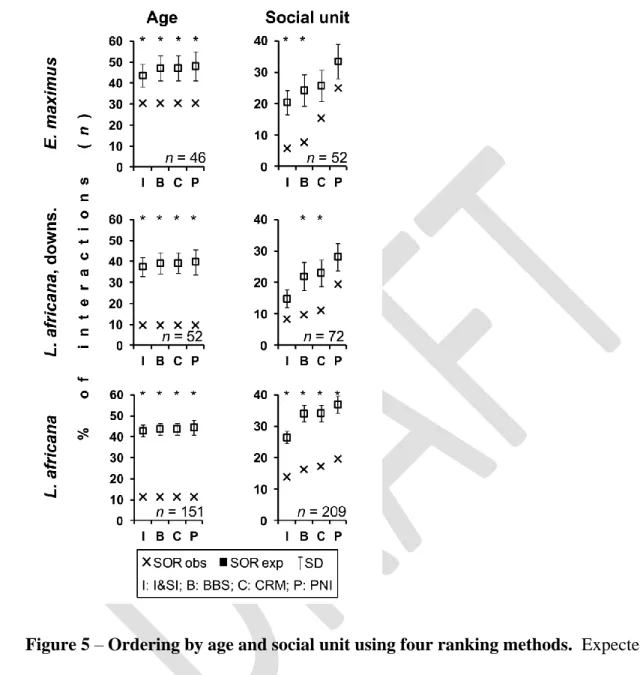
Results 273
274
The distribution of age classes that participated in dominance interactions was 275
significantly different between the two systems (Figure 2) with the L. africana dataset lacking 276
individuals in the 60+ age class due to low survivorship in older age classes (Wittemyer, et al.
277
2013). The direction of outcomes with respect to the age class of interacting individuals was 278
significantly different between the two populations (Table 1), with the Asian population showing 279
a higher proportion of age-reversed wins (Table 1, Figure 3).
280 281
Ordering by individual 282
283
The observed frequencies of each triad motif (Table 2) in the Asian dataset were no 284
different than expected by chance (randomization test using Euclidean distance among means, 285
p=0.64), whereas they were significantly different for the African dataset (p<0.001). This result 286
was upheld even for the downsampled African dataset and driven primarily by the frequency of 287
double-dominant (more common than expected, transitive) and pass-along (less common than 288
expected, could be either transitive or cyclic) triads, whereas both the Asian and African datasets 289
were similar with respect to double-subordinate motifs (Figure 4).
290 291
14 Ordering by class
292 293
None of the datasets showed significant linearity either by age or social unit when 294
assessed with h’. However, steepness (assessed using David’s Score corrected for chance) 295
collapsed by age as well as social unit for the Asian dataset were both significantly greater than 296
expected (one-sided α=0.025; page<0.005, psocial < 0.01; Table S1). The African datasets were 297
likewise significantly steeper than expected by chance for age and social unit (p<0.0001, Table 298
S1). This also held true for the downsampled dataset (page <0.0001, psocial<0.001).
299 300
For the Asian dataset, there was agreement among all four ranking methods that 301
dominance outcomes were significantly ordered by age (SORobs<SORexp, p<0.00625 α-threshold 302
after Bonferroni correction for multiple testing), while significant ordering by social unit was 303
indicated by three of the four ranking methods employed (Figure 5, BBS and I&SI: p=0.0001;
304
PNI: p=0.0390; CRM: p=0.0091). In contrast, the full African dataset showed significant 305
ordering both by age and by social unit across all ranking methods (p<0.0001; Figure 5). The 306
downsampled African dataset was consistent with these results when ranked by age (p<0.0001), 307
but only half the ranking methods showed significant order by social unit (BBS: p=0.0010;
308
CRM: p=0.0007; PNI: p=0.0145; I&SI: p=0.0218).
309 310
Discussion 311
312
Many ungulates as well as primates do not readily conform to a simplistic 313
socioecological model in which gross foraging ecology acts as a proxy for the degree of 314
15
competition individuals experience. Linear dominance hierarchies are commonly observed even 315
among species feeding on seemingly uniform and widely-dispersed resources and do not have a 316
clear relationship with levels of agonism, presenting a challenge for socioecological models 317
(Wheeler et al. 2013; Clutton-Brock & Janson 2012; Koenig & Borries 2009; Thierry 2008).
318
Despite their generalist diet, African savannah elephants exhibit strong linear dominance 319
hierarchies within and between social groups where older, taller individuals are more dominant, 320
likely because resource competition among individuals and groups is in fact salient (Archie et al.
321
2006; Wittemyer & Getz 2007). However, because group living is inherently costly, one would 322
expect the tendency to fission would be stronger under ecological conditions that make dispersal 323
easier. In such situations, it would be difficult to exert and maintain strict hierarchies. We tested 324
whether similar patterns hold for an Asian elephant population which shares analogous feeding 325
habits but occupies an environment where forage, water availability and seasonal predictability 326
of rainfall is greater and where large non-human predators are absent.
327 328
The most striking quantitative and qualitative difference between the taxa at the 329
individual level was the rarity of transitive motifs within the Asian population (Figure 4). Rather, 330
they demonstrated a distribution of triadic motifs which could not be statistically distinguished 331
from chance. In contrast, the African population exhibited triad motifs consistent with 332
transitivity, as expected based on prior studies (Archie et al. 2006; Wittemyer & Getz 2007), a 333
result robust to downsampling which matched sample sizes in the two datasets. This finding was 334
driven by the disproportionately frequent occurrence of double-dominant motifs (which are 335
inevitably transitive upon completion) and relatively infrequent occurrence of pass-along motifs 336
(which could result either in cyclic or transitive triads) in the African population (table 2 and 337
16
figure 4). In contrast, the Asian population shows a disproportionately greater occurrence of 338
pass-along motifs, highlighting the greater potential for cyclic relationships in the Asian system 339
than in the African. Curiously, although double-subordinate motifs are analytically equivalent to 340
double-dominant motifs since they also resolve only in transitive triads, they are not statistically 341
overrepresented. A similar asymmetry between these motifs is observed in the dominance 342
hierarchies of Diacamma worker ants (Shimoji et al. 2014), suggesting a widespread pattern in 343
the way that hierarchy is behaviorally expressed that may merit further study.
344 345
We tested orderliness beyond the individual level by aggregating individuals into classes 346
by age or social unit. The classical test of linearity, h’, was not significant in datasets collapsed 347
by age or social unit for either species despite expectations to the contrary for the African 348
system. However, outcomes were significantly steep both by age and social unit, in both taxa.
349
We explored this further by devising the Sum Of Reversals test, which compares the number of 350
reversals observed against the number of reversals expected by chance when wins and losses are 351
arranged using ranking algorithms. Multiple ranking indices were in agreement that there is 352
significant ordering by age in both populations, but there were a greater proportion of age- 353
reversed wins in the Asian population (Table 1). Individuals in the oldest age class are missing in 354
the African sample (Figure 1), unlike in the Asian. One might ask whether observed differences 355
may be explained simply by the difference in the age structure of the populations, as weaker 356
individuals in the oldest age classes could be dominated by younger females who are in better 357
physical condition (Figure 3). Given the strong correlation between age and dominance in the 358
African system (Wittemyer & Getz 2007), the presence of more older individuals should have 359
reinforced a clearer hierarchy, the opposite of what is seen in the Asian population. In addition, 360
17
strict order by age was also found in the Amboseli National Park population of African 361
elephants, which did contain individuals in the oldest age classes (Archie et al. 2006).
362 363
Ordering by social unit was not well-evidenced in the Asian population in contrast to the 364
African, even though more than half of all observed interactions occurred between individuals 365
belonging to different social units. The artificially downsampled dataset for the African 366
population shows similar results as the Asian, thus results are driven at least in part by the low 367
overall rate of interaction. Archie et al. (2006) also found that at Amboseli National Park, 368
hierarchies within families were ordered by age rather than matriline, making it a more important 369
determinant of rank. Moreover, in the Asian system individuals from completely different social 370
units seldom mingled into larger aggregations as they did in the African system, even when 371
range use was highly overlapping (de Silva et al., 2011; de Silva & Wittemyer, 2012). On the 372
majority of occasions when individuals from different social units passed by within detectable 373
proximity of one another, they either ignored or avoided each other entirely. Therefore it is 374
unlikely that null relations between social units could be resolved for truly biological rather than 375
statistical reasons.
376 377
While social dominance is typically assessed in terms of agonism (Francis 1988; Drews 378
1993; Forkman and Haskell 2004), aggressive behavior need not accompany rank establishment 379
or enforcement even where such exists (Drews, 1993; Francis, 1988; Hand, 1986), and 380
conversely egalitarianism does not imply an absence of aggression (Strier et al. 2002; Strier, 381
2007). The relationship between levels or agonism, hierarchical structure and foraging ecology 382
is therefore not straightforward (Wheeler et al. 2013). Systems characterized as ‘tolerant’
383
18
manifest clear dominance hierarchies despite very low levels of aggression, as exemplified by 384
equids (Rubenstein 1994). Among feral horses this is quantified as 0.1 aggressive interaction per 385
hour of observation, which is still much greater than what was observed in the Asian elephants.
386
The Asian dataset included all possible behavioral indicators of dominance or submissiveness, 387
not merely aggression, and yet was far sparser than the African dataset, which was based solely 388
on aggression. This was not due to a difference in total observation effort, as the Asian data 389
comprised a greater number of observation hours. To obtain a similar number of interactions in 390
the Asian population would require more than ten years of data collection (Figure S2), over 391
which time some of the subjects will have died. Because association rates among social 392
companions in Asian elephants are generally much lower than among African elephants, and 393
interactions between individuals belonging to different social units are even less frequent, the 394
lack of rank signaling among Asian elephants seems unlikely to conceal a strong latent 395
hierarchy. The more mechanistically plausible and parsimonious interpretation of these 396
observations is that rarity of dominance interactions reflects a much weaker hierarchy than that 397
of African savannah elephants.
398 399
Social and ecological drivers 400
401
The maintenance of dominance hierarchies is costly, having consequences for the health 402
and fitness of individuals (Sapolsky 2005). Therefore one expects them to be favored in the face 403
of competition when they obviate costly conflicts among individuals who repeatedly encounter 404
one another. Where dominance hierarchies reduce overt conflicts, they are likely of greater 405
importance among those who have the opportunity to interact more frequently. For instance, at 406
19
Amboseli National Park, Archie et al. (2006) found that agonistic interactions occurred more 407
often among females with higher association indices. Conversely the ability to segregate 408
spatially may remove or lessen the need for rigid hierarchies, whether among individuals in the 409
same or different social groups (Hand 1986; Drews 1993). Spatial segregation reduces the ability 410
to both to signal and appropriately respond to rank conflicts (Ang and Manica 2010). Scramble 411
competition can occur where resource patches are inadequate to support stable aggregations of 412
conspecifics, or when resources are plentiful in the absence of other factors favoring stable 413
groups (such as predation or sexual harassment). If the former constitutes ecological 414
‘constraints’, the latter may be thought of as ecological ‘release’.
415 416
On African savannahs, the dispersed and temporally dynamic nature of resource 417
availability (e.g. fresh forage and water), as well as the presence of predators enhances the 418
decision-making and resource acquisition value of older, experienced individuals, providing 419
opportunities for exerting dominance as well as leadership (Mccomb et al. 2001; Foley et al.
420
2008; Wittemyer et al. 2008; McComb et al. 2011). When errors are less costly, there is less need 421
to rely on knowledgeable individuals, reducing the value of age. Since the protected Asian site 422
has greater absolute rainfall with more predictable seasonality than the African site, no 423
nonhuman predators that pose a serious threat to elephants, and very little poaching, the risks of 424
movement and dispersal in the Asian site are likely lower relative to the African. Thus female 425
Asian elephants in this population even with very young calves need not tolerate being socially 426
subordinate and can afford to loosen maternal ties, resulting in the highly flexible contact 427
patterns and low association rates observed. Indeed, solitary adult females were observed far 428
more frequently than at the African site (de Silva & Wittemyer 2012). It follows that this Asian 429
20
population also lacks clear behavioral (as opposed to genetic) matriarchs, by definition the oldest 430
and most dominant individuals (Archie et al. 2006; Wittemyer & Getz 2007), perhaps because 431
matriarchal ‘leadership/despotism’ cannot be exerted. The general implications of these 432
observations are that the evolution of strong centralized leadership is not favored under 433
environmental conditions that enable spatio-temporal avoidance and dynamic group 434
membership, reducing competition and impeding hierarchy formation, which we term ecological 435
release.
436 437
Encounters among unfamiliar individuals may nevertheless occur even in systems where 438
scramble competition predominates. Among social foragers with non-territorial fission-fusion 439
dynamics, dominance behaviors may be co-opted to enforce social group membership rather than 440
social rank, excluding potential competitors from one’s vicinity whenever direct conflicts arise.
441
If such exclusion is not arbitrary but rather expressing preference for matrilineal kin (Fernando &
442
Lande 2000; Vidya & Sukumar 2005), it is a form of nepotism (Wittemyer & Getz 2007), even if 443
not embedded in a classical hierarchy (Sterck & Watts 1997). Dominance signals in Asian 444
elephants (Figure 2A) may serve this secondary purpose. While Asian elephants show low rates 445
of aggression among familiar individuals, conflicts including physical aggression can occur 446
especially when individuals from two completely unfamiliar units intersect (video at 447
http://youtu.be/60KxqnVV424). Although associations among non-relatives due to early 448
socialization do occur in the Asian population (SdS, unpublished data), and likewise also in 449
African savannah elephants under disturbed conditions (Goldenberg et al. 2016; Pinter-Wollman, 450
Isbell, & Hart, 2009; Wittemyer et al., 2009), such cases likely represent substitute bonds where 451
immediate kin are unavailable, rather than the norm. Aggregations of elephants are therefore 452
21
fluid, semi-permeable, but not amorphous entities, rendering ambiguous such concepts as 453
‘group’ and ‘group size’, that have been so central to our understanding of social evolution 454
(Robbins et al.1991; Silk 2007; Snaith & Chapman 2007). Asian elephants possibly share some 455
similarities with human hunter-gatherer societies in which flexible band membership is also a 456
hallmark (Aureli et al. 2008; Moffett 2013; Pennisi 2014), and is a factor thought to inhibit 457
hierarchy formation (Turnbull 1965; Boehm 1999). This suggests that fission-fusion spatial and 458
social dynamics (Aureli et al. 2008) may be key mechanisms behind the development and 459
maintenance of non-hierarchical systems, beyond the absolute abundance or distribution of 460
resources. Although the terms ‘dominance’ and ‘hierarchy’ are often linked together, dominance 461
behavior need not manifest in linear hierarchies. The results of this study suggest dominance 462
hierarchies may be viewed as falling along a gradient of strong to weak ordering, concurrent with 463
the degree of fission-fusion expressed, rather than in terms of despotic/egalitarian or 464
linear/nonlinear dichotomies. We propose that, in appropriately paired comparisons of sister taxa 465
(or multiple subpopulations of the same species), one should expect to see that systems with 466
greater levels of competition should also manifest greater levels of order than expected by 467
chance, whether or not such order is statistically linear.
468 469
Conservation and management 470
471
Because Asian elephants have substantial range requirements, occupy countries with 472
some of the densest human populations, as well as some of the most threatened ecosystems, this 473
species is extremely vulnerable to range constriction and fragmentation. They are consequently 474
also the focus of intensive management and impacted by development activities. Typically, 475
22
behavioral considerations do not feature prominently in such decisions. These findings may 476
nevertheless be important for interpreting results of prior management actions and forestalling 477
negative impacts of future interventions.
478 479
In particular, practices altering the social organization of populations such as 480
translocations, drives or roundups (used to move elephants into designated protected areas), may 481
be detrimental (Lahiri-Choudhury 1993; Fernando et al. 2012). It has been assumed that social 482
units consist of only those individuals observed together at any given time, and that capturing 483
putative “matriarchs” will draw other family members, ensuring their capture or cooperation 484
(Lahiri-Choudhury 1993). Our findings do not support such assumptions. Such displacements 485
would not only disrupt long-term social bonds because social affiliates may not be close together 486
at any given time, but could result in difficulties for the displaced individuals if habitats are 487
already saturated with other elephants. Forced displacement could result in crowding and 488
competition, with likely disproportionately negative impacts to the displaced individuals.
489
Preserving remaining range and its connectivity should be the top priority; behavioral studies 490
could be usefully integrated alongside such interventions and factored into management 491
decisions. Likewise, allowing sufficient space for avoidance will be essential for reducing 492
conflict among individuals confined to captivity.
493
Funding 494
495
This work was supported by a doctoral dissertation completion fellowship from the University of 496
Pennsylvania, a Postdoctoral Research Fellowship in Biology from the National Science 497
Foundation (grant number 1103468), a fellowship in the College of Life Sciences at the Institute 498
23
for Advanced Study in Berlin, and a postdoctoral fellowship at the Smithsonian Conservation 499
Biology Institute at the Smithsonian Institution for SdS. Data collection at the Asian site was also 500
supported by grants from the Asian Elephant Conservation Fund of the US Fish & Wildlife 501
(grant numbers 98210-7-G167, 96200-1-G212) to SdS, and data collection at the African site 502
was supported by an International Research Fellowship (grant number OISE-0502340) to GW 503
from the National Science Foundation.
504 505
Acknowledgements 506
507
We thank the field staff of the Uda Walawe Elephant Research Project for assisting in data 508
collection, the Department of Wildlife Conservation, Sri Lanka, for granting permission to 509
conduct this work and Dr. D.K. Weerakoon for enabling it. We thank the Kenyan Office of the 510
President and the KWS for permission to work in Samburu and Buffalo Springs National 511
Reserves. Analyses reported in this article can be reproduced using the data provided by de Silva 512
(2016).
513 514
Authors’ contributions and statement of competing interests 515
516
SdS conceived of the study, collected data, developed some statistical tools, conducted analyses 517
and wrote the manuscript; VS developed some statistical tools, conducted analyses, and assisted 518
in writing the manuscript; GW participated in designing the study, collected data, and edited the 519
manuscript. We have no competing interests.
520 521
24 522
25 References
523
Alexander R. 1974. The Evolution of Social Behavior.
524
Altmann J. 1974. Observational Study of Behavior : Sampling Methods Author. Behaviour 525
49:227–267.
526
Ang TZ, Manica A. 2010. Aggression, segregation and stability in a dominance hierarchy. Proc.
527
R. Soc. B Biol. Sci. 277:1337–1343. DOI: 10.1098/rspb.2009.1839 528
Archie EA, Moss CJ, Alberts SC. 2006. The ties that bind: genetic relatedness predicts the 529
fission and fusion of social groups in wild African elephants. Proc. Biol. Sci. 273:513–22.
530
DOI: 10.1098/rspb.2005.3361 531
Archie EA, Morrison TA, Foley C a. H, Moss CJ, Alberts SC. 2006. Dominance rank 532
relationships among wild female African elephants, Loxodonta africana. Anim. Behav.
533
71:117–127. DOI: 10.1016/j.anbehav.2005.03.023 534
Aureli F, Schaffner CM, Boesch C, Bearder SK, Call J, Chapman CA, Connor R, Fiore AD, 535
Dunbar RIM, Henzi SP, et al. 2008. Fission-fusion dynamics: New research frameworks.
536
Curr. Anthropol. 49:627–654. DOI:10.1086/586708 537
Ben-Dor M, Gopher A, Hershkovitz I, Barkai R. 2011. Man the fat hunter: The demise of homo 538
erectus and the emergence of a new hominin lineage in the middle pleistocene (ca. 400 kyr) 539
Levant. PLoS One 6. DOI: 10.1371/journal.pone.0028689 540
Boehm C. 1999. Hierarchy in the forest: The evolution of egalitarian behavior. Cambridge, MA:
541
Harvard University Press.
542
Bradbury JW, Vehrencamp SL. 2014. Complexity and behavioral ecology. Behav. Ecol. 25:435–
543
442. DOI:10.1093/beheco/aru014 544
26
Broom M, Koenig a., Borries C. 2009. Variation in dominance hierarchies among group-living 545
animals: modeling stability and the likelihood of coalitions. Behav. Ecol. 20:844–855. DOI:
546
10.1093/beheco/arp069 547
Campos-Arceiz A, Blake S. 2011. Megagardeners of the forest – the role of elephants in seed 548
dispersal. Acta Oecologica 37:542–553. DOI: 10.1016/j.actao.2011.01.014 549
Chapman CA, Wrangham RW, Chapman LJ. 1995. Ecological constraints on group size : an 550
analysis of spider monkey and chimpanzee subgroups. Behav. Ecol. Sociobiol. 36:59–70.
551
Stable URL: http://www.jstor.org/stable/4601044 552
Chase ID, Tovey C, Spangler-Martin D, Manfredonia M. 2002. Individual differences versus 553
social dynamics in the formation of animal dominance hierarchies. Proc. Natl. Acad. Sci. U.
554
S. A. 99:5744–5749. DOI: 10.1073/pnas.082104199 555
Clutton-Brock T, Huchard E. 2013. Social competition and its consequences in female mammals.
556
J. Zool. 289:151–171. DOI: 10.1111/jzo.12023 557
Clutton-Brock T, Janson C. 2012. Primate socioecology at the crossroads: past, present, and 558
future. Evol. Anthropol. 21:136–50. DOI: 10.1002/evan.21316 559
David H. 1987. Ranking from unbalanced paired-comparison data. Biometrika 74:432–436.
560
David H. 1988. The method of paired comparisons. London: C. Griffin.
561
de Silva S, Ranjeewa ADG, Kryazhimskiy S. 2011. The dynamics of social networks among 562
female Asian elephants. BMC Ecol. 11:17. DOI: 10.1186/1472-6785-11-17 563
de Silva S, Webber CE, Weerathunga US, Pushpakumara TV, Weerakoon D, Wittemyer G.
564
2013. Demographic variables for wild Asian elephants using longitudinal observations. PLoS 565
One 8:e82788.
566
27
de Silva S., Wittemyer G. 2012. A Comparison of Social Organization in Asian Elephants and 567
African Savannah Elephants. Int. J. Primatol. 33:1125–1141. DOI: 10.1007/s10764-011- 568
9564-1 569
de Silva, S. 2016. Data from: Fission-fusion processes weaken dominance networks of female 570
Asian elephants in a productive habitat. Behav. Ecol. Dryad Digital Repository.
571
http://dx.doi.org/10.5061/dryad.sr398.
572
de Vries H, Stevens JMG, Vervaecke H. 2006. Measuring and testing the steepness of 573
dominance hierarchies. Anim. Behav. 71:585–592. DOI: 10.1016/j.anbehav.2005.05.015 574
de Vries H. 1995. An improved test of linearity in dominance hierarchies containing unknown or 575
tied relationships. Anim. Behav. 50:1375–1389. DOI: 10.1016/0003-3472(95)80053-0 576
Drews C. 1993. The concept and definition of dominance in animal behavior. Behaviour 577
125:283–313. DOI: 10.1163/156853993x00290 578
Emlen ST, Oring LW. 1977. Ecology, sexual selection, and the evolution of mating systems.
579
Science. 197:215–223.
580
Faulkes CG, Bennett NC, Bruford MW, Obrien HP, Aguilar GH, Jarvis JUM. 1997. Ecological 581
constraints drive social evolution in the African mole-rats. Proc. R. Soc. B Biol. Sci.
582
264:16191627.
583
Fernando P, Lande R. 2000. Molecular genetic and behavioral analysis of social organization in 584
the Asian elephant (Elephas maximus). Behav. Ecol. Sociobiol.
585
DOI:10.1007/s002650000218 586
Fernando P, Leimgruber P, Prasad T, Pastorini J. 2012. Problem-elephant translocation:
587
Translocating the problem and the elephant? PLoS One 7:e50917. DOI:
588
28 10.1371/journal.pone.0050917
589
Foley C, Pettorelli N, Foley L. 2008. Severe drought and calf survival in elephants. Biol. Lett.
590
4:541–544. DOI: 10.1371/journal.pone.0050917 591
Forkman B, Haskell MJ. 2004. The maintenance of stable dominance hierarchies and the pattern 592
of aggression: Support for the suppression hypothesis. Ethology 110:737–744. DOI:
593
10.1111/j.1439-0310.2004.01009.x 594
Francis. 1988. On the relationship between aggression and social dominance. Ethology 78:223–
595
237.
596
Geist V. 1974. On the Relationship of Social Evolution and Ecology in Ungulates. Am. Zool.
597
14:205–220.
598
Goldenberg SZ, Douglas-Hamilton I, Wittemyer G. 2016. Vertical transmission of social roles 599
drives resilience to poaching in elephant networks. Curr. Biol. 26:75–79. DOI:
600
10.1016/j.cub.2015.11.005 601
Hand JL. 1986. Resolution of social conflicts: dominance, egalitarianism, spheres of dominance, 602
and game theory. Q. Rev. Biol. 61:201–220.
603
Hemelrijk CK. 1999. An individual-orientated model of the emergence of despotic and 604
egalitarian societies. Proc. R. Soc. B Biol. Sci. 266:361–369. Available from: DOI:
605
10.1098/rspb.1999.0646 606
Isbell LA, Young TP. 2002. Ecological models of female social relationships in primates:
607
similarities, disparities, and some directions for future clarity. Behaviour 139:177–202.
608
Stable URL: http://www.jstor.org/stable/4535920 609
Jameson KA, Appleby MC, Freeman LC. 1999. Finding an appropriate order for a hierarchy 610
29
based on probabilistic dominance. Anim. Behav. 57:991–998. DOI: 10.1006/anbe.1998.1077 611
Jarman APJ. 2010. The social organisation of antelope in relation to their ecology. Behaviour 612
48:215–267. DOI: 10.1163/156853974X00345 613
Kappeler PM, van Schaik CP. 2002. Evolution of Primate Social Systems. Int. J. Primatol.
614
23:707–740.
615
Koenig A, Borries C. 2009. The lost dream of ecological determinism: Time to say goodbye? … 616
Or a White Queen’s proposal? Evol. Anthropol. Issues, News, Rev. 18:166–174. DOI:
617
10.1002/evan.20225 618
Koenig A, Scarry CJ, Wheeler BC, Borries C. 2013. Variation in grouping patterns , mating 619
systems and social structure : what socio-ecological models attempt to explain. Proc. R. Soc.
620
B Biol. Sci. 368:20120348. DOI: 10.1098/rstb.2012.0348 621
Lahiri-Choudhury DK. 1993. Problems of wild elephant translocation. Oryx 27:53–55.
622
Langville AN, Meyer CD. 2012. Who’s #1? The science of rating and ranking. Princeton, New 623
Jersey: Princeton University Press.
624
Loarie SR, Aarde RJ Van, Pimm SL. 2009. Fences and artificial water affect African savannah 625
elephant movement patterns. Biol. Conserv. 142:3086–3098. DOI:
626
10.1016/j.biocon.2009.08.008 627
Loarie SR, van Aarde RJ, Pimm SL. 2009. Elephant seasonal vegetation preferences across dry 628
and wet savannas. Biol. Conserv. 142:3099–3107. DOI: 10.1016/j.biocon.2009.08.021 629
Mccomb K, Moss C, Durant SM, Baker L, Sayialel S. 2001. Matriarchs as repositories of social 630
knowledge in African elephants. Science. 292:1–7. DOI: 10.1126/science.1057895 631
McComb K, Shannon G, Durant SM, Sayialel K, Slotow R, Poole J, Moss C. 2011. Leadership 632
30
in elephants: the adaptive value of age. Proc. Biol. Sci. 278:3270–6. DOI:
633
10.1098/rspb.2011.0168 634
Moffett M. 2013. Human identity and the evolution of societies. Hum. Nat. 24:219–267.
635
Moss CJ, Poole JH. 1983. Relationships and social structure of African elephants. In: Primate 636
Social Relationships: An Integrated Approach. Hinde, R.A. Oxford: Blackwell Scientific 637
Publications. p. 315–325.
638
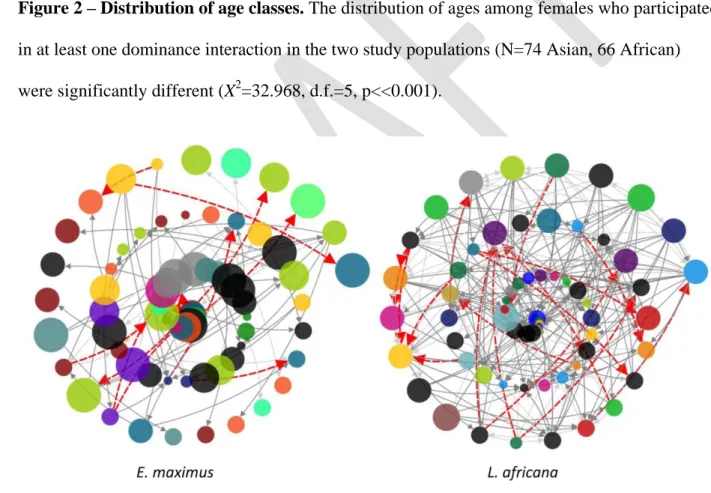
Park J, Newman MEJ. 2005. A network-based ranking system for US college football. J. Stat.
639
Mech. Theory Exp.:P10014.
640
Payne HF. P., Lawes MJ., Henzi S. P. 2003. Competition and the Exchange of grooming among 641
female samango monkeys (Cercopithecus mitis erythrarchus). Behaviour 140:453–471. DOI:
642
10.1163/156853903322127931 643
Pennisi E. 2014. Our egalitarian eden. Science. 344:824–825.
644
Pinter-Wollman N, Isbell L a, Hart L a. 2009. The relationship between social behaviour and 645
habitat familiarity in African elephants (Loxodonta africana). Proc. Biol. Sci. 276:1009–14.
646
DOI: 10.1098/rspb.2008.1538 647
Power RJ, Compion RXS. 2009. Lion predation on elephants in the Savuti, Chobe National Park, 648
Botswana. 44:36–44. DOI: 10.1080/15627020.2009.11407437 649
R Development Core Team. 2012. R: A language and environment for statistical computing.
650
Available from: http://www.r-project.org/
651
Robbins D, Chapman CA, Wrangham RW. 1991. Group size and stability : Why do gibbons and 652
spider monkeys differ? Primates 32:301–305.
653
Rubenstein DI, Sundaresan SR, Fischhoff IR, Tantipathananandh C, Berger-Wolf TY. 2015.
654
31
Similar but different: Dynamic social network analysis highlights fundamental differences 655
between the fission-fusion societies of two equid species, the onager and Grevy’s zebra.
656
PLoS One 10:1–21. DOI: 10.1371/journal.pone.0138645 657
Rubenstein DI. 1994. The ecology of female social behaviour in horses, zebras and asses.
658
Physiol. Ecol. Japan 29:13–28.
659
Sapolsky RM. 2005. The influence of social hierarchy on primate health. Science. 308:648–652.
660
van Schaik C, van Hooff J. 1983. On the ultimate causes of primate social systems. Behaviour 661
85:91–117. DOI: 10.1163/156853983X00057 662
Schmid VS, de Vries H. 2013. Finding a dominance order most consistent with a linear 663
hierarchy: an improved algorithm for the I&SI method. Anim. Behav. :1–9. DOI:
664
10.1016/j.anbehav.2013.08.019 665
Shimoji H, Abe MS, Tsuji K, Masuda N. 2014. Global network structure of dominance hierarchy 666
of ant workers. J. R. Interface 11:20140599.
667
Shizuka D, McDonald DB. 2012. A social network perspective on measurements of dominance 668
hierarchies. Anim. Behav. 83:925–934. DOI: 10.1016/j.anbehav.2012.01.011 669
Shoshani J, Tassy P eds. 1996. The Proboscidea: Evolution and palaeoecology of dlephants and 670
their relatives. Oxford: Oxford University Press.
671
Shrader AM, Pimm SL, Aarde RJ. 2010. Elephant survival, rainfall and the confounding effects 672
of water provision and fences. Biodivers. Conserv. 19:2235–2245. DOI: 10.1007/s10531- 673
010-9836-7 674
Silk JB. 2007. The adaptive value of sociality in mammalian groups. Philos. Trans. R. Soc.
675
Lond. B. Biol. Sci. 362:539–59. DOI: 10.1098/rstb.2006.1994 676
32
Snaith T V., Chapman C a. 2007. Primate group size and interpreting socioecological models:
677
Do folivores really play by different rules? Evol. Anthropol. Issues, News, Rev. 16:94–106.
678
DOI: 10.1002/evan.20132 679
Sterck EHM, Watts DP. 1997. The evolution of female social relationships in nonhuman 680
primates. Behav. Ecol. Sociobiol. 41:291–309.
681
Strier KB, Dib LT, Figueira JEC. 2002. Social dynamics of male muriquis (Brachyteles 682
arachnoides hypoxanthus). Behaviour 139:315–342. DOI: 10.1163/156853902760102690 683
Strier KB. 2007. Primate behavioral ecology. 3rd ed. Boston: Pearson Allyn and Bacon.
684
Sutherland WJ. 1996. From individual behaviour to population ecology. Oxford: Oxford 685
University Press.
686
Thierry B. 2008. Primate socioecology, the lost dream of ecological determinism. Evol.
687
Anthropol. Issues, News, Rev. 17:93–96. DOI: 10.1002/evan.20168 688
Turnbull CM. 1965. Wayward servants: The two worlds of the African pygmies. Westport, 689
Connecticut: Greenwood Press.
690
Vehrencamp SL. 1983. Optimal degree of skew in cooperative societies. Am. Zool. 23:327–335.
691
DOI: 10.1093/icb/23.2.327 692
Vidya TNC, Sukumar R. 2005. Social organization of the Asian elephant (Elephas maximus) in 693
southern India inferred from microsatellite DNA. J. Ethol.:205–210.
694
Wasserman S, Faust K. 1994. Social network analysis: methods and applications. Cambridge, 695
U.K.: Cambridge University Press.
696
Wheeler BC, Scarry CJ, Koenig A. 2013. Rates of agonism among female primates: a cross- 697
taxon perspective. Behav. Ecol. 24:1369–1380. DOI: 10.1093/beheco/art076 698
33
Wittemyer G, Daballen D, Douglas-Hamilton I. 2013. Comparative demography of an at-risk 699
African elephant population. PLoS One 8:e53726. DOI: 10.1371/journal.pone.0053726 700
Wittemyer G, Douglas-Hamilton I, Getz WM. 2005. The socioecology of elephants: analysis of 701
the processes creating multitiered social structures. Anim. Behav. 69:1357–1371. DOI:
702
10.1016/j.anbehav.2004.08.018 703
Wittemyer G, Getz WM. 2006. A likely ranking interpolation for resolving dominance orders in 704
systems with unknown relationships. Behaviour 143:909–930. DOI:
705
10.1163/156853906778017953 706
Wittemyer G, Getz WM. 2007. Hierarchical dominance structure and social organization in 707
African elephants, Loxodonta africana. Anim. Behav. 73:671–681. DOI:
708
10.1016/j.anbehav.2006.10.008 709
Wittemyer G, Okello JBA, Rasmussen HB, Arctander P, Nyakaana S, Douglas-Hamilton I, 710
Siegismund HR. 2009. Where sociality and relatedness diverge: the genetic basis for 711
hierarchical social organization in African elephants. Proc. Biol. Sci. 276:3513–21. DOI:
712
10.1098/rspb.2009.0941 713
Wittemyer G, Polansky L, Douglas-hamilton I, Getz WM. 2008. Disentangling the effects of 714
forage, social rank, and risk on movement autocorrelation of elephants using Fourier and 715
wavelet analyses. Proc. Natl. Acad. Sci. U. S. A. 105:1–6. DOI: 10.1073/pnas.0801744105 716
Wrangham RW. 1980. An ecological model of female-bonded primate groups. Behaviour 717
75:262–300. DOI: 10.1163/156853980X00447 718
719 720
34 721
722
35 Figure legends
723
724
Figure 1 – Dominance behavior & triads 725
A. Trunk-over dominance gesture between two adult females.
726
B. Triad motifs, with MAN labelling scheme (Wasserman & Faust 1994; Shizuka &
727
McDonald 2012). 030T is a transitive triad, whereas 030C is cyclic. Excluding 728
bidirectional outcomes, 021D (double-dominant), and 021U (double-subordinate) are 729
incomplete triads that would result in transitive triads no matter which way they are 730
completed whereas 021C (pass-along) could result either in a transitive or cyclic triad 731
with equal probability.
732
36 733
Figure 2 – Distribution of age classes. The distribution of ages among females who participated 734
in at least one dominance interaction in the two study populations (N=74 Asian, 66 African) 735
were significantly different (X2=32.968, d.f.=5, p<<0.001).
736
737
Figure 3 – Dominance networks of E. maximus and L. Africana. Nodes are sized by age class, 738
and colored by social unit (black nodes are singletons belonging to units from which no other 739
members were observed in a dominance interaction during the study). Graphs were generated on 740
37
NodeXL, where nodes spiral outwards in order of increasing out-degree (i.e. nodes with more 741
wins are more peripheral). Dark edges signify interactions in which the dominant was older, light 742
edges signify equal age, and dashed red edges signify reversals. Decreasing node size toward the 743
center in L. Africana indicates greater order by age relative to E. maximus. E. maximus exhibits a 744
sparser network with more age irregularities than L. africana despite a greater number of total 745
observation hours and an older age structure.
746 747
748
Figure 4 – Frequency of triad motifs in observed vs. randomized datasets. The ordinate is 749
the number of times the specified motif appears in a given dataset, the abscissa is the number of 750
randomized datasets in which that particular count occurs. The dashed line shows the actual 751
count for each motif observed in respective datasets (see Table 2). Complete triads were rare in 752
the observed data, and are therefore not presented.
753
38 754
755
Figure 5 – Ordering by age and social unit using four ranking methods. Expected SOR 756
(Sum-Of-Reversals) values are averaged over all randomizations, with error bars showing 757
standard deviations. “SOR obs” are the observed values, “SOR exp” are the expected values 758
based on 10,000 randomizations. Asterisks indicate significant differences after Bonferroni 759
correction (Asian: p < 0.00625; African: p<0.0001). n: number of between-class dominance 760
interactions.
761 762
39
Table 1 – Direction of dominance by age. The frequency of wins by older individuals vs.
763
younger individuals or those in the same age class (in 10-year bins, Figure 2) was significantly 764
different between the Asian and African datasets (X2=13.652, d.f.=2, p<0.01).
765
Dominant older Dominant younger Dominant equal age class
E. maximus 42 (56%) 14 (19%) 19 (25%)
L. africana 157 (59%) 20 (8%) 87 (33%)
L. africana
downsampled 47 (65%) 5 (7%) 23 (30%)
766 767
Table 2 – Triad census results for known females (N=74 Asian, 66 African). Percentages 768
reflect proportion of each motif among these five motifs, disregarding others such as null triads 769
(no edges), singles, and motifs with mutual outcomes. Note that the number of transitive as well 770
as cyclic motifs are low simply because there are fewer complete triads than incomplete ones.
771
However, the number of pass-along and cyclic motifs together are disproportionately greater 772
relative to the other motifs in the Asian dataset in contrast to the African.
773 774
021D 021U 021C 030T 030C
Double dominant Double subordinate Pass-along Transitive Cyclic
E. maximus 39 (28%) 32 (23%) 62 (45%) 5 (4%) 1 (<1%)
L. africana 512 (37%) 302 (22%) 468 (34%) 91 (7%) 2 (<1%) L. africana
downsampled 85 (41%) 42 (20%) 77 (37%) 2 (1%) 0
775 776