The purpose of this dissertation is to provide an introductory view of how a changing landscape of urban inequality caused by patterns of gentrification relates to urban schooling in the contemporary US. about public schools in the United States as a whole. Of the roughly 10 percent of urban schools located in neighborhoods categorized as sprawl in 2000, roughly one in four experienced gentrification in the following decade.
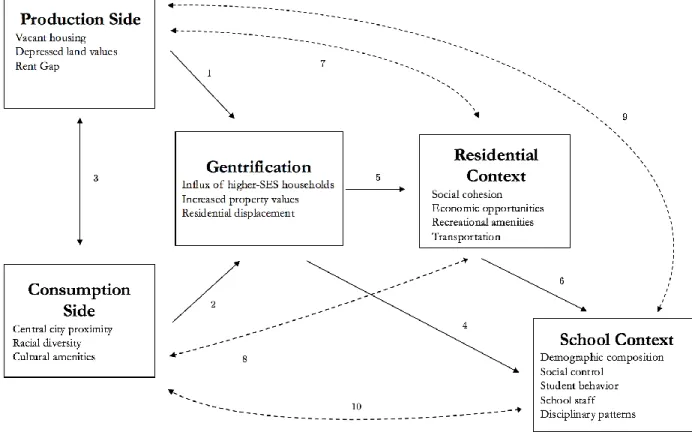
The third part of this dissertation estimates whether gentrification is associated with changes in disciplinary patterns at neighborhood schools. In the past few decades, another important reality of residential stratification in urban America has emerged: namely, not everyone is disadvantaged. This dissertation builds on emerging research on the relationship between gentrification and K-12 schooling in the United States by describing (1) the distribution, incidence, and variation of gentrification that occurs around urban schools nationwide, (2) factors associated with gentrification is related and determine the extent to which school-level factors predict it, and (3).
In this way, this dissertation documents several stylized facts about gentrification as it occurs around public schools and provides the first empirical evidence as to whether gentrification is associated with changes in disciplinary patterns in local schools. The first part of Chapter V presents new statistics on the incidence and spread of gentrification around public schools in the United States as a whole.
LITERATURE REVIEW
S. Census
Therefore, about a quarter of the schools in the analytical sample could not be linked to the open enrollment indicator. - funded repository of spatial data on school attendance boundaries for grades K through 12 in more than 500 of the largest school districts in the United States. Because the SABINS survey was voluntary, the schools included in the survey are a non-random sample of the US population.
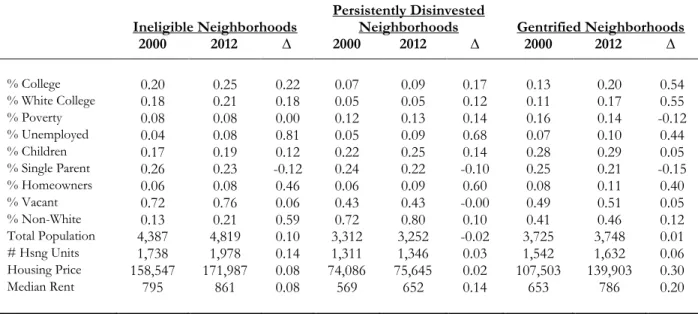
Despite the fact that SABS had better coverage than SABINS, the algorithm used to link schools to their respective catchments in the current study prioritized the 2009-10 SABINS database because it occurred within the assessment period. As described in the methods section, all subsequent descriptive and inferential analyzes are based on post-stratification weights that increase the .. representativeness of the sample and help generalize findings to the well-defined population of US public schools.). A school catchment area (hereafter referred to as a school district) was classified as disinvested if (a) it had a median household income in 2000 that was below the 40th percentile of its respective city average, and (b) it had a housing stock has. built in the 20 years. before 2000 which was below the 40th percentile of his city.
Ancillary analyzes shown in . the results show that the results are robust to a less restrictive definition of disinvested based on the 50th versus 40th percentile threshold.). As a robustness check, however, the results section reports results based on an alternative measure of gentrification defined in terms of the increase in rent prices relative to property values.
METHOD
The second stage conducted a series of bivariate (based on point-biserial correlations .) and multivariate analyzes to describe general and unique associations of gentrification with a diverse set of school, neighborhood, district, and city characteristics. Rather, the average marginal effect for each coefficient in the vector is interpreted as the change in the likelihood of gentrification associated with a unit change in the variable of interest. The primary analysis includes a full set of school, neighborhood, and district covariates, as well as lagged outcome measures.
The fact that this model includes a lagged outcome measure adjusts for any baseline differences in school disciplinary practices while controlling for any time-invariant unobserved school- or neighborhood-level factors that might otherwise confound the observed association. Additionally, because theory suggests that the relationship between gentrification and suspension rates might vary by school racial composition, a second set of models is estimated that includes an interaction term between gentrification ( ) and a standardized measure of the proportion of nonwhite students in the school. In these interaction models, the main effect for gentrification is interpreted as an association between gentrification and changes in suspension rates in schools with an average proportion of nonwhite students.
The coefficient for the interaction term is interpreted as the increment (or decrement) of the relationship between gentrification and dropout rates associated with the standard deviation increase in the proportion of nonwhite students. That not every public school in the state reported data on the contributing area may be. This was accomplished by merging the list of schools with catchment area data (from both SABINS and SABS) with data from the National Center for Education Statistics' School Universe survey, which included schooling characteristics for the universe of public schools (including those with catchment area data ). ).
Schools in the SABINS and SABS survey were then weighted by the inverse of the probability that they reported catchment information based on observable characteristics. For the spatial sample, the broader population of schools for which these weights were calculated was the universe of public schools operational during the 2011–12 school year. For the prediction sample, the broader population of schools for which these weights were calculated was the universe of schools operational in both the 2011–12 and 1999–00 school years.
Indeed, schools that were less likely to report catchment data were weighted relative to their peer institutions. These sampling weights were estimated from a logistic regression in which a binary indicator of whether a school reported its respective catchment was regressed on observable characteristics described below. As shown in the results section, the results were robust to the exclusion of these sampling weights, suggesting that non-random reporting of catchments was not a threat to external validity.
RESULTS
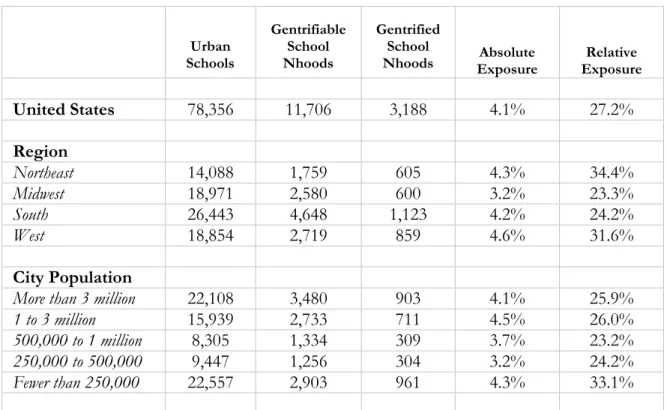
Of the population of schools located in neighborhoods that were gentrifiable in 2000, more of these neighborhoods in In the Northeast in particular, approximately one in three urban schools located in potentially gentrifying neighborhoods underwent baseline. At the other end of the distribution, absolute rates of gentrification in the Northeast were consistently below 6 percent, with the notable exception being Maine, where roughly 1 in 9 urban schools found itself located in a clean neighborhood.
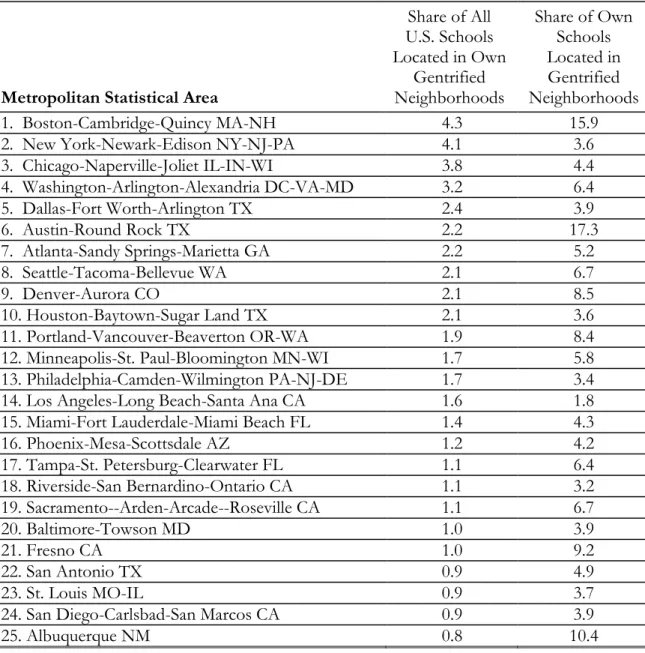
Regarding the subpopulation of schools in gentrifiable neighborhoods, Table 2 above showed that relative gentrification was greatest in the West and Northeast. The list, unsurprisingly, includes many of the largest cities in the United States. The largest difference in absolute exposure rates between white students and their ethnoracial counterparts is in the Northeast.
In the Northeast, black students are 3.19 times as likely as white students to be exposed to a gentrified school neighborhood. Similarly, relative exposure rates for white students in Mississippi are nearly twice those for black and Hispanic students in the same state. Even in New York, the largest state in the Northeast, the relative exposure rate for white students was 1 in 3, compared to 1 in 13 for black students and 1 in 9 for Hispanic students.
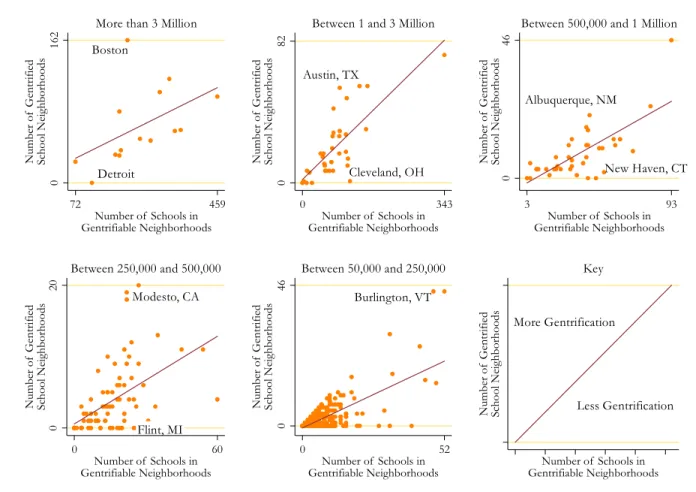
First, gentrification that occurs around public schools is most common in the least disadvantaged gentrifiable neighborhoods. Rather, average marginal effects simply denote the expected change in the probability of gentrification associated with a unit change in each covariate. Gentrification is also less likely if a school has a higher proportion of non-white students than there are non-white residents in the surrounding community.
As shown in Table 6, Column 1, a one standard deviation increase in total enrollment is associated with a two percentage point decrease in the probability of gentrification. For every standard deviation increase in the share of non-white residents, the probability of gentrification decreases by five percentage points on average. First, and similar to above, the main "effect" for gentrification remains significant in the model predicting suspension rates for black students in high school.
Notably, a one standard deviation increase in the share of non-white students in schools in this region. In other words, gentrification becomes less harmful in terms of black student suspension rates as the proportion of nonwhite students in the school increases. . Mathematically, the marginal association at any point on the x-axis is equal to the difference in the adjusted predictions between schools in gentrified and non-gentrified neighborhoods.
For comparison, the first row of Table 8 of the impact assessment described in the main text is shown.