Discrete distributions ..3-1 Bernoulli distribution ..3-1 Beta binomial distribution ..3-1 Beta Pascal distribution ..3-3 Binomial distribution ..3-3 Discrete Weibull distribution ..3-3 Geometric distribution ..3 -3. Hypergeometric distribution ..3-33 Negative binomial distribution..3-33 Poisson distribution..3-34 Rectangular (discrete uniform) distribution ..3-34 Continuous distribution formulas ..3-34 Arcsine distribution..3-34 Beta distribution ..3-35 Cauchy Distribution ..3-35 Chi Distribution ..3-35 Chi-Square Distribution ..3-35 Erlang Distribution ..3-35 Exponential Distribution ..3-35 Extreme-Value Distribution ..3- 36 FDistribution ..3 -36 Gamma Distribution ..3-36 Semi-normal Distribution ..3-36 Laplace (Double Exponential) Distribution..3-37 Logistic Distribution..3-37 Lognormal Distribution ..3-37 Noncentral Chi -Square Distribution..3-37 NoncentralFDistribution ..3-38 Noncentral-Distribution..3-38 Normal Distribution..3-38 Pareto Distribution ..3-38 Rayleigh Distribution ..3-39 t-Distribution..3-39 Triangular Distribution ..3-39 Uniform distribution ..3-39 Weibull distribution ..3-40 Variat generation techniques..3-40 Notation..3-40 Variat generation algorithms ..3-40 References ..3-42 .
Efficacy of Mathematical Modeling
Mathematical calculations have played an important role in the development and advancement of our modern world. Virtually all of our common consumer products have origins that can be traced back to mathematical calculations.
Industrial Engineering and Computations
IE's analytical approach is used to solve complex and important problems facing humanity. The practice of EI is about making the right choices in a dynamic environment of competing alternatives.
Definition and Applications
Orientation to STEM
IE Catchphrases
Span and Utility of IE
Heritage from Industrial Revolution
Historical Accounts
He was quickly promoted to the positions of time clerk, journeyman, lathe operator, gang leader and foreman in the machine shop. Gilbreth made it possible to apply science more precisely in the analysis and design of the workplace.
Chronology of Applications
1945 Shigeo Shingo introduced the concept of manufacturing as a network of processes and operations and identified lot delays as a source of delay between processes, at a technical meeting of the Japan Management Association. 1946 The first all-electronic digital computer ENIAC (Electronic Numerical Integrator and Computer) was built at the University of Pennsylvania.
Importance of IE Calculations
The process of using number sense and skills, relationships and calculations to determine how a job works. The process of understanding the structure and function of living systems, especially humans, and their interaction with the work environment.
Importance of Calculations Guide
Basic Queuing Equations
L average number of customers in the queuing system Lq average queue length (customers waiting in line). Ls the average number of customers in service W the average time a customer spends in the system Wq the average time a customer spends waiting in line.
Queuing Birth---Death Processes
Laws of Motion of Queuing Birth and Death
Queuing Birth---Death Law 1
Queuing Birth---Death Law 2
Queuing Birth---Death Law 3
Clearly these do not occur in most practical operational situations, although the lack of statistical significance may allow us to ignore some of the real-life limitations.
Data Types for Computational Analysis
Nominal Scale
Ordinal Scale
Interval Scale
Ration Scale
Cardinal Scale
Quadratic Equation
Overall Mean
Chebyshev’s Theorem
Permutations
Combinations
Failure
Probability Distribution
Probability
Distribution Function
Expected Value
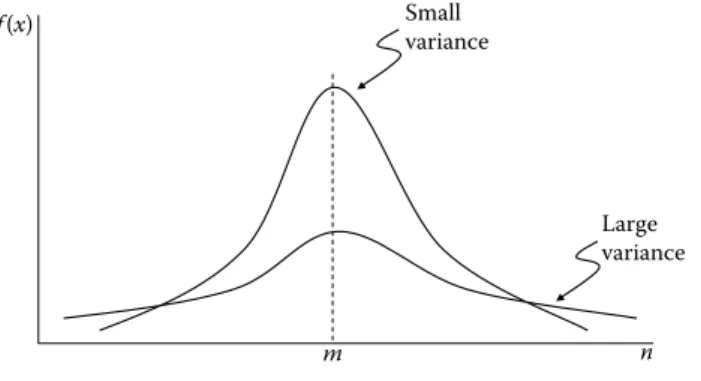
Variance
Binomial Distribution
Poisson Distribution
Mean of a Binomial Distribution
Normal Distribution
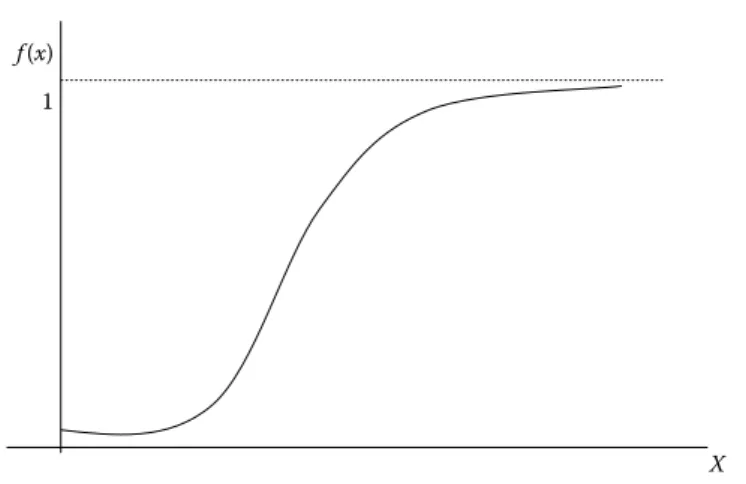
Cumulative Distribution Function
Population Mean
Standard Error of the Mean
The higher the degrees of freedom, the more closely the distribution will resemble a standard normal distribution with a mean of 0 and a standard deviation of 1.
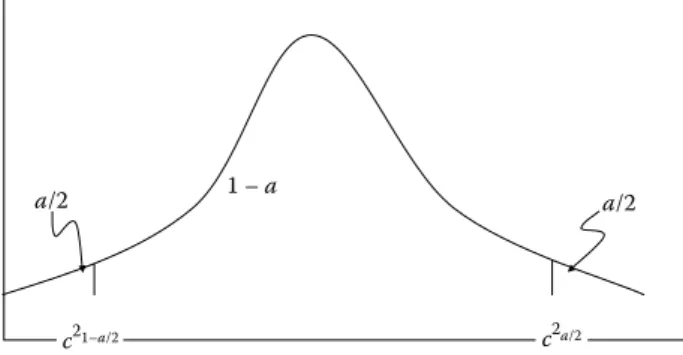
Chi-Squared Distribution
Definition of Set and Notation
Here, setA is a subset of setB because every element of setA is also an element of setB, so it is written as . The union of setA and setB is the set of all elements belonging to A or B or both, and is written as .
Set Terms and Symbols
SetsAanandBare are equal if and only if they have exactly the same elements, and the equality is written as.
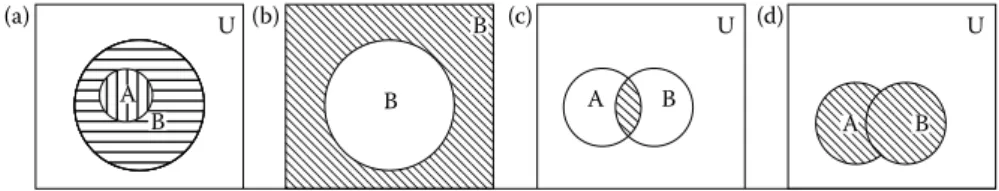
Venn Diagrams
A set without elements is called the empty set and is denoted by { } =Φ. Here, setA is a subset of setB because every element of setA is also an element of setB, so it is written as . The sets A and Bare are equal if and only if they have exactly the same elements, and the equality is written as
Operations on Sets
De Morgan’s Laws
The complement of the union of two sets is equal to the intersection of their complements (Equation 2.2). The complement of the intersection of two sets is equal to the union of their complements (Equation 2.3).
Counting the Elements in a Set
How many five-card poker hands can be dealt from a standard 52-card deck? Note: The order in which the five cards may be dealt is not important.
Probability Terminology
Basic Probability Principles
Random Variable
Mean Value ˆ x or Expected Value μ
Series Expansions
According to this theorem, it is possible to expand the power (a+x)nin into a sum involving terms of the form bacxd, where the coefficient of each term is a positive integer, and the sum of the exponents of and xin each term ern. The approximation can most simply be derived forn, an integer, by approximating the sum over the terms of the factor with an integral, so that.
Mathematical Signs and Symbols
Greek Alphabets
Algebra
Laws of Algebraic Operations
Special Products and Factors
Powers and Roots
Sum of Arithmetic Progression to n Terms
Sum of Geometric Progression to n Terms
Generalized Mean
Trigonometric Solution of the Cubic Equation
Solution of Quadratic Equations
Partial Fractions
Repeated Linear Factors N (x)
General terms
Repeated Linear Factors
Factors of Higher Degree
Geometry
Triangles
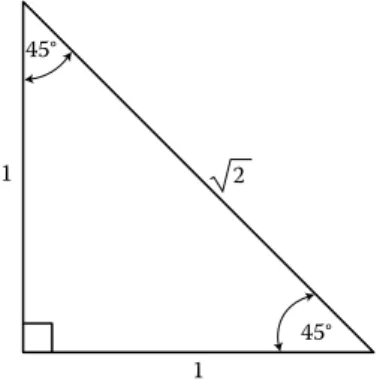
Right Triangle
General Triangle
Menelaus’ Theorem
Ceva’s Theorem
Quadrilaterals
Rectangle
Rhombus
Trapezoid
General Quadrilateral Let
Theorem
Cyclic Quadrilateral
Prolemy’s Theorem
Cyclic-Inscriptable Quadrilateral
Segment of a Parabola Area = 2
Planar Areas by Approximation
Solids Bounded By Planes
Cube
Rectangular Parallelepiped (or Box) Let a, b, and c be the lengths of its edges
Truncated Triangular Prism
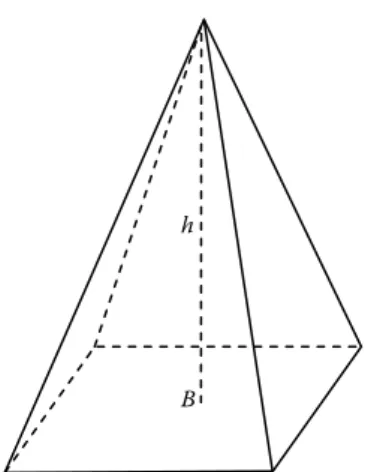
Pyramid
Frustum of a Pyramid
Prismatoid
Regular Polyhedra
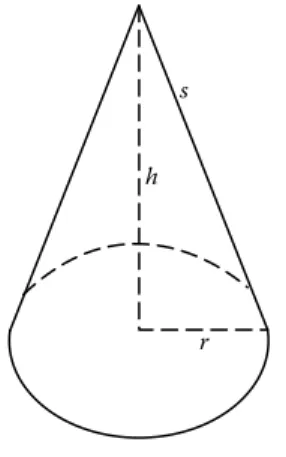
A perfect sphere is perfectly symmetrical about its center, with all points on the surface equidistant from the center. A cylinder is one of the most basic curved geometric shapes, a surface formed by points at a given distance from a given straight line, the axis of the cylinder. A cone is a three-dimensional geometric shape that tapers smoothly from a flat, usually circular base to a point called the apex or apex.
More precisely, it is the solid figure bounded by a planar base and the surface (called the lateral surface) formed by the locus of all straight line segments joining the apex to the circumference of the base.
Zone and Segment of Two Bases
Lune
Spherical Sector
Spherical Triangle and Polygon
Spheroids
Ellipsoid
Oblate Spheroid
Prolate Spheroid
Distance d between Two Points
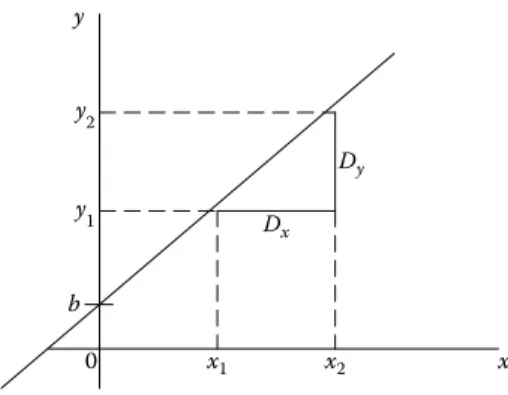
Equation of a Line Joining Two Points
Equation of a Line in Terms of x -intercept a = 0 and y-intercept b = 0
Normal Form for Equation of a Line The equation of the line in the intercept form is given by
General Equation of a Line
Area of a Triangle with Vertices
Transformation of Coordinates Involving Pure Translation
Transformation of Coordinates Involving Pure Rotation
Transformation of Coordinates Involving Translation and Rotation
Polar Coordinates (r, θ)
Catenary, Hyperbolic Cosine
Cardioid
Circle
Cassinian Curves
Logarithmic Identities
A series expansion is a representation of a particular function as a sum of powers in one of its variables, or as a sum of powers of another (usually elementary) function f(x).
Limiting Values
Inequalities
Polynomial Approximations
Exponential Function Series Expansion
Fundamental Properties
Definition of General Powers
Logarithmic and Exponential Functions
Periodic Property
The surface area (see Figure 2.7) and the volume of a cone are given, respectively, by the surface area of a cone=πr2+πrs,.
Slopes
Trigonometric Ratios
In a triangle, there are some angles or sub-angles within it that somehow relate to each other.
Sine Law
Cosine Law
Expanding
Factoring
Roots of a Quadratic Equation
Law of Exponents
Logarithms
Note: Dis is the density (g/cm3=kg/m3), is the mass (kg), is the volume, is is the distance (m), is is the speed (m/s), is is the time (s), is the acceleration (m/s2),vfis the final velocity (m/s),viis the initial velocity (m/s),Fgis the gravity (N),Gis the universal gravitational constant (G=6.67×10⁻¹¹N m2/kg2 ), m1 and m2 are the masses of the two objects (kg), pis the momentum (kg m/s), Wis the work or electrical energy (J), Pis the force (W), K.E.
Discrete Distributions
Beta Binomial Distribution p(x) = 1
Beta Pascal Distribution
Binomial Distribution p(x) =
Geometric Distribution
Negative Binomial Distribution p(x) =
Rectangular (Discrete Uniform) Distribution p(x) = 1
Continuous Distributions
Beta Distribution
Chi Distribution
Exponential Distribution
Noncentral F Distribution f (x) =
Triangular Distribution
Distribution Parameters Average
Normal Probability Plot
Comparison of Poisson Rates
Distribution Functions − Parameter Estimation Bernoulli
Poisson
Beta
Erlang
Log−Normal
Normal
Uniform
Weibull
ANOVA
Notation
Standard Error (Internal)
Interval Estimates
Tukey Interval
Scheffe Interval
Bartlett Test Test statistic
Hartley’s Test
Adjustment for Ties
Freidman Test
Regression Notation
Note: When the no constant option is selected, the overall sum of square is uncorrected for the mean. This is the R2 value of little use because the sum of the residuals is not zero.
Nonlinear Regression
Ridge Regression Additional notation
Quality Control
Subgroup statistics Subgroup means
X Bar Charts Compute
If other than 3-sigma limits are used, such as 2-sigma limits, all limits are adjusted proportionally.
Capability Ratios
R Charts
S Charts
U Charts
NP Charts
CuSum Chart for the Mean Control mean = μ
Periodogram (Computed using Fast Fourier Transform) If n is odd
Categorical Analysis Notation
Chi-Square
Fisher’s Exact Test
Lambda
Uncertainty Coefficient
Somer’s D
Contingency Coefficient C =
Conditional Gamma
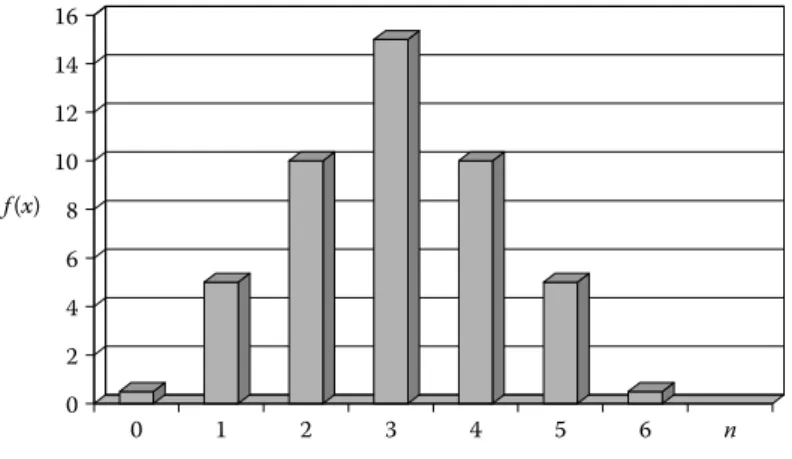
Consider a random sampling process where all outcomes depend solely on chance, i.e. each outcome is equally likely to occur. If S is a uniform sample space and the set of desired outcomes is E, then so is the probability of the desired outcomes. The random variable X is the number of tails noted. X can only take the values 1, 2.
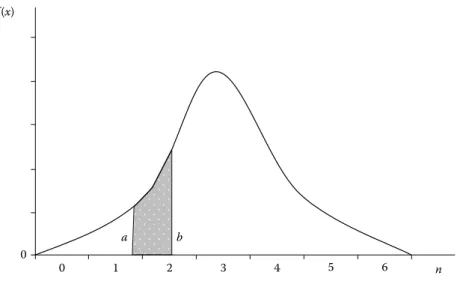
The random variable is its lifetime in hours. Y can take on any positive real value, so Y is a continuous random variable.
Mean Value x or Expected Value μ
Discrete Distribution Formulas Probability mass function, p(x)
Extreme-Value Distribution
Variate Generation Techniques ∗
Variate Generation Algorithms
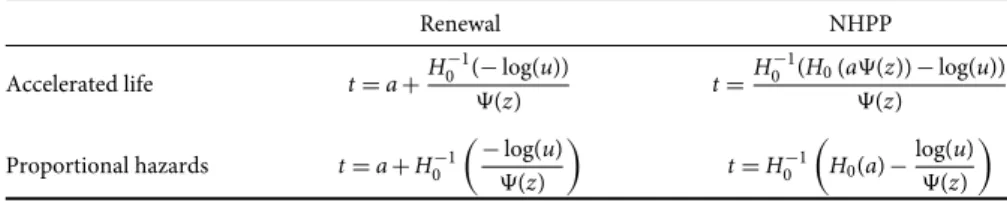
The cumulative hazard function for the time of the next event conditional on survival to timeais. In the accelerate life model, where H(t)=H0(tΨ(z)), the time of the next event is generated by. If we equate the conditional cumulative hazard function to −log(u), the time to the next event in the proportional hazards case is generated by .
The exponential power distribution (Leemis, 1987) is a flexible two-parameter distribution with cumulative hazard function.
Sample Average
Application Areas
Sample calculations Given
Sample Variance
The variance and the closely related standard deviation are measures of the magnitude of the spread of elements in a data distribution.
Sample Calculations Given
Sample Standard Deviation
Standard deviation is widely used as a measure of spread because it is a simple calculation to understand and use.
Sample Standard Error of the Mean
Skewness
Standardized Skewness
Kurtosis
Standardized Kurtosis
Weighted Average
Estimation and Testing
Distribution Functions and Parameter Estimation
Bernoulli Distribution
Discrete Uniform Distribution ˆ
Erlang Distribution
Exponential Distribution βˆ = 1
Uniform Distribution
Chi-Square Test for Distribution Fitting
Kruskal−Wallis Test Average rank of treatment
Regression
Statistical Quality Control
Subgroup Statistics Subgroup means
Bar Charts
CuSum Chart for the Mean
Time-Series Analysis
Categorical Analysis
Somer’s D Measure
Pearson’s R Measure R =
Tau C Measure
Combination
Fundamentals of Economic Analysis
Simple Interest
Compound Interest
The effective interest rate is the simple interest rate that would give the same accumulated amount in 1 year as the nominal interest rate compounded annually. The principal P is often referred to as the present value, and the accumulated value A is called the future value because it is realized at a future time. How much money must be deposited in a bank that pays interest at a rate of 3% per year, compounded monthly, so that the accumulated amount at the end of 5 years will be $15,000.
Annuities
Let's look at the future value of $1000 paid at the end of each month into an account that pays 8% annual interest for 30 years. Note: This is much greater than the sum of the payments because many of those payments earn interest for many years.
Amortization of Loans
Interest and Equity Computations
Assume that a project to improve manufacturing productivity is to be financed by borrowing $500,000 from an industrial development bank. The first payment on the loan must be made exactly 1 month after financing has been approved. Note that very little equity is accumulated during the first 3 years of the loan plan.
The effects of inflation, depreciation, property appreciation and other economic factors are not included in the analysis presented above, but the decision analysis should include such factors whenever they are relevant to the loan situation.
Equity Break-Even Formula
Sinking Fund Payment
Economic Methods of Comparing Investment Alternatives
Present Value Analysis
S estimated departure value of assets at the end of their useful life and investment interest rate. Therefore, the general equation for analyzing the annual value is NAV= −CR−A. 5.12) Internal rate of return analysis.
Incremental Analysis
Guidelines for Comparison of Alternatives
Asset Replacement and Retention Analysis
Defender First Cost: The current market value of the defender is the correct estimate for this term in the replacement study. Challenger First Cost: This is the amount that must be recovered when you replace a defender with a challenger. Sunk costs: This is the difference between an asset's book value (BV) and its market value (MV) in a given period.
The useful life, on the other hand, is the period an asset is kept in productive service.
Replacement Analysis Computation
Marginal cost: It is the additional cost of increasing production output by one additional unit using the current asset. Pre-tax and after-tax analysis: Replacement analysis can be based on pre-tax or after-tax cash flows; however, it is always better to use after-tax cash flows to account for the effect of taxes on substitution decisions.
Depreciation Methods
Depreciation Terminology
Market Value: This is the estimated amount that could be realized if the asset were sold on an open market. Depreciation or recovery rate: This is the fraction of the initial cost that is removed by depreciation each year. Depending on the depreciation method, this rate may be different for each recovery period.
Half Year Convention: This is used with modified accelerated cost recovery system (MACRS) depreciation method which will be discussed later.
Depreciation Methods Let
Declining Balance (DB) Method The DB annual depreciation charge is
Sums-of-Years’ Digits (SYD) Method The annual depreciation charge is
MACRS Method
Effects of Inflation and Taxes