Salas is a fellow of the American Psychological Association (SIOP and Division 21) and the Human Factors and Ergonomics Society, and he is a recipient of the Department of the Navy's Meritorious Civil Service Award. Hal is a past president of the Human Factors and Ergonomics Society (HFES), the International Ergonomics Association, and the Board of Certification in Professional Ergonomics.
G. Allread
Matthew Beaubien
Shawn Burke
R. Easter
C. Elm
Fleischer
W. Gualtieri
F. Soames Job
S. Marras
Mokray
Steven Moore
Potter
Roitman
M. Roth
University of New South Wales Department of Aviation Sydney, Australien TF1539_C00.fm Side xiv Onsdag, december AM.
Physical Methods
Psychophysiological Methods
Behavioral and Cognitive Methods
Team Methods
Environmental Methods
Macroergonomic Methods
Aims of the Handbook
The main purpose of this handbook is to provide a comprehensive, authoritative and practical account of human factors and ergonomic methods. It is intended to encourage people to make full use of human factors and ergonomic methods in system design.

Layout of the Handbook
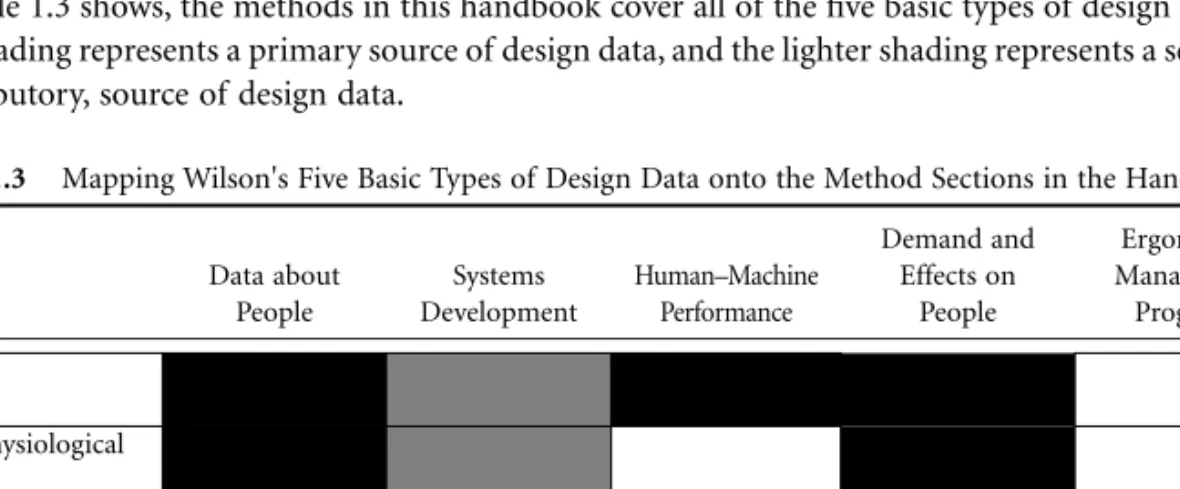
Each section of the manual begins with an introduction written by the editor of that section. As Table 1.3 shows, the methods in this manual cover all five basic types of design data.
Layout of Each Entry
Other Methods Books
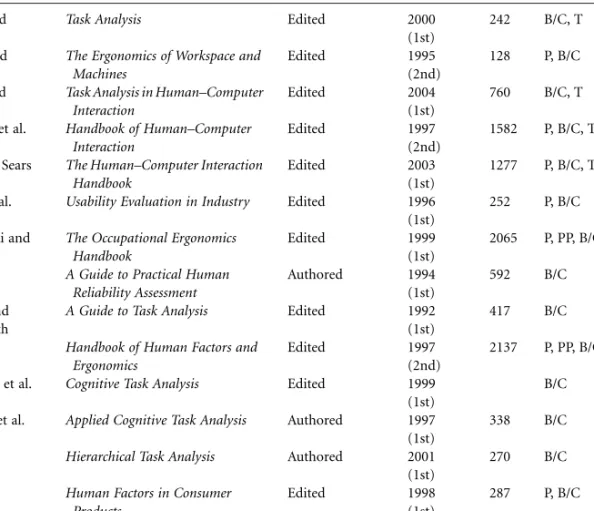
An analysis of fifteen other books on methods published over the past ten years shows the range of edited and written texts in this area, the length of the books and their coverage. The selection of the correct text will depend on the intended scope and scope of the required ergonomic intervention.
Challenges for Human Factors and Ergonomics Methods
The methods in this section are representative of the range of methods available to the ergonomist. The Dutch Musculoskeletal Survey represents one of the most comprehensive and thoroughly validated survey measures of musculoskeletal discomfort.

Background and Applications
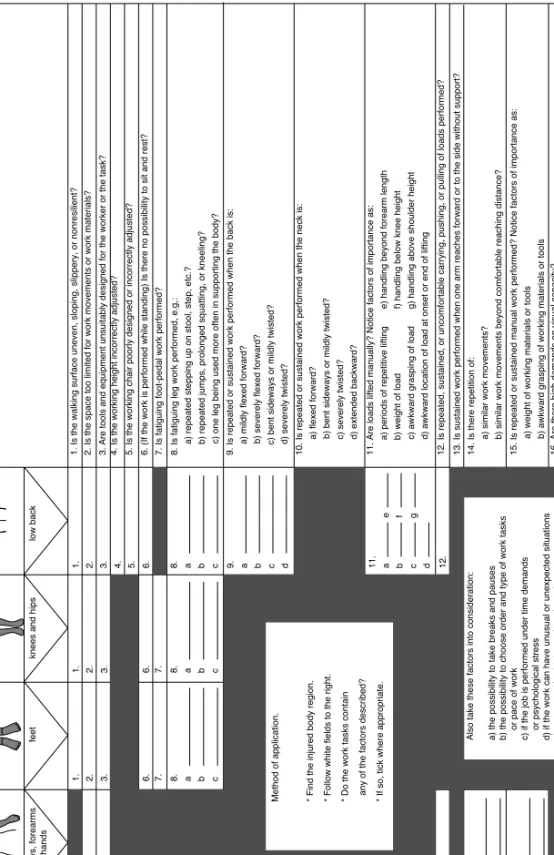
Consider important factors such as: a) periods of repetitive lifting e) handling beyond forearm length b) weight of the load f) handling below knee height c) awkward grasping of the load g) handling above shoulder height d) awkward location of the load at the beginning or end of the lift 12. Is endurance work performed when one arm reaches forward or sideways without support?.
Procedure
Advantages
Disadvantages
Example
Related methods
Two researchers, who had each practiced AET and PLIBEL and completed many workplace assessments, identified 18 matching items in the two methods. The two observation methods were then used simultaneously for observations of a total of 25 employees, male and female, with different tasks.
Standards and Regulations
After a thorough review of the literature, the German ergonomic task analysis procedure AET (Arbeitswissenshaftliche Erhebungsverfahren zur Tätigkeitsanalyse) was chosen as the reference tool for field testing (Rohmert and Landau, 1983). When the results of PLIBEL and AET were compared, the agreement between the matched items was significant.
Approximate Training and Application Time
But while AET analyzes all components in the human-at-work system, PLIBEL focuses on one extreme phenomenon, ie. to the occurrence of an ergonomic hazard. However, changes in AET scores for dichotomous coding could not completely eliminate the differences between the methods.
Reliability and Validity
Are the results of different users of the PLIBEL method consistent when observing the same work situation. In addition, PLIBEL has been used for ergonomics education both in industry and in the Swedish school system.
Tools Needed
The PLIBEL has been translated into several languages, including English, Dutch, French, Spanish (Serratos-Pérez and Kemmlert, 1998), and Greek (Serratos-Pérez and Kemmlert, 1998).
Background
All of the remaining studies examined discomfort.
Discomfort Survey Methods at NIOSH
- Defining the Location of Discomfort
- Assessing the Nature of Discomfort
Discomfort surveys used in most of the NIOSH studies in Table 4.1 take a slightly different approach. Eleven of the 12 NIOSH studies (all but study 1) that rated the duration of discomfort used the scale shown in Table 4.2 or a close variation of this scale.
Quality of NIOSH Discomfort Survey Methods
- Reliability
- Validity
In addition to the UMUEQ studies, test-retest reliability studies of the SNQ were described by Kourinka et al. Analyzes of data subsequently collected in two other NIOSH studies (Lowe et al., 2001;
Summary and Implications
Department of Human Services, Public Health Service, Centers for Disease Control and Prevention, National Institute for Occupational Safety and Health, Cincinnati. Department of Human Services, Public Health Service, Centers for Disease Control and Prevention, National Institute for Occupational Safety and Health, Cincinnati.
Background and Application
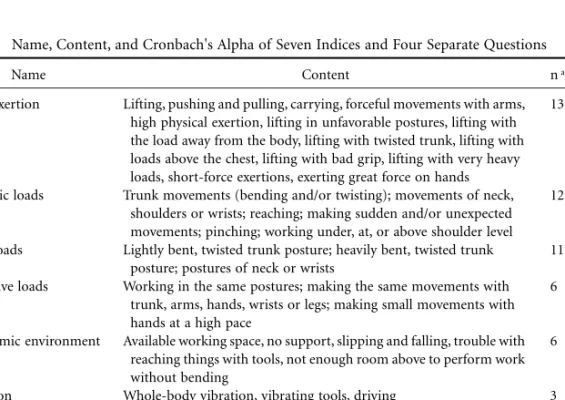
The questions are formulated to indicate the presence or absence of exposure and not the amount of discomfort caused by the exposure, which is addressed in a separate section of the questionnaire. The precise wording is based on several field studies using preliminary versions of the questionnaire.
Procedure
- Preparation
- Defining the Population at Risk
- Introduction of the Project in the Worker Groups Involved
- Analysis of Prevalent Tasks in the Groups
- Defining the Way the DMQ Is Administered to the Workers Three possible options are
- The Actual Survey
- Data Entry, Data Analysis, and Report
- Implementation of Results
- Advantages
- Related Methods
- Standard and Regulations
- Approximate Training and Application Times
- Costs
- Reliability and Validity
- Tools Needed
Based on the results of the screening, those groups or workplaces that require a more complete ergonomic analysis, using more sophisticated methods, can be identified and prioritized. To study the validity of the physical workload questions, four homogeneous groups of workers (VDU [visual display unit] workers, office workers, dispatch workers and assembly workers) completed the questionnaire and were observed (via video) performing their tasks main.
Background and Applications
Procedure
- Step 1: Self-Training
- Step 2: Observer’s Assessment Checklist
- Step 3: Worker’s Assessment Checklist
- Step 4: Calculation of Exposure Scores
- Step 5: Consideration of Actions
Advantages
Disadvantages
Example of QEC Output
Related Methods
4 Handbook of Human Factors and Ergonomics methods .. questionnaires and focus groups and by asking the potential users — health and safety practitioners .. to design an exposure tool for themselves [Li and Buckle, 1999a]), as well as by a " think-aloud' approach to understanding the methods health and safety practitioners adopt when undertaking a risk assessment in the workplace (Bainbridge and Sanderson, 1995).
Standards and Regulations
Approximate Training and Application Times
- Reliability and Validity
- Tools Needed
2003), The development of action levels for the 'Quick Exposure Check' (QEC) system, in Contemporary Ergonomics 2003, McCabe, P.T., Ed., Taylor & Francis, London, pp. 1999a), Evaluating Change in Exposure to Risk for Musculoskeletal Disorders: A Practical Tool, HSE Contract Report 251/1999, HSE Books, Suffolk. 1999b), Current techniques for assessing physical exposure to work-related musculoskeletal risks, with emphasis on posture-based methods, Ergonomics.
QEC User Guide
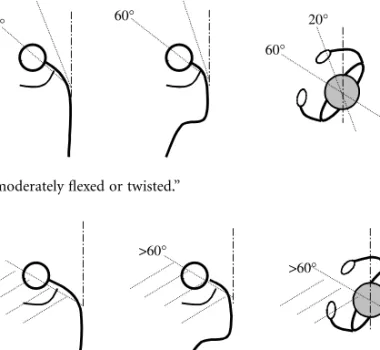
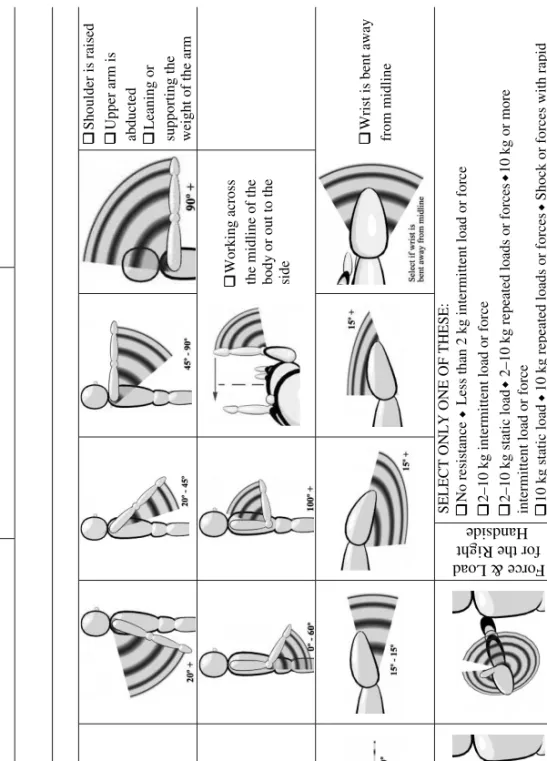
Otherwise, if an obvious wrist angle can be observed during the task, the wrist is considered to be "deflected or flexed" (Figure E2). This refers to movement of the wrist/hand and forearm, excluding finger movement.
Worker’s Assessment
Table of Exposure Scores
- Background
- Applications
- Measuring Musculoskeletal Risk
- Compare Current and Modified Workstation Designs
- Evaluate Outcomes
- Educate Workers
- Procedure
- Observing and Selecting the Postures to Assess
- Scoring and Recording the Posture
- Action Level
- Example
- RULA Used in Design and Development Process
- RULA Used in Early Intervention and Risk Assessment Related to Musculoskeletal Strains and Sprains
- Approximate Training and Application Times
- Reliability and Validity
- Costs and Tools Needed
- Related Methods
The RULA score of the posture depicted in Figure 7.2 is presented in Table 7.2, along with relevant comments about the score. Left Forearm Working across the midline of the body or out to the side.
Acknowledgments
Background
Examples of detailed event-driven tools include a three-dimensional observation system (Hsiao and Keyserling, 1990) or the NIOSH (National Institute for Occupational Safety and Health) equation (Waters et al., 1993), which requires information about specific parameters to give high sensitivity. Time-driven field tools such as OWAS (Ovako Work Posture Analysis System) (Karhu et al., 1977) offer high generalizability but low sensitivity (Fransson-Hall et al., 1995).
Application
Procedure
- Observe the Task
- Select Postures for Assessment
- Score the Postures
- Process the Scores
- Calculate REBA Score
- Confirm the Action Level
- Subsequent Reassessment
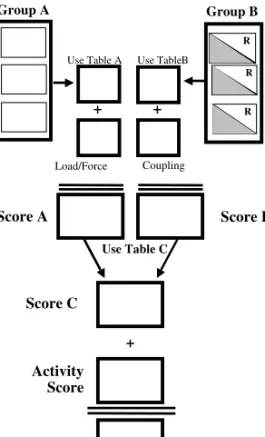
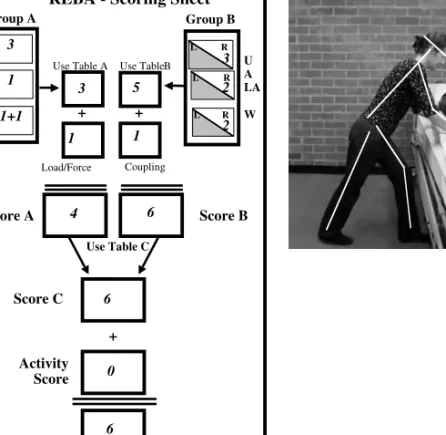
The load/force score (Table 8.1), the joint score (Table 8.2) and the activity score (Table 8.3) are shared at this stage. This is recorded in the box on the score sheet (Figure 8.1) and added to the load/force score (Table 8.1) to give the A score.
Example
- Scoring Figure 8.4 — Correct Posture
- Scoring Figure 8.5 — Poor Posture
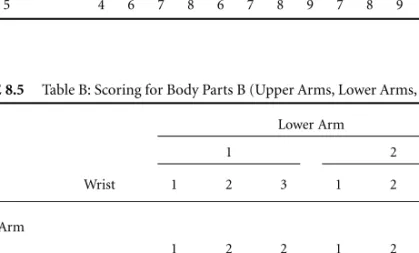
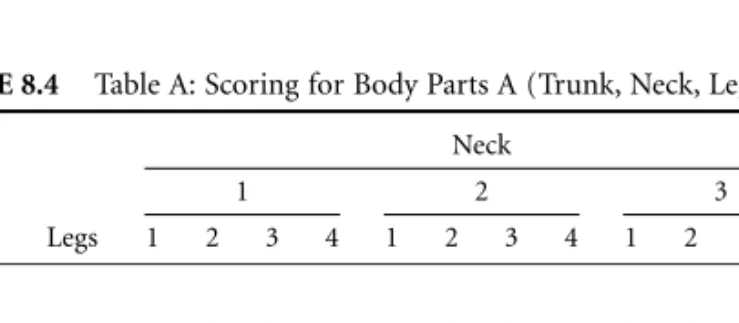
Using table A (Table 8.4), for group A (trunk, neck and legs), three posture scores are entered to give a score of 3. This gives a score of 5, which is added to the merge result (1) to produce a B score of 6.
Related Methods
Standards and Regulations
Approximate Training and Application Times
Reliability and Validity
Tools Needed
1999), Assessing Change in Exposure to Risk for Musculoskeletal Disorders: A Practical Tool, Contract Research Report 251/1999 (HSE), Her Majesty's Stationery Office, Norwich, UK. 1993), RULA: a survey method for the investigation of work-related disorders of the upper limb, Appl. OSHA (2000), Final Ergonomics Program Standard, regulatory text (draft), OSHA, U.S. 1995), HARBO, a simple computer-aided observation method for recording work postures, Scand.
Background and Application
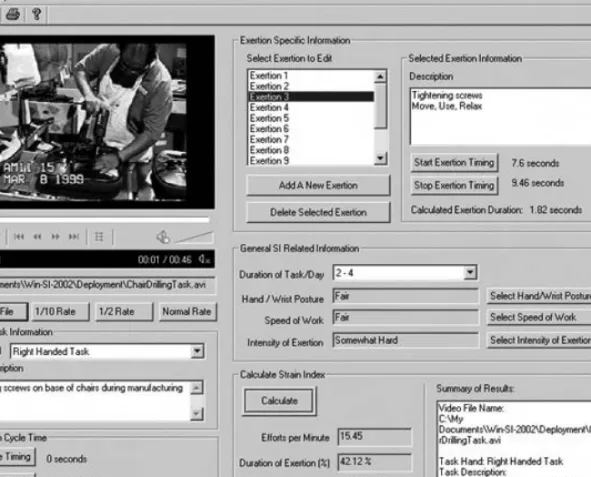
The strain index uses six task variables to describe hand effort: intensity of effort, duration of effort, effort per minute, hand/hand posture, work speed (how fast), and time per day. The strain index includes direct measurement of exertion duration, effort per minute, and duration per day, and assessment or direct measurement of exertion intensity, hand/wrist posture, and work speed.
Procedure
To date, studies of the predictive validity of the strain index suggest that a strain index score of 5.0 best distinguishes between jobs with and without a history of workers who have developed distal upper extremity disorders (Knox and Moore, 2001 ; Moore and Garg Moore et al., 2001; Rucker and Moore, 2002). A job or task with a strain index score of less than 5.0 would be considered "safe." A job or task with a strain index score greater than 5.0 would be considered "hazardous." When a hazard is anticipated, examination of multiplier values can reveal intervention strategies that would make the job or task safer.
Advantages
Data collection on exertion intensity, hand/wrist posture, and work speed is usually done qualitatively using the rating table directly.
Disadvantages
Example
Related Methods
Standards and Regulations
Approximate Training and Application Time
Reliability and Validity
Tools Needed
Background and Applications
Typically, postures are documented in terms of the position of joints or body segments or the duration from the neutral position (Bohr, 1998). Indeed, the Army Computer Workstation Checklist (ACWC) included in this application assesses the individual's posture while working on a computer.
Procedure
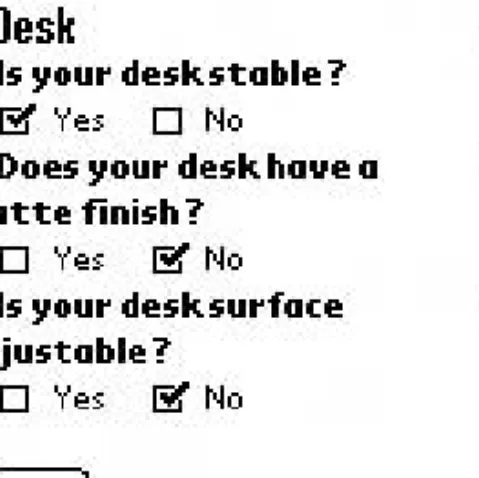
The pen interface allows users to interact with the PDA in a natural and familiar way by entering text, numbers, and graphics directly on the screen using "electronic ink" (Figure 10.1). Most health and rehabilitation applications of the PDA are physician-centered (Sittig et al., 1998).
Advantages
A posture checklist found in a document developed by the Department of Defense (2002) has also been implemented on a PDA (Field Informatics, 2001). The checklist is designed as an informational guide for use by supervisors and end users.
Disadvantages
Approximate Training and Application Times
Reliability and Validity
Tools Needed
Acknowledgment
Background and Application
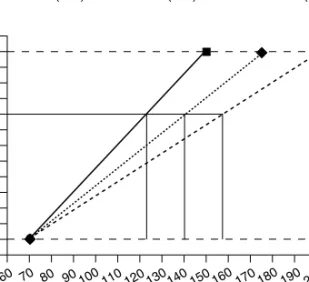
Ratio scaling methods have been developed for most types of sensory stimulus-response (S-R) functions (Stevens, 1975), and this works well for relative S-R functions, but not for direct intensity levels. The second was developed to assess most types of perceptions and feelings, including experiences of work tasks (with emphasis on human factors and ergonomics).
Procedure
- The Borg RPE Scale ®
- Category-Ratio (CR) Scaling
- Administration of the Scales
Objective instruction should be subjectively checked by the test administrator to ensure comparable understanding between the individuals to be assessed. The test administrator should review the literature regarding the specific tasks being assessed (eg, for perceived effort [Borg, 1998]).
Advantages
High-frequency, repetitive, monotonous work that lasts for hours, e.g. working in the fast pay line is a kind of "treacherous task" as it is not considered particularly difficult. Even if it is only considered "light" to "moderate" intensity, it can be a risky job in the long run ("Cinderella" kind).
Disadvantages
Example Output Table and Figure
Related Methods
Standard and Regulations
Approximate Training and Application Time
Reliability and Validity
Tools Needed
Background
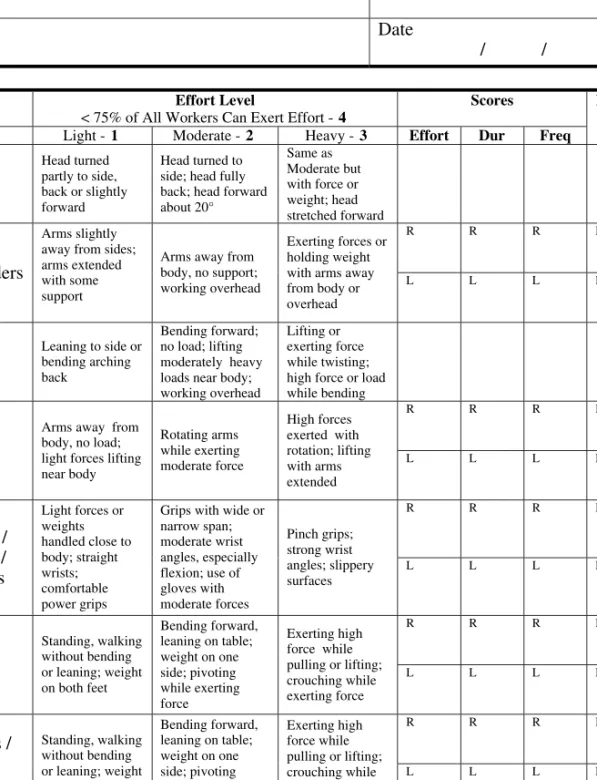
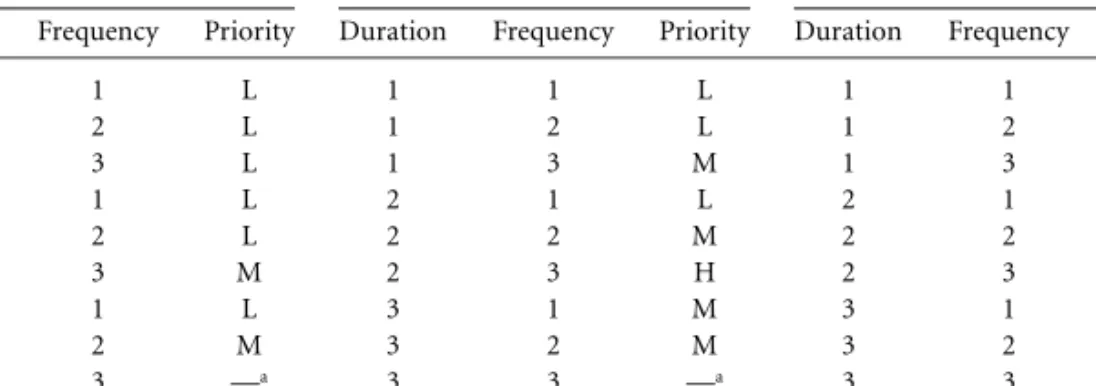
A fourth level for each of the factors was added that defines when the method will underestimate the fatigue or injury risk. If any of the factor ratings is a 4, the analyst is told to automatically give the task the highest priority for change.
Applications
Alternatively, the 10-point scale for large muscle group activity (Borg and Lindblad, 1976) can be used to allow workers to determine the level of effort for each body part. Multiplying the scale rating by 10 approximates the percentage of maximum muscle effort for the fatigue rating rating.
Procedure
Risk exposure reduction strategies can be developed by defining exercise level through identification of postural and force intensity risk factors and evaluating work patterns that increase or decrease the risk of fatigue. Asking why the attitude is there, why the strength is so high, or why the effort takes so long can lead to new strategies for improving the task.
Example Using the Muscle Fatigue Analysis Method to Study Carpet Installation in Car Assembly
However, this was still insufficient due to the need to wear the carpet for 8 to 10 seconds before placing it in the back compartment (a 321 upper limb rating, high priority due to the size of the carpet and poor grip situation). Complaints about the carpet installation were rarely heard after the carpet changes were made.
Advantages
The ultimate solution was to split the carpet and shape it so that it would lie flat in the compartment, with less pressing and less force. While the cost of redesigning the carpet was significant, the savings in labor (which had been added due to the fatigue), the improved quality of the installation, and the reduced risk of injury paid for the costs in a short period of time.
Disadvantages
Related Methods
Standards and Regulations
Approximate Training and Application Time
Reliability and Validity
Tools Needed
1987 bis 2002) nutzten Ergonomie-Teamschulungen die Methode „Muscle Fatigue Assessment“ zur Analyse von Produktions- und Servicearbeiten sowie der persönlichen Kommunikation. 1960a), Bestimmung vor Ruhepausen für statische Arbeit des Menschen, Int. 1960b), Zur Theorie der Ruhepausen bei dynamischer Arbeit, Int. 1973a), Probleme bei der Ermittlung von Ruhezeiten: Teil 1, Einsatz moderner Methoden zur Belastungsbewertung bei statischer Muskelarbeit, Appl.
Background and Application
In these studies, the worker was given control of one of the task variables, usually the weight of the object being handled. The worker then monitored his or her feelings of exertion or fatigue and adjusted the weight of the object accordingly.
Procedure
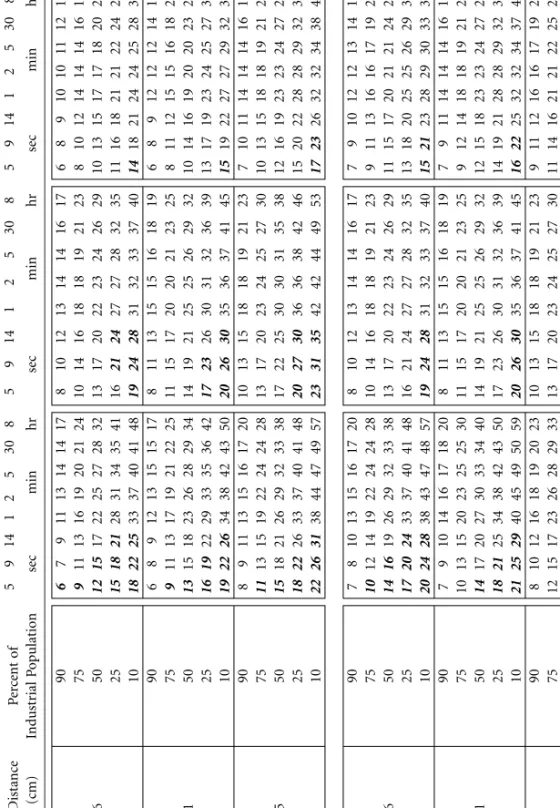
Use the width of the box or object to identify the correct set of rows (top, middle, or bottom) in the table. Use the height of the hands above the floor to identify the correct sequence of rows in the table.
Advantages
It is also important to note that some of the weights and forces in Table 13.1 through Table 13.9 will exceed recommended physiological criteria when performed continuously for 8 hours or more. Weights and forces that exceed these criteria appear in bold italics in Table 13.1 through Table 13.9.
Disadvantages
Examples
What is the maximum acceptable weight for 90% of men lifting a 34 cm wide box with gloves for a distance of 76 cm from the floor once per minute. What is the maximum acceptable weight for 75% of men who lift a box 34 cm wide with gloves for a distance of 76 cm between the floor and the height of the wrist, hold it at a height of 79 cm for 8.5 m and more after lowering it returns to the original height.
Related Methods
What is the maximum acceptable initial force for 75% of women pushing a cart with a 89 cm handle a distance of 15.2 m once every 5 min.
Standards and Regulations
Approximate Training and Application Time
Reliability and Validity
The 1981 NIOSH Work Practices Guide underestimated the risk by predicting that most jobs were low risk (low sensitivity, high specificity). Other studies have also concluded that recommendations based on psychophysical outcomes can reduce back disorders in industry (Snook et al., 1978; Liles et al., 1984; Herrin et al., 1986).
Tools Needed
13-22 Handbook of Human Factors and Ergonomics Methods were predictive of low back pain, but in different ways. 1978), A study of three preventive approaches to low back injury, J. 1960), The psychophysics of sensory function, Am.
Background and Application
Procedure
- Placement of LMM on Worker
- Determination of a Job’s MMH Components
- Data Collection
- Analysis
- Descriptive Information about Trunk Kinematics
- Probability of High-Risk Group Membership (LBD Risk)
The more data collected, the more likely it is to represent the job's requirements. These results can guide the user in making recommendations for improving work performance (i.e. lowering LBD risk) from an ergonomic perspective.
Advantages
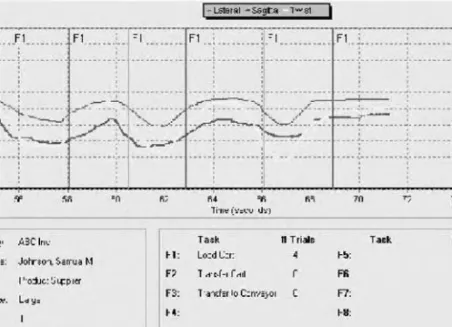
This information can be useful for general descriptions of the MMH performed or for comparisons with other tasks or jobs. These estimates allow the user to quantify which work factors (eg, sagittal flexion, twisting speed, lifting speed) are most likely responsible for the level of hazard produced.
Disadvantages
Risk levels are compared to a database of current workplace factors and trunk movements previously found to have high and low LBD rates.
Example Output
Related Methods
Approximate Training and Application Time
Reliability and Validity
Changes in injury rates and risk assessments were analyzed against a comparison group of jobs where no changes had been made. The results indicated that a statistically significant relationship existed between changes in the job's estimated LBD risk and changes in their actual incidence of low back pain during the observation period.
Tools Needed
Background and Applications
. The methods are not suitable for assessing works that use a keyboard and mouse, or other computerized data entry tools.
Procedures
- General Aspects
- OCRA Definitions
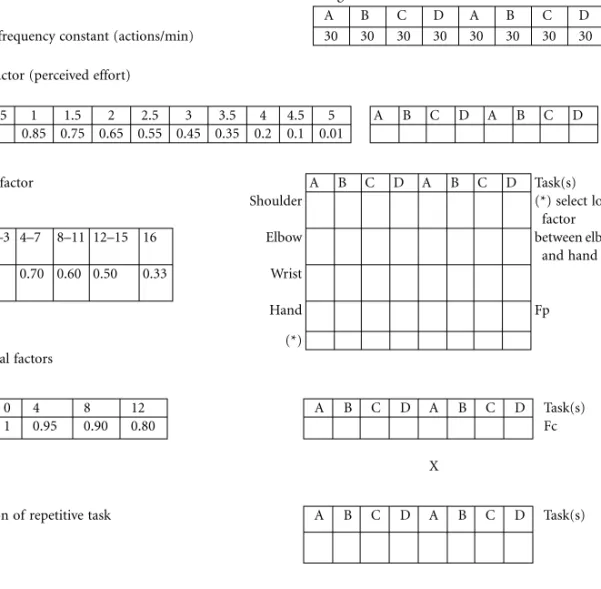
- Action Frequency Constant (CF)
- Force Factor (Ff)
- Postural Factor (Fp)
- Duration Factor (Fd)
- Calculation of OCRA Exposure
- Example of How to Use the OCRA Index to Redesign Tasks/Workstations Once the workstation has been analyzed using the OCRA index, and after checking for the presence of
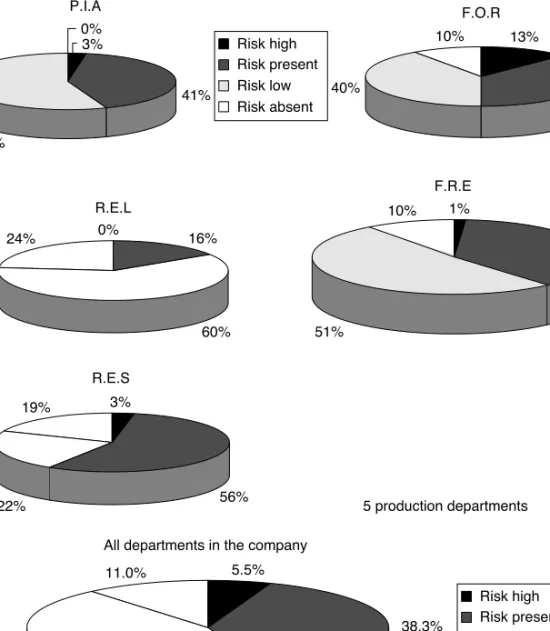
- Classification of OCRA Index Results
- OCRA Checklist
4 - THE ELBOW MAKES SUDDEN MOVEMENTS (JUNKING MOVEMENTS, SNAPTING MOVEMENTS) OVER HALF OF THE TIME. AND/OR HANDS, REPEATED FOR AT LEAST 2/3 OF THE TIME (please cross 3, even if the cycle is shorter than 15 seconds) E 3.
Advantages
Because the numerical values shown in the checklist are calibrated with the multiplier factors of the OCRA index, the final value of the checklist can be interpreted in terms of its correspondence with the OCRA values.
Disadvantages
Related Methods
Standards and Regulations
Another European directive, 98/37/EEC and relevant amendments, sets essential safety and ergonomic requirements in the design, construction and marketing of new machines. Standard 1005-5, still in the draft stage, deals with low-force, high-frequency hand activities.
Approximate Length of Training and Application
Reliability and Validity
Tools Needed
2002), Valutazione e gestione del rischio dei movimenti ripetitivi e degli sforzi degli arti superiori, vol. 1996), Alterazioni muscoloscheletriche degli arti superiori dovute a sovraccarico biomeccanico: metodi e criteri per la valutazione dell'esposizione professionale, Med. 2004), Metodo OCRA: aggiornamento dei valori di riferimento e dei modelli di previsione per UL-WMSD in gruppi professionali esposti a movimenti e carichi ripetitivi degli arti superiori, Med. 2000), Proposta e convalida preliminare di una lista di controllo per la stima dell'esposizione professionale ai movimenti e agli sforzi ripetitivi degli arti superiori, Med.
Background and Application
In a recent study, Ulin and Chaffin (1997) calculated a disc load of 1020 kg when moving an uncooperative patient weighing 95 kg. The MAPO exposure index was calculated on 440 different types of hospital and residential (nursing home) wards for both acute and long-term patients (with few exceptions) and for 6400 nurses exposed to manual patient handling.
Procedures
- General Aspects
- Disabled Patient/Operator Ratios (NC/Op and PC/Op)
- Lifting Factor (LF)
- Minor Aids Factor (AF)
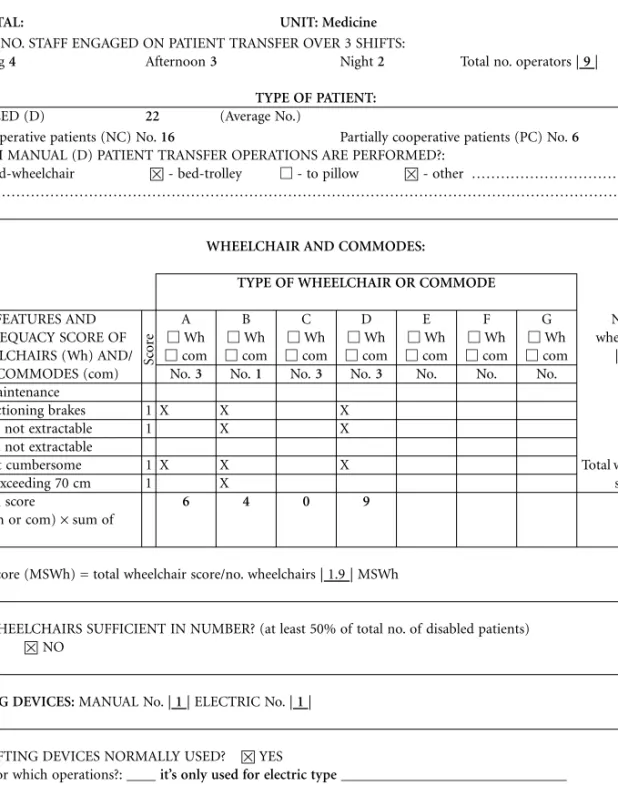
- Wheelchair Factor (WF)
- Environment Factor (EF)
- Training Factor (TF)
- General Features of the Calculation Model of MAPO Index MAPO synthetic exposure index is calculated using the following expression
- Classification of MAPO Index Results
The relative factor was assigned a reducing value (0.5), considering that the presence of these aids reduces the number of operations in question. By sufficient number we mean the presence of a number of wheelchairs equal to at least half of the disabled patients in the unit.
Advantages
In the cases where no type of training was given, the frequency severity of the overload movements was doubled (training factor 2). Within this range, the prevalence of low back pain appears to be identical to that of the general population (3.5%).
Disadvantages
Related Methods
Standards and Regulations
Approximate Training and Application Time
Reliability and Validity
Tools Needed
There are many reasons why measuring the mental workload of operators is gaining great interest these days and will increasingly enjoy this status in the near future. Measurement of most of the physiological parameters involved is relatively easy, or at least feasible, in the work environment.
Background and Applications
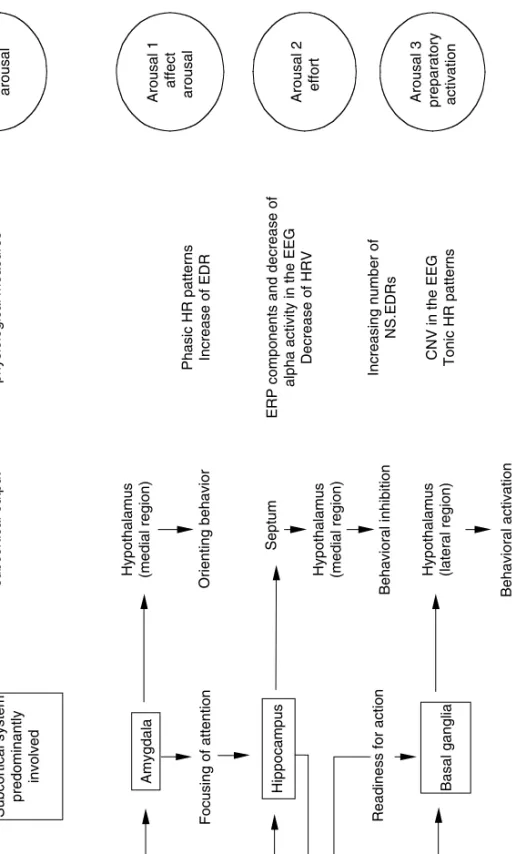
In the context of task-related information processing, an increase in phasic EDA indicates orienting or directing one's attention to a stimulus, whereas an increase in tonic EDA indicates readiness for action (Figure 18.1).
Procedure
- Recording Sites
- Electrodes and Electrolyte
- Recording Devices
- Signal Storage and Evaluation
- Precautions
Physiological Measurement Examples Phasic HR Patterns Increase in EDR ERP Components and Decrease in Alpha Activity in the EEG Decrease in HRV Increasing Number of NS.EDRs CNV in the EEG Tonic HR Patterns. The top output, USCR, in the lower part of the figure gives an amplified SCR, while the bottom output, UOUT, gives the total SCL.
Advantages
Disadvantages
Example of Electrodermal Measurement in Human Factors/Ergonomics
- Recording
- Data Storage and Analysis
The adhesion of the EDA electrodes was improved by using a skin-friendly adhesive to attach the collars to the skin. The sites were pre-treated with rubbing alcohol to further increase the adhesion of the collars.
Standards
Approximate Training and Application Times
Reliability and Validity
Costs and Tools Needed
Related Methods
