Chapter 252 deals with structural and thermal properties of rare earth compounds under high pressure in relation to their electronic and magnetic properties. Rogl, Phase equilibria in ternary and higher order systems with rare earth elements and silicon 1.
INTRODUCTION
New electronic properties of rare-earth compounds are due to the existence of localized 4f electrons, which generally have strong electron correlations and unstable electronic states. In this chapter we present the structural and thermal properties of rare earths under high pressure in conjunction with their electronic and magnetic properties.
STRUCTURAL STUDIES OF RARE EARTH COMPOUNDS USING DIFFRACTION TECHNIQUES UNDER HIGH
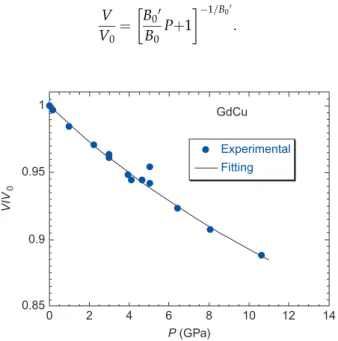
X-ray diffraction .1 GdCu
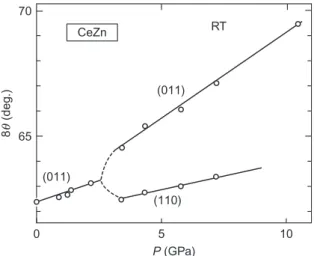
The pressure variation of the axial angle of the rhombohedral cell is shown in Figure 3 (Uwatoko et al., 1992b). The lattice constants of this compound were measured by X-ray diffraction under high pressure up to 13 GPa at room temperature (Ohmura et al., 2009).
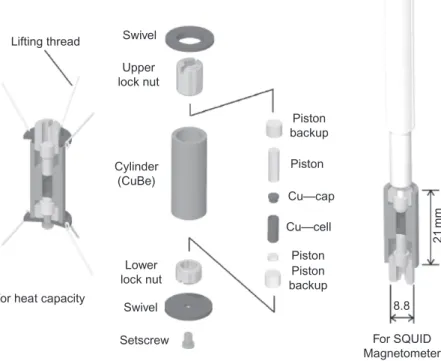
Neutron diffraction under high pressure .1 Micro-pressure cell
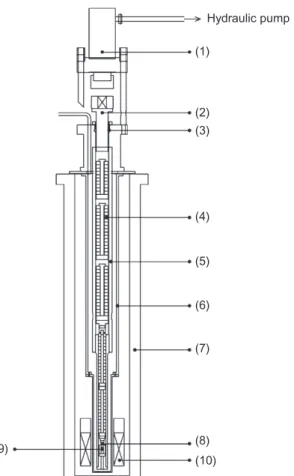
Hardened CuBe alloy was used for the bulk of the cell to obtain the maximum pressure of 2 GPa (Aso et al., 2006b). The pressure was estimated by determining the change in the lattice parameter of NaCl (Skelton et al., 1984).
THERMAL PROPERTIES UNDER HIGH PRESSURE 1 General survey
Experimental measurements at high pressure .1 Specific heat
Teflon can also be used for the sample cell, but the heat capacity shows a strong pressure dependence, which increases the uncertainty of the background. During the measurements of the heat capacity under pressure, changes in the heat capacity of the printing media must be taken into account. To avoid complications due to the pressure variations of the specific background heat, it is possible to use solid AgCl as the pressure transfer medium.
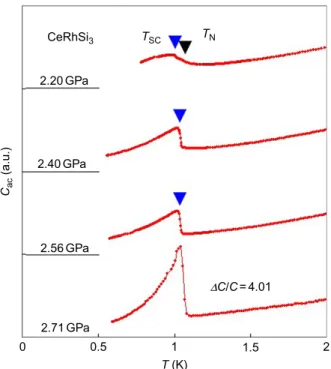
However, liquid medium such as Fluorinert 70/77 is preferred for better applied pressure hydrostaticity. The specific heat of CeRhSi3 has been measured at high pressure and will be described in detail in the next section. Figure 29 shows the temperature dependence of the specific heat of the pressure cell, Fluorinert 70/77 and the sample at ambient pressure. It can be seen that the heat capacity of the pressure medium is a smooth function of temperature and a peak due to the AFM transition is clearly observed at 1.6 K.
Heat capacity at high pressure
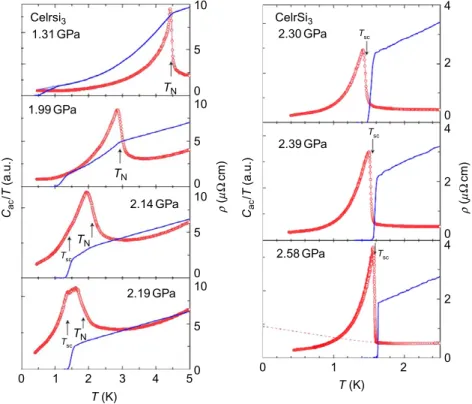
However, the electronic specific heat coefficient atTscis is approximately unchanged as a function of pressure, even atPc (Tateiwa et al., 2006). Umehara et al., (2007) studied the pressure-induced superconductor CeRhSi3 with the non-centrosymmetric tetragonal structure under high pressure by means of adiabatic specific heat and AC heat capacity. At ambient pressure, a pronounced anomaly in the specific heat is observed, indicating the transition to an antiferromagnetically ordered state at TN ¼1.61 K.TN is defined as the temperature at which a peak appears in the CversusTplot.
The magnetic contribution to the specific heat of CeRhSi3 can be obtained by subtracting the specific heat of non-magnetic LaRhSi3 from that of CeRhSi3. As the temperature is raised, C initially increases linearly with T (see the inset), indicating electronic specific heat g. As seen in Figure 40, the same anomaly was also detected by the ac specific heat measurements.
Thermal expansion at high pressure
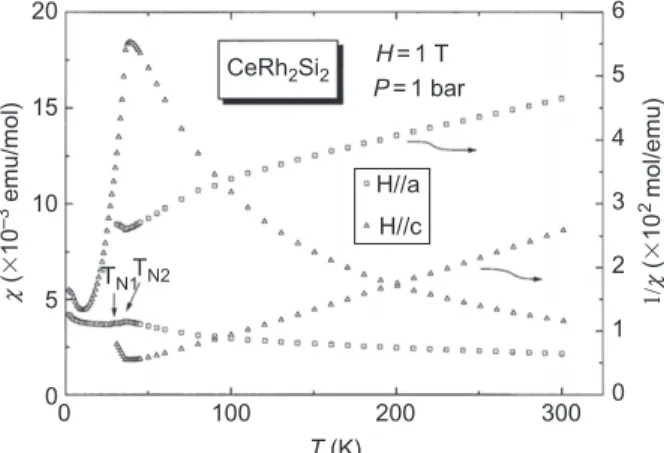
The crystal structure is orthorhombic. Figure 48 shows the coefficients of thermal expansion of single crystal CeCu6 for each crystal axis. Such an increase was also found in the coefficient of thermal expansion of single-crystal UPt3 (Visser et al., 1985). The resistivity anomaly in TN1 becomes wider with the application of high pressure, but no anomaly is observed in TN2. The exact value of the critical pressure Pc where AFM disappears is difficult to identify from previous electrical measurements (Ohashi et al., 2002).
The size of the ofof was calculated based on the Debye model and the Gru¨neisen relation (Oomi and Moˆri, 1981b). Figure 65 illustrates the oat ambient pressure values, in which the broken line shows the fitting result. The linear compressions are in the order, kb>ka>kc. Figure 68 shows the temperature dependence of the linear thermal expansion coefficients along the three crystal axes, ai(i¼a,b, and c) at ambient pressure. Assuming that acof CeNi is approximately the same as that of aV, the values of A0 are obtained as a function of pressure. Figure 71 shows the result.
MS under high pressure
To the best of our knowledge, there has been no systematic study of MS from high pressure HF compounds. This is partly due to the technical difficulties of measuring MS at high pressure. Recently, we measured MS of HF compounds at high pressure using the strain gauge method.
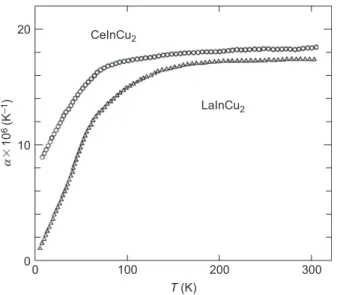
The volume of MS is defined as lV ¼lkþ2l?. MSlVar volume values are shown in Figure 73 as a function of magnetic field at ambient pressure. MS of CeInCu2 under high pressure was measured only for the direction perpendicular to the magnetic field. Thus, the decrease in inl?or with increasing pressure is qualitatively explained by an increase in TKat of high pressure.
![Figure 72 shows an example of magnetostriction of CeInCu 2 at ambi- ambi-ent pressure for the directions parallel l k and perpendicular l ? to the magnetic field H, where l i is defined as l i ¼ [l(H) l(0)]/l(0), where l(H) and l(0) are the lengths of sam](https://thumb-ap.123doks.com/thumbv2/123dok/10240891.0/113.646.144.482.602.835/figure-example-magnetostriction-pressure-directions-parallel-perpendicular-magnetic.webp)
NEW ELECTRONIC PHASE TRANSITIONS UNDER HIGH PRESSURE
Pressure-induced crossover
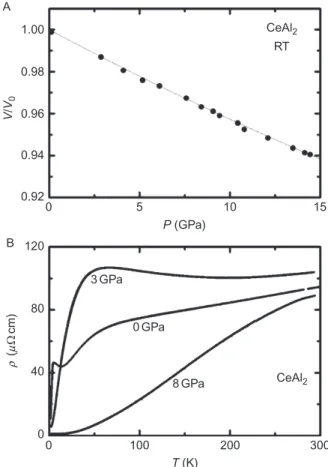
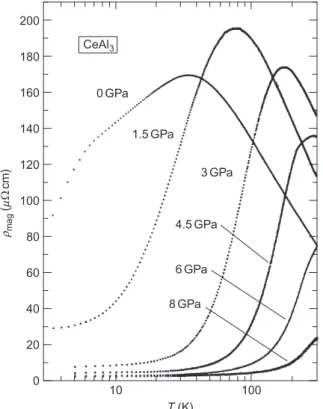
The temperature dependence of the electrical resistivity r of CeAl3 at various pressures up to 8 GPa and r of LaAl3 at ambient pressure is shown in Figure 76 (Kagayama and Oomi, 1996). The magnetic part of the electrical resistivity rmag was estimated by subtracting the phonon contribution using ther(LaAl2),rmag¼r(CeAl2)r(LaAl2), assuming that the phonon part of r(CeAl2) is approximated by r(LaAl2 rmag curves are shown in Figure 80B as a function of temperature on the logarithmic scale. The magate's ambient pressure has two maxima due to the combination of the Kondo effect and CEF splitting, which were observed up to 2.4 GPa. In summary, TK increases with pressure, while TN is decreased by applying pressure and is expected to disappear around 2.7 GPa.
The thick line shows the isothermal pressure dependence of electrical resistivity at 290 K (Miyagawa et al., 2008). The temperature Tmax of the resistance maximum increases with increasing pressure and then the maximum in the r–T curve, which is characteristic of the CK system (CKS), is not observed above 4.5 GPa in the temperature range of Figure 87. On the contrary, Tmax increases rapidly with increasing pressure; Tmaxis 27 K at ambient pressure, but increases at 300 K to about 3.8 GPa.
Pressure-induced SC
The anomaly near TN1 becomes less prominent with increasing pressure, corresponding to the pressure-induced decrease in the sublattice magnetization (Kawarazaki et al., 2000). From the dHvA experiment under high pressure, the topology of the Fermi surface changes abruptly above 1.1 GPa (Araki et al., 2001). SC in CeRh2Si2 was first discovered by Movshovich et al. 1996) for a polycrystalline sample in the pressure range above Pc2 from 0.6 to 1.6 GPa.
The value of gis is taken from the result of specific heat under pressure (Graf et al., 1997). The above relation is easily derived by using V¼abc. The coefficients of volume thermal expansion are obtained by differentiating DV/V with respect to T. Figure 121 indicates enVat different pressures below 80 K.aV. From the pressure dependence of volume (Oomi et al., 2002), the isothermal compressibility kV was calculated at different temperatures.
NEW PHENOMENA UNDER HIGH PRESSURE
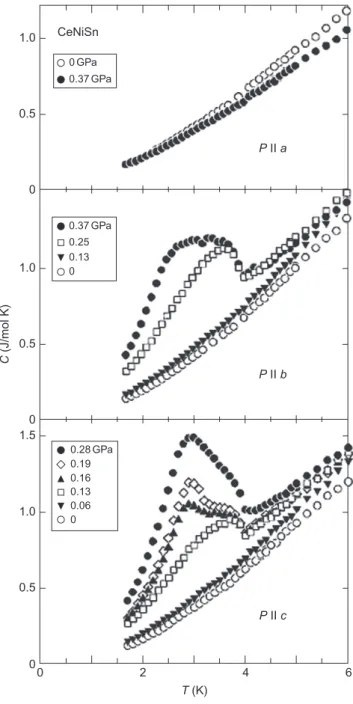
Pressure-induced magnetic order .1 CeNiSn
As for the microscopic origin of the anisotropic response, the local symmetry of Ce ions in this compound is quasitrigonal along the α direction (Higashi et al., 1993). This trigonal symmetry is believed to be a prerequisite for the formation of the pseudogap in the renormalized band that arose from the anisotropic c-f hybridization (Ikeda and Miyake, 1996; Kagan et al., 1997). This result is consistent with that of the electrical resistivity in which the P-T curve of YbInCu4 shows normal properties above Tv (Felner et al., 1987).
Electrical resistivity measurements of YbInCu4 were performed under high pressure up to 7.0 GPa and temperature up to 0.3 K (Kurita et al., 2006). The sharp FIGURE 138 Pressure dependence of the residual resistance r0 and coefficient A of YbInCu4 in the relationship r¼r0þAT2 (Kurita et al., 2006). Therefore, the improvement of coefficient A and residual resistivity r0 in YbInCu4 under pressure corresponds to a rapid decrease in the amounts observed in CeCu2Ge2 with increasing pressure (Jaccard et al., 1999).
Amorphous Ce alloys under high pressure
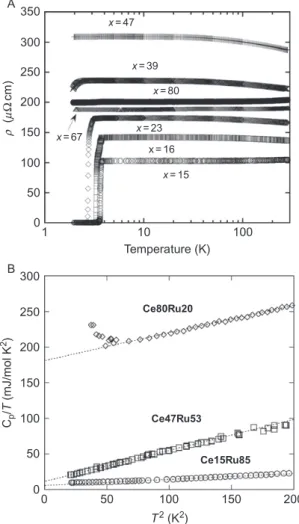
A recent study of a-CeMn alloys suggests evidence of HF from the large Aandg values with the KW plot, where the orbital degeneracy effect is noted (Amakai et al. The resistivity decreases below 32 K probably due to the development of a coherent state of the 4f electrons.The solid line is the KW relation and the dotted line is the generalized KW relation with N¼6 (Amakai et al.
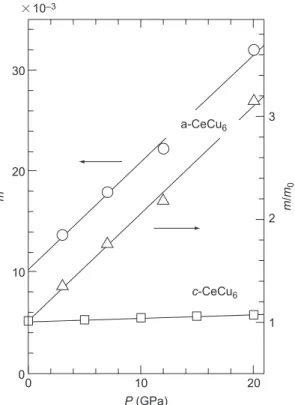
The residual resistivity r0 decreases sharply with dr0/dP = 27 mOcm/GPa, which is larger than typical HF compounds such as CeCu6 (Oomi et al., 1993b) and CeAl3 (Kagayama et al., 1994e). Since the slope of the line in Fig. 145B decreases rapidly with increasing pressure, the contribution of Kondo scattering to the resistivity decreases with application of pressure. Amorphousa-CeCu6 under pressure was also studied by Kagayama et al. (1994a). Figure 147A shows the temperature dependence of r=R(T)/R(T=200 K).
Negative MR of the magnetic multilayer Fe/Tb
The magnetic moments of the Tb layer are temperature-dependent and finally disappear at a threshold temperature of 320 K. Obviously, the MR of the multilayer Fe/Tb was increased compared to the monolayer Tb film. It is caused by the ferromagnetic order of Tb at TC219 K. Figure 152 shows a strong change in the slope of the resistivity curve of metallic Tb at 229 K for a weak antiferromagnetic state and at 219 K for a ferromagnetic one (Ohashi et al., 2009).
This means that the spin-dependent scattering is enhanced with increasing pressure, as the ferromagnetic order of the Tb layer is suppressed. Qualitatively, this result is consistent with the suggestion that the spin-dependent scattering is enhanced due to the suppression of the ferromagnetic order of the Tb layer. Since pressure suppresses the ferromagnetic order of the Tb layer, AMR effects can also be suppressed.
SUMMARY AND CONCLUSION
In Section 2, high-pressure studies of rare earth compounds using X-ray and ND techniques are described. Close relationships between SC and magnetic order were also elucidated at high pressure for UGe2 and CeRhIn5 compounds. Extremely large T2 dependence coefficients were observed at ambient pressure and their magnitude was found to decrease significantly at high pressure.
All materials mentioned in this section exhibit pressure-induced SC and NFL-like behavior near the QCP, where the ordering temperature becomes 0 at high pressure. For YbInCu4, the occurrence of magnetic order and SC at high pressure was discussed in relation to QCPs. The amount of interesting data on high-pressure rare earths collected over the decades is vast.
ACKNOWLEDGMENTS
8% MR was observed, but no increase in the MR ratio was found by applying pressure. Finally, we want to emphasize that high pressure is an excellent tool to investigate the electronic structure especially for materials that have unstable electronic states in the limit of magnetic instability. Interested readers are referred to a recent review describing progress and new trends in high-pressure research of highly correlated electron systems summarized in the following Proceedings of an International Conference, "New Pressure-Induced Phenomena in condensed matter systems". 'J.
Proceedings of the International Conference on Magnetism, Nottingham, p. Ed.), Valence Instabilities and Related Narrow Band Phenomena.