Basu for the countless hours he invested in this research and for guiding me through the process. Nikolas Nordendale for help with school work and projects in the early years, and for research advice and suggestions in the years that followed.
Motivation
All the strain values reported in the TXC tests are due to shear loading only. At time of "67µs", the formation of the ejection cloud is seen on the impact side.
BACKGROUND
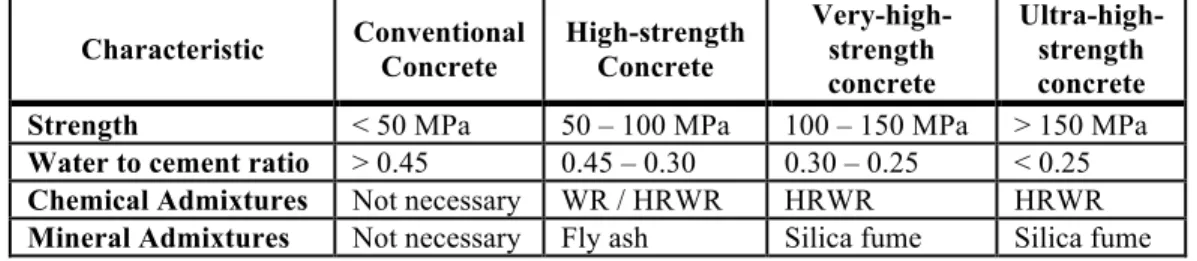
High Performance Concrete: What is HPC and why is it important?
Similarly, increasing the compressive strength of the second concrete mix from 84.4 MPa to 196.6 MPa also increased the ballistic limit by the same 20%. Although the unconfined compressive strength increased by more than 100% for both concrete mixes, the ballistic limit increased by only 20%.
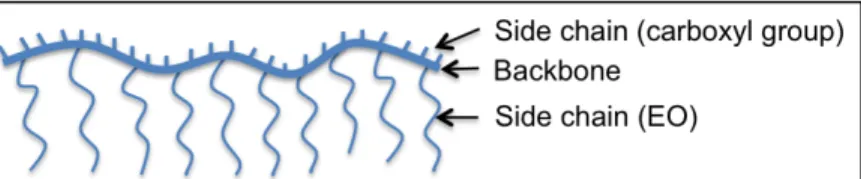
Enhancing Compressive Strength: Superplasticizers
Concrete of 50 MPa compressive strength was used for the columns of the Lake Point Tower in Chicago in 1965. The long side chains of ethylene oxide (EO) (shown in Figure 2.1) create a physical barrier that prevents reagglomeration of the cement grains .
Enhancing Compressive Strength: Cement Microstructure
The formation of calcium hydroxide crystals depends on the water-binder ratio and the local environment, but occurs during the hydration of C3S. A low water-to-binder ratio will increase strength by reducing the capillary pores in the hardened paste.
Enhancing Compressive Strength: Supplementary Cementitious Materials
ASTM defines blast furnace slag (BFS) as “the nonmetallic product, consisting primarily of silicates and aluminosilicates of calcium and other bases, that is developed in a molten state simultaneously with iron in a blast furnace” [51]. When the GBFS is ground to the same fineness as Portland cement, it is called “slag cement.”
HPCs with Enhanced Compressive Strength
- DSP cement and Reactive Powder Concrete
- HSPC, VHSC and CorTuf
DSP and RPC are commonly cited in the literature as important achievements in concrete lifting. In the 1990s, DSP and RPC served as a blueprint for ERDC researchers as they developed reinforced concrete for the Army.

HPC with Enhanced Compressive Strength and Ductility: HSHDC
Experiments with air blasts were also conducted at the ERDC in the blast load simulator (BLS) to determine the strain rate sensitivity of the performance-based design HPC. The mass ratios of components (relative to cement mass) are shown in Table 2.3 and mechanical and physical properties of the polyethylene fiber optimized for HSHDC are shown in Table 2.4.

Summary
As shown in Figure 3.31, steel fibers did not separate or settle to the bottom of the mold in the highly fluid mixture.
DEVELOPMENT OF A SCHSC
Introduction
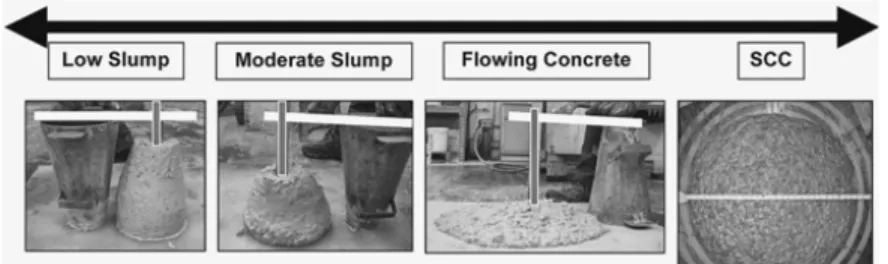
- Background of Self-Consolidating Concrete
- Fresh-state properties of a SCC
Stability (resistance to separation) - the ability of a material to maintain the homogeneous distribution of its various components during its flow and setting. The "column separation test" [81] , the "penetration test" [80] , and the "visual stability index" [80] are ASTM test methods that quantify the static stability of a mixture.
Developing a SCC
- Overview
- Fly Ash and GGBFS
Similarly, the ACI "Guide for Selecting Proportions for High-Strength Concrete" recommends replacing 15 to 25 percent of cement with Class F fly ash to provide strength gain from pozzolanic reaction during secondary hydration (as discussed in Chapter 2). A main objective of this research is to develop a high-strength concrete with self-consolidating properties.
Materials
- VMA (Purified Palygorskite Nanoclay)
- Cement
- Fly Ash and GGBFS (Slag Cement)
- Fine Aggregate
- HRWRA
It is a material's ability to retain its shape while still in the "fresh" or "green" state (immediately after the material has been mixed and molded into a desired shape). However, the study assumed 373% water absorption for palygorskite clay (by mass) and added additional water to compensate from the control mix.. recognized that clay particles could not be observed in the hydrated materials using AFM, hence the question left - whether or not pozzolanic reaction has occurred [98].
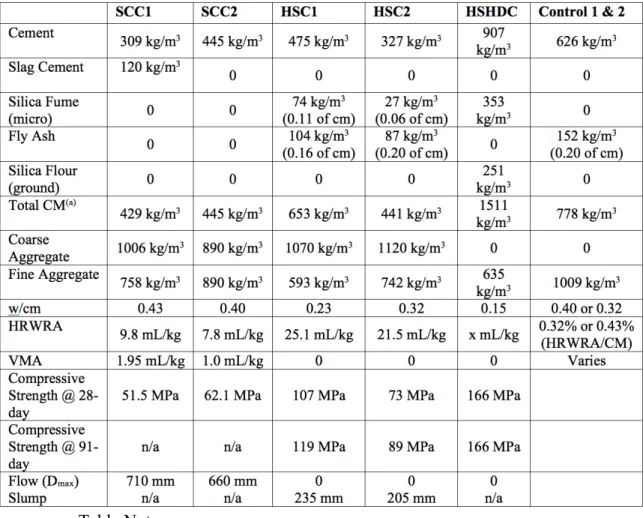
Mixture Proportions
The total amount of CM did not differ between mixtures; only the proportions of CM differ (i.e. cement, fly ash and slag).
Mixing and Casting of Specimens
After all the ingredients are thoroughly mixed, further mixing was continued at full pressure for five minutes and then stopped. Drop flow, flow rate (T500) and J-ring tests were performed immediately after mixing was stopped as shown in Figure 3.3. Cubes (50.8 mm x 50.8 mm x 50.8 mm) were cast in brass molds, single fiber pull-out specimens were cast in brass molds (designed to accommodate fiber insertion lengths up to approximately 25 .4 mm) with the fiber clamped in position and the flexural beams were cast in high density polyethylene (HDPE) molds.

Specimen Preparations and Experimental Procedure
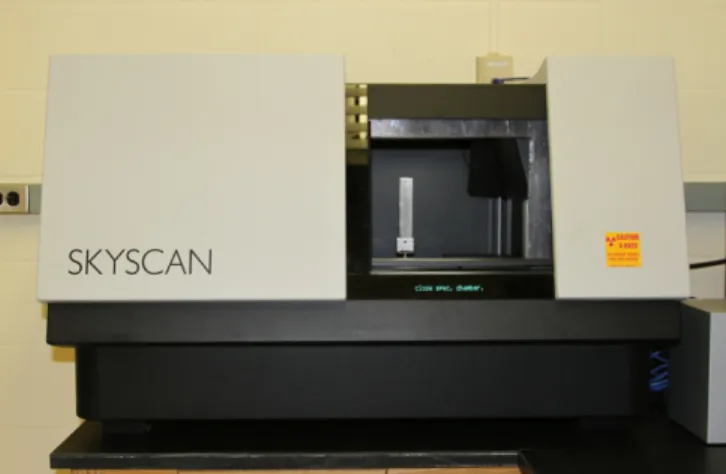
- MicroCT
- Compressive Strength
- Flexure
- Single Fiber Pull-Out
Similar to ASTM C78, the beam is loaded at the third points to isolate bending (zero shear) in the middle third of the beam. Center point displacement of the beam was measured using an external linear variable differential transformer (LVDT) with a sample rate of 10Hz (or one sample every 0.1 seconds). The purpose of the experiment was to determine the effect of PPNC on the interfacial transition zone (ITZ).
Results
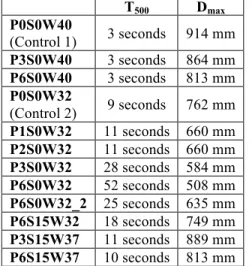
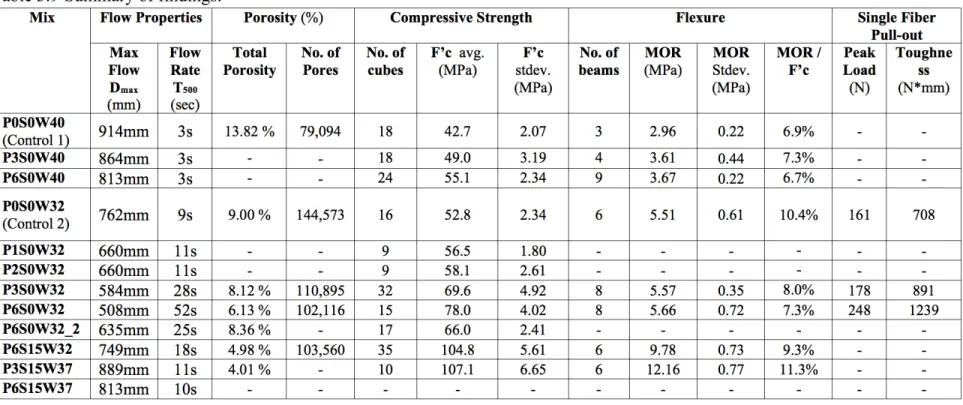
- Flow and Flow Rate Results
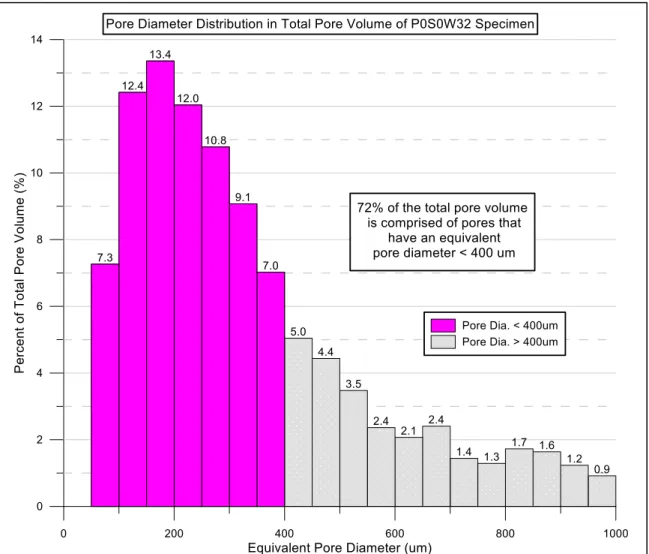
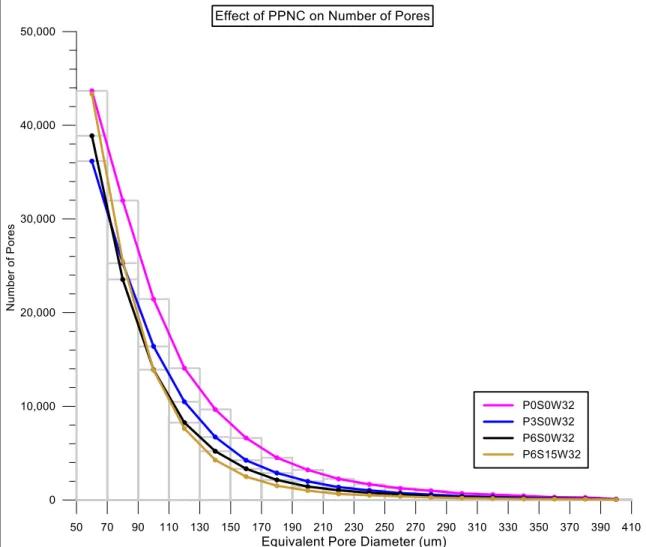
- Micro-CT Results
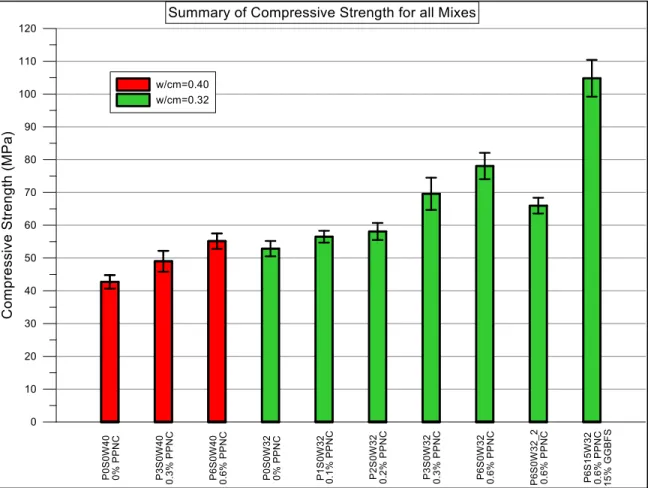
- Compressive Strength Results
- Flexure Results
- Single Fiber Pull-out Results
- Stability Results
For the data shown in Table 3.7 and Figure 3.28, failure occurred in the middle third of the beam, indicating that bending was the failure mode. The data in Figure 3.28 are the engineering stress versus center displacement from the experiments in Table 3.7. These values are plotted and shown in the graph next to the 3D image in Figure 3.31.
Summary & Conclusions
Because of this, the technique for manipulating the shape of the incident pulse helps achieve a constant strain rate in the sample. The initial formation of the ejecta cloud is shown on the shock side at time 67 µs. In this particular test, the projectile remained jammed in the plate at the end of the ballistic test.
CHARACTERIZATION OF A SCHSC
Introduction
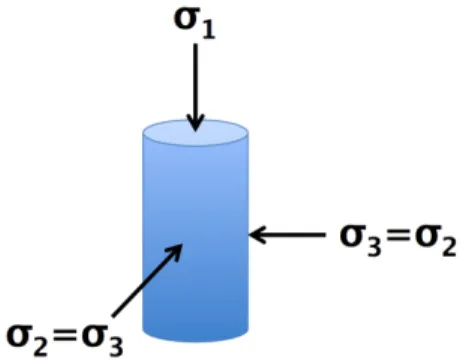
However, characterizing the unconfined compressive strength alone will not adequately describe the constitutive behavior of the material. Thus, it is critical to fully characterize the shear and tensile capabilities of the SCHSC. Essentially, the strength of the material changes as the lateral pressure on the geomaterial increases.
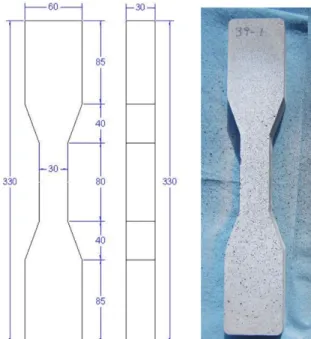
Preparation of Specimens
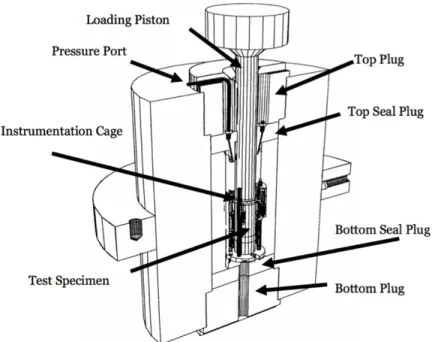
Experimental Approach (Methodology)
- Constitutive Models
- Pressure-Volume Response
- Deviatoric Response
- Direct Tension Response
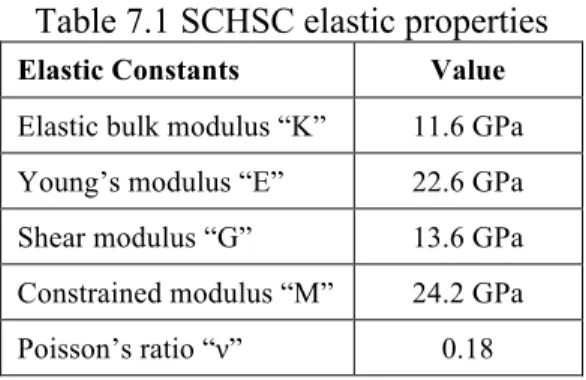
The slope of the linear elastic phase is the modulus of elasticity, usually denoted by "K". The slope of the relief curve is called the bulk relief modulus and is usually denoted as "Kun". For the triaxial experiment, the PSD is related to the second invariant of the deviatoric stress tensor as shown in Equation (5).
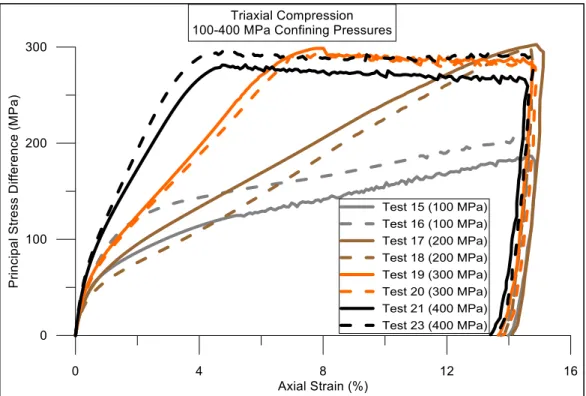
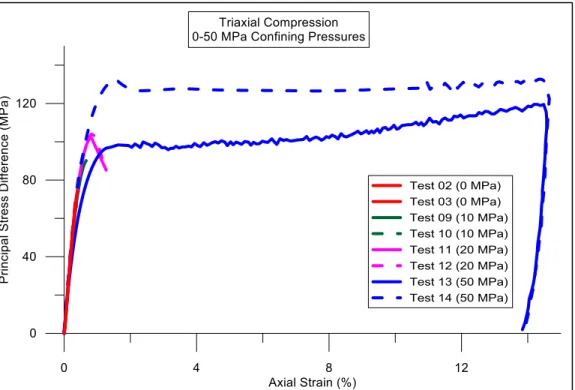
Results
- Pressure-Volume Results
- Deviatoric Results
- Direct Tension Results
The actual deformed and fractured shapes for the four UC tests are shown in Figure 4.19. It becomes apparent when the displacement contours are evaluated along the Y-axis (sample axis) as shown in Figure 4.35. With all the above information, the virtual extensometers were placed at the exact location of the microcracks as shown in Figure 4.38.
Summary and Conclusions
The shape of the reflected strain wave in the incident beam is an indicator of the strain rate history of the specimen. The peak of the strain rate profile roughly corresponds to the peak-to-valley stress drop on the specimen's stress history curve. The projectile is shown initially with the impact side of the target panel at time 0µs.
HIGH-STRAIN RATE RESPONSE OF A SCHSC
Background and Introduction
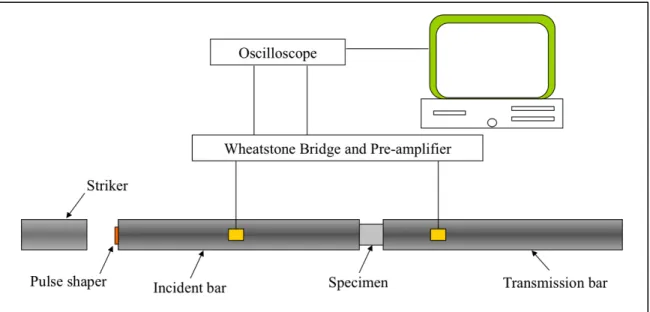
Given the assumption that the rods are dispersion free, equations (22) and (23) will give velocities at any location of the rod. Velocities at the interfaces of the incident rod and sample, and the sample and transmission rod can therefore also be calculated from equations (22) and (23). The profile of the stress wave in the transmission rod is an indication of the stress history of the sample.
Experimental Procedure
The following sections present the investigation to establish the appropriate loading conditions and to identify the correct stress-strain response of the material at multiple strain rates.

Pulse Shaping Technique
- Radial Inertia in Pulse Shapers
- Annulus Pulse Shapers
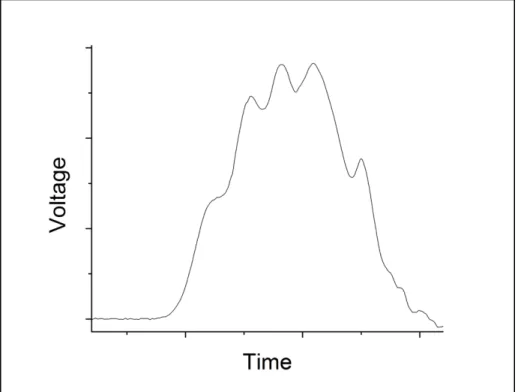
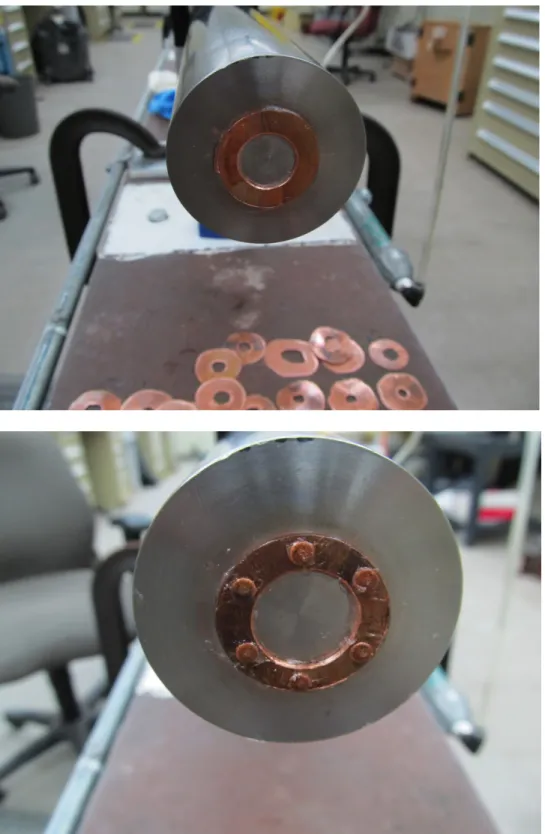
This suggests that unwanted oscillations on the incident pulse may have been introduced by increasing the diameter of the pulse shaper. All these findings point to one possibility - the oscillations of the incident wave are due to the inertia effect in the pulse shaper. Based on this concept, an 11 mm diameter central hole was introduced into a 25 mm diameter solid copper pulse shaper.
Results
- Mechanical Properties of SCHSC at High Rates
- Effect of Specimen Inertia
It should be noted that the duration of constant loading rate before failure is longer for the loading rate of 100s-1. The estimation of load rate acceleration (εx) can be made from a typical sample load rate history profile as shown in Figure 5.14. As seen in Figure 5.14, when the specimen deformation reaches constant strain rate, the strain rate acceleration rapidly reduces to zero.
Summary and Conclusions
At a time point of 200 µs, cratering occurred on the impact side due to spalling and fragmentation, and the shear cone continued to move outward from the exit side of the target panel. At time 5,400 µs, the projectile was visible in additional target fragments behind the exit side of the panel. The damage and failure processes were very similar for all SCHSC panels in this test series.
BALLISTIC EVALUATION OF THE SCHSC
Introduction
The degree of expansion and the resulting surface area are determined by the amount of local inhomogeneities and anisotropies of the target material [149]. The pulverized and fragmented target material is ejected from the face of the target in the opposite direction to that of projectile motion. It is characterized by creating a cylindrical opening through the interior of the target material as the projectile continues to penetrate.
![Figure 6.1 Failure modes in impacted plates [149]](https://thumb-ap.123doks.com/thumbv2/123dok/10742058.0/172.918.332.591.106.456/figure-6-1-failure-modes-impacted-plates-149.webp)
Experimental Approach
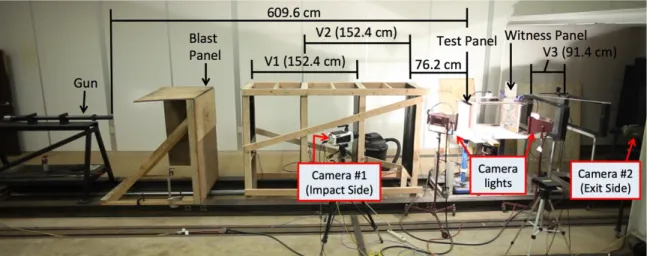
Camera 1 was positioned to capture events in the impact surface of the test panel, while camera 2 captured the sequence of events occurring in the exit surface of the test panel. The resulting video showed the panel's reaction just before the projectile impact until the projectile left the back of the test panel. A third set of velocity screens was placed behind the witness panel to capture the exit velocity of the projectile in the event of a CP.
Results
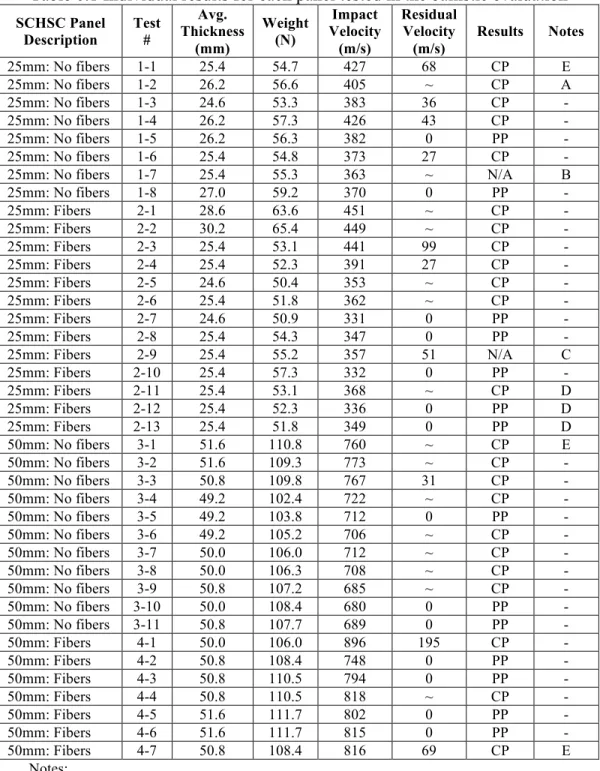
- SCHSC 25mm panel: No fibers (Test# 1-8)
- SCHSC 25mm panel: Fibers (Test #2-6)
- SCHSC 50mm panel: No fibers (Test #3-4)
- SCHSC 50mm panel: Fibers (Test #4-2)
Upon investigation of the impact and exit craters, the craters were intersected with no indication of a tunneling phase. The impact crater size for the thicker panels was significantly larger, while the exit craters were similar. Upon further investigation of the damage panels from Test Series Four, it was clear that a tunneling phase occurred after the formation of the impact crater, but before exit.
Summary and Conclusions
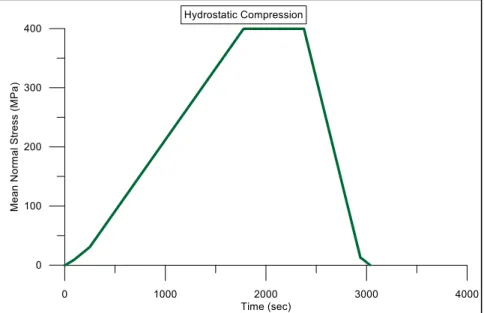
The pressure-volume response of the SCHSC was determined from hydrostatic compression experiments with confining pressures up to 400 MPa. The DIC data was analyzed and successfully used to identify microcracks and evaluate the fiber crack bridging ability of the SCHSC. Data were presented to verify whether dynamic equilibrium was achieved under constant strain rate deformation in the SCHSC test specimens.
SUMMARY AND FUTURE WORK
Summary
PPNC also improved stability in the SCHSC while achieving high flow values and flow rates. Triaxial data were used to construct the failure points and yield surface for the SCHSC. The new technique was used to determine the dynamic stress-strain response of the SCHSC material for two strain rates: 100s-1 and 240s-1.
Future Work
BALLISTIC REPORTS
PHOTOS OF BALLISTIC RESULTS
Test Series 1 - SCHSC 25mm: No fibers
Test Series 2 - SCHSC 25mm: Fibers
Test Series 3 - SCHSC 50mm: No fibers
Test Series 4 - SCHSC 50mm: Fibers
UC RESULTS OF P3S15W37