The Effect of Ownership on Length of Stay and Total Charges for Hospital Inpatient Substance Abuse Treatment
Anna G. Hill Vanderbilt University
April 29th, 2016
Table of Contents
Abstract ... 4
Introduction ... 5
The Substance Use Disorder Epidemic ... 5
Hospital Inpatient Treatment ... 5
Facility Ownership ... 7
A Shift Toward For-Profit Facilities ... 8
Literature Review ... 9
The Effect of Hospital Ownership on Economic Factors and Health Outcomes ... 10
The Effect of SAT Program Ownership on Economic Factors and Health Outcomes . 11 Implications for This Study ... 12
Methods ... 13
Sample Design ... 13
Sample Description ... 15
Hospital Type. ... 15
Sex. ... 16
Race. ... 16
Discharge Status. ... 16
Severity Upon Admission. ... 16
Payer. ... 17
Type of Addiction. ... 17
Age. ... 17
Number of Other Diagnoses. ... 18
Results ... 18
Correlation Matrices ... 18
Regressions ... 20
Length of Stay Regression ... 21
Total Charges Regression ... 22
Interaction Regressions ... 23
Length of Stay Interaction Regression ... 24
Total Charges Interaction Regression ... 25
Discussion ... 26
Higher Total Revenue Charges at For-Profit Hospitals ... 26
Shorter Length of Stay and Higher Charges in For-Profit General Hospitals ... 27
Higher Charges and Length of Stay for Medicare Patients in For-Profit Hospitals ... 28
Other Findings and Future Tests ... 29
Study Limitations ... 31
Conclusion ... 33
References ... 36
Tables ... 41
Figures ... 51
Abstract
The purpose of this study is to determine if hospital ownership has an effect on economic factors and quality outcomes related to inpatient substance abuse treatment. The study examines these factors through analyzing the effect of ownership on length of stay and total revenue charges for inpatient substance abuse treatment provided at hospitals in Florida. Hospital inpatient data were collected from the Florida Agency for Health Care Administration. Two multiple regression models were used to compare the effect of ownership, along with other patient factors, on length of stay and total revenue charges. Overall, three key conclusions were made. First, for-profit hospitals charged substance abuse patients more for inpatient care than non-profit hospitals.
Second, patients treated in for-profit general hospitals stayed fewer days and received higher charges than patients treated in non-profit general hospitals. Lastly, Medicare patients stayed more days and received higher charges than patients with other types of payers in both facilities, but this trend was stronger in for-profit hospitals. This study concludes that, while hospital ownership results in economic differences in care, the measure of quality of care is inconclusive.
It is important that further information is collected to understand the difference in the quality of care provided at non-profit and for-profit hospitals.
The Effect of Ownership on Length of Stay and Total Charges for Hospital Inpatient Substance Abuse Treatment
Introduction
The purpose of this study is to compare the differences in length of stay and total revenue charges among non-profit and for-profit hospital inpatient treatment facilities in the State of Florida. As the number of for-profit facilities in the country continues to increase at a steady rate, the relationship between facility ownership and quality of treatment must be understood. With concern about for-profit entities’ incentives to drive profit margins at the expense of quality care, it is important to determine whether health indicators, such as length of stay, and economic indicators, such as total charges to patients, are different among non-profit and for-profit hospitals.
The Substance Use Disorder Epidemic
In 2014, it was estimated that over 7 million people were dependent on or abusing some form of illicit drug in the United States (SAMHSA 2015a). In the State of Florida alone, over 420,000 individuals have been addicted to or abusing illegal drugs each year since 2009
(SAMHSA, 2015b). As of December 8, 2015, the Substance Abuse and Mental Health Services Agency (SAMHSA) recognized 484 licensed substance abuse treatment facilities in the State of Florida that are able to effectively treat the growing number of patients requiring care
(“Behavioral Health Treatment,”, n.d.a).
Hospital Inpatient Treatment
The National Survey of Substance Abuse Treatment Services (N-SSATS) divides substance abuse treatment into three different levels: outpatient treatment, residential (non- hospital) treatment, and hospital inpatient treatment (SAMHSA, 2014a). Due to data limitations
and the availability of patient discharge data from the State of Florida, this study focuses on hospital inpatient treatment. The N-SSATS survey registered 12,282 hospital inpatient beds designated for substance abuse treatment across the nation in 2013, with almost 30 percent of the facilities reporting 91 to 100 percent capacity, and nearly 20 percent reporting a capacity of over 100 percent (SAMHSA, 2014a). In 2013, five percent of treatment facilities nationwide offered hospital inpatient treatment, with a median of 10 clients in treatment at a given time (SAMHSA, 2014a). In 2013, Florida had a slightly higher percentage of hospital inpatient treatment facilities than the national average, at 5.5 percent of all facilities offering hospital inpatient care and a median of 12 clients per facility (SAMHSA, 2014b).
Although the percentage of substance abuse patients who are treated in inpatient hospital settings is relatively low, the Affordable Care Act of 2010, through its goal of integrated care systems, will “promote a whole-person orientation to care, including the integration of substance abuse and mental health services with general care” (Buck, 2011, p. 1404). It is possible that, with strides to integrate care, more substance abuse services could be offered at hospitals in the future. In addition, hospital care is funded mostly by a mixture of state and local government sources and Medicaid (Levit, et al., 2013). From 1986 to 2005, Levit, et al. (2013) found that the largest growth in funding for behavioral health came from increases in Medicaid and, for
hospital care alone, the portion of funding that came from Medicaid more than doubled during the same time period. With the implementation of the Mental Health Parity and Addiction Equity Act of 2008 and the Affordable Care Act, Medicaid expansion and the funding of behavioral health are expected to increase even further in the coming years (Levit, et al., 2013).
Facility Ownership
Three main types of ownership exist for substance abuse treatment facilities: private for- profit, private non-profit, and public (government). For the purpose of this study, only non-profit and for-profit facilities were analyzed. A key difference between for-profit and non-profit
ownership revolves around the distribution of profits. For-profit centers are owned by
shareholders or investors, and distribute excess profits to shareholders with the intent to increase investors’ wealth (Herrera, Rada, Kuhn-Barrientos, & Barrios, 2014). Non-profits do not have individual shareholders, and all profits are reinvested into the organization rather than distributed to investors (Herrera, et al., 2014). In addition, non-profits are chartered for specific purposes (religion, education, charity, etc.) and are exempt from most taxes (Gray, 1986).
The academic debates regarding the difference in quality of care between non-profit and for-profit health organizations have produced arguments both in favor and against these two types of ownership. A key criticism of for-profit organizations is that, driven by pressure from investors, profits could be pushed at the expense of quality of care, education, research, and access to healthcare for the poor (Gray, 1986). In addition, the commodification of health services and the distribution of such services based on a consumer’s ability to pay displaces costly care onto non-profit and public facilities (Donovan, 1997). On the other hand, for-profit facilities result in greater efficiency in the delivery of services due to their incentives to cut out unnecessary costs (Gray, 1986). For-profit companies might have the ability to hire more
experienced management teams that are better able to efficiently operate an organization and cut costs (Joynt, Orav, & Jha, 2014).
Non-profit facilities, by nature, do not have access to equity capital from investors, which can prevent them from raising adequate capital to implement advancing technology or treatment
options (Gray, 1986). In addition, some experts criticize non-profit organizations because they are not profit-driven and therefore might lack incentives to operate at the highest level of
efficiency (Herrera, et al., 2014). Proponents of non-profit care argue that such facilities provide much better access to care because they are motivated by patient and community need rather than investor desires (Donovan, 1997).
In the State of Florida, non-profit organizations may be organized “not for pecuniary profit” under a variety of different purposes, including charity and education (Florida Not for Profit Corporations Act of 2013, p. 10). In addition, a non-profit organization “may not make distributions to its members, directors, or officers” (Florida Not for Profit Corporations Act of 2013, p. 18). Of the facilities in Florida as of December, 2015, 41% were non-profit facilities, 32% were for-profit facilities, and 27% were public facilities (“Behavioral Health Treatment,”
n.d.a.).
A Shift Toward For-Profit Facilities
Nationally, the past decade has seen the percentage of substance abuse treatment centers that operate as for-profit facilities steadily increase and the percentage of facilities that operate as non-profit centers steadily decrease. The Mental Health Parity and Addiction Equity Act of 2008 and the Affordable Care Act of 2010 exacerbated the shift to for-profit ownership. The MHPEA, which required employer insurance plans to offer the same level of coverage for behavioral healthcare as surgical care, likely resulted in an increase in private insurance spending on behavioral health care (Levit, et al., 2013). As the number of uninsured individuals decreases under the ACA, it is likely that the share of behavioral health financing through grants and contracts from state health authorities will decrease, and many public treatment centers will be forced to close (Levit, et al., 2013). As public hospitals close and the number of insured
individuals increases, the demand for substance abuse services will increase while the public supply of such services decrease.
In 2013, approximately 32% of treatment facilities in the country were for-profit, while 55% were non-profit (SAMHSA, 2014a). If future projections are calculating using a trend line calculated from the data from 2002 to 2012, it can be estimated that by 2020, the percentage of for-profit facilities could reach 36%, while the percentage of non-profit facilities could drop to around 52% (See Figure 1). However, if future projections are calculated using a trend line formulated from data in 2012 and 2013 that could include impacts from the MHPAE 2008 and the ACA 2010, the percentage of private for-profit facilities could reach as high as 41% by 2020 and the percentage of private non-profit facilities as low as 48% by 2020 (See Figure 2).
With shifts in supply and demand in the market for substance abuse services, for-profit hospital companies are reportedly trying to expand their behavioral health presence. Hospital Corporation of America, one of the largest for-profit hospital chains in the country, has made concentrated efforts to gain more market share in the behavioral healthcare field. In an investor presentation at the Avondale Partners Behavioral Healthcare conference in 2013, HCA claimed to have an 18.7% market share in behavioral health, with increasing efforts to expand this share, claiming that “HCA’s Behavioral Health Service Line is well positioned to execute HCA’s overall growth agenda” (Hospital Corporation of America, 2013, p.13). Another large for-profit hospital company, Universal Health Services, made three large behavioral health acquisitions from 2012 to 2014 (Capstone Partners, 2015).
Literature Review
Little academic literature exists that compares economic factors and health outcome measures at for-profit and non-profit inpatient specialty hospitals that treat substance abuse.
Instead, the following section examines studies that assess such measures among for-profit and non-profit hospitals and other types of substance abuse treatment (SAT) programs.
The Effect of Hospital Ownership on Economic Factors and Health Outcomes
A review of the literature finds that for-profit hospitals tend to charge more for services and be more expensive to government programs such as Medicare. The literature is inconclusive in regards to differences in health outcomes and quality of care as a result of hospital ownership, but tends to agree that quality of care is difficult to measure. A systematic review of eight different studies found that private, for-private hospitals in Canada received significantly higher payments from patients than private, non-profit hospitals while also concluding that there was no difference in the quality of care (Devereaux et al., 2004). Devereaux (2004) also argues that higher payments in for-profit hospitals are driven by the need to generate higher profits for investors and suggests that for-profit hospitals could be overcharging their patients for care. In the U.S., for-profit hospitals are more expensive for Medicare than non-profit or government owned hospitals and payments on behalf of patients admitted to for-profit hospitals are significantly higher than payments made for patients in non-profit or government hospitals, holding other factors constant (Sloan, Picone, Taylor, & Chou, 2001). Using mortality and the ability to reintegrate into normal life as measurements of quality of care, Sloan et al. (2001) found that hospital ownership had no effect on quality of care, while also acknowledging that quality of care in a hospital setting is difficult to measure and discrepancies between minor quality outcome measures could still exist. Although the conversion of hospitals from non-profit to for-profit status has been associated with improvements in financial performance, a change in hospital ownership does not result in higher mortality rates or reduced access to care for low- income individuals (Joynt, et al., 2014). A study by Devereaux et al, (2002) directly contradicts
these results and found that private, for-profit hospitals have higher mortality rates and a higher risk of death as a result of for-profit hospitals cutting patient care to reduce costs and boost profit.
The Effect of SAT Program Ownership on Economic Factors and Health Outcomes Few research studies have been conducted that examine differences in patient charges between for-profit and non-profit SAT programs. However, for-profit ownership has been consistently linked to worse health outcomes and lower quality of care. From 1980 to the early 2000’s, for-profit inpatient psychiatric programs performed worse than their non-profit
counterparts in the majority (70%) of facilities that were analyzed (Rosenau & Linder, 2003).
Ancillary and transitional services, which are linked to better long-term health outcomes for substance abuse, are more prevalent in outpatient non-profit facilities than for-profit facilities (McBride, Chriqui, Terry-McElrath, & Mulatu, 2012). In fact, McBride, et al. (2012) concludes that non-profit facilities provide better quality care than for-profits because they are statistically more likely to offer each of the eight ancillary and transitional services analyzed in the study.
Non-profit outpatient opioid treatment centers are more likely to offer comprehensive services, such as testing for HIV, STIs, and other communicable diseases in addition to psychiatric
screening and assessment (Bachhuber, Southern & Cunningham, 2014). Bachhuber, et al. (2014), argue that for-profit outpatient opioid centers provide worse care through their failure to provide comprehensive services that are strongly associated with improved treatment outcomes and that are especially important for outpatient treatment programs in which patients are not receiving care from another source.
Implications for This Study
It is hypothesized that the results of this study will suggest that for-profit hospitals charge their patients more for inpatient substance abuse treatment than non-profit hospitals. The current literature on hospital ownership argues that higher payments and charges are common among for-profit hospitals in an effort to boost profits. It is also hypothesized that the quality of care for patients in for-profit hospitals treating substance abuse will not be statistically different than the quality of care provided in non-profit hospitals. The academic literature argues that the quality of care in a hospital setting is hard to measure. In this study, length of stay is used to measure quality of care. There are many patient demographic factors that can affect the length of stay in hospital settings that are unrelated to the quality of care provided, including age, race, ethnicity, and gender (Delphin-Rittmon, et al., 2012; Choi, Adams, Morse, & Macmaster, 2015). Although the length of stay in substance abuse treatment varies based on the type of drug and the severity of addiction, longer stays in treatment have been associated with better treatment outcomes (Conners, Grant, Crone, & Whiteside-Mansell, 2006). Although the literature suggests that for- profit substance abuse treatment centers consistently offer worse care than their non-profit counterparts, the effect of ownership on the quality of care at hospitals is still debated. Because the facilities in this study operate primarily as general and psychiatric hospitals that offer substance abuse treatment, it is hypothesized that the results will mimic the studies done on hospitals rather that SAT programs. It is predicted that this study will provide evidence that for- profit hospitals charge more for services while producing inconclusive results regarding
difference in quality of care.
Methods
This study uses hospital inpatient discharge data from the Florida Agency for Health Care Administration to examine the effect of hospital ownership status on two dependent variables:
length of stay and total revenue charges. Initially, correlation matrices were created to determine the relationship between severity and length of stay and severity and total charges for patients treated in non-profit hospitals and for-profit hospitals. Upon examination of the correlation matrices, more tests were necessary to understand the impact of other variables on the makeup of the samples and the dependent variables. Two multiple regression models were used to
understand the effect of hospital ownership on length of stay and total charges for patients suffering from opioid abuse or dependence who were treated in inpatient hospital settings while accounting for a variety of other variables. Although the main focus of the study is to compare the relationship between the two dependent variables and hospital ownership, other variables including hospital type, sex, race, discharge status, severity level upon admission, payer type, type of addiction, age, and number of other diagnoses are also examined.
Sample Design
The entire data set contained inpatient hospital discharge data from four consecutive quarters: 3Q2014, 4Q2014, 1Q2015, and 2Q2015. These data were from 296 hospitals and 2,793,623 patients. Twenty hospitals reported admitting at least one patient for substance abuse or dependence per quarter for the time period specified. Of these hospitals, 7 operated as non- profits and 13 operated as for-profits. These 20 hospitals reported discharge data on 167,641 patients.
The data pool was narrowed by including only patients with a principal diagnosis of opioid dependence or abuse. Principal diagnosis was the determinant of patients included in the
study, rather than admitting diagnosis or other diagnoses. Admitting diagnosis, which is the diagnosis that the patient initially presents with upon admission, is not always an accurate representation of diagnosis because it is usually assessed quickly. Patients with only “other diagnoses” of opioid abuse or dependence were not included because the principal diagnosis of these patients could include a variety of different medical issues that would skew the length of stay or total charges beyond what would be consider practical for treating opioid abuse or dependence. Principal diagnosis was reported using ICD-9-CM codes. Opioid abuse or dependence was represented by ICD-9-CM codes 304.00, 304.01, 304.70, 304.71, 304.72, 305.50, and 305.51 (see Table 1)(CMS, 2014). Diagnosis was limited to one type of drug to ensure that variations in length of stay were due to other factors and not due to differences in treatment lengths for different drugs. In addition, the most prevalent diagnosis for patients included in the data was some type of opioid abuse or dependence.
The data were narrowed again to control for the resources used by the hospital to administer procedures. Diagnostic Related Groups (DRGs), created under the Acute Care Hospital Inpatient Prospective Payment System, aim to group patients who have similar conditions and receive similar procedures during their stay. Medicaid Severity (MS) DRGs account for severity of illness and attempt to group together diagnoses and procedures that tend to consume similar amounts of hospital resources (Medicare Learning Network, 2013).
Therefore, MS-DRG was used to compare patients that received relatively similar amounts of care. Only patients admitted to a facility with a Medicaid Severity – Diagnostic Related Group of 897 – “alcohol/drug abuse or dependence w/o rehabilitation therapy w/o major complication or comorbidity” or 894 – “alcohol/drug abuse or dependence, left against medical advice” were included in the sample (CMS, 2008).
Sample Description
The final sample contained data from 2,060 patients in 7 non-profit and 12 for-profit hospitals. Overall, the sample contained 438 non-profit patients and 1,622 for-profit patients. The non-profit sample patients, on average, stayed fewer days and were charged less than their for- profit counterparts. The average length of stay for a non-profit patient was 4.2 days and the average amount of charges was around $7,000. The average length of stay for a for-profit patient was 6.8 days and the average charge was $12,500. A detailed description of the sample can be found in Table 2.
Hospital Type. Two types of hospitals were represented in the study: general hospitals and specialized hospitals. General hospitals have a variety of different departments and treat a range of different medical conditions. All of the general hospitals included in the sample had a behavioral healthcare ward devoted to issues such as mental health and substance abuse.
Specialized hospitals are devoted to a particular issue or disease. The specialized hospitals in this sample were all behavioral health hospitals that only admit patients with mental health and substance abuse issues. A description of the hospitals and the proportion of sample patients that was treated in each can be found in Table 3. Six general hospitals treated 30 percent of the patients in the sample and 13 specialized hospitals treated 70 percent. Overall, a greater proportion of non-profit patients were treated in general hospitals (167/438 = 38 percent) than for-profit patients (441/1622 = 27 percent). Differences in length of stay and total revenue charges by ownership status and hospital type can be found in Table 2. While non-profit patients stayed a similar amount of time in both general and specialized hospitals (4.13 and 4.21 days, respectively), non-profit patients in general hospitals were charged considerably more ($10,695) than in specialized hospitals ($4,784). For-profit patients stayed longer in specialized hospitals
(8.02 days) than in general hospitals (3.47 days), but for-profit patients in general hospitals were charged more for their services ($16,073) than in specialized hospitals ($11,112).
Sex. Non-profit facilities treated a similar proportion of females and males as for-profit facilities. For both for-profit and non-profit patients, men stayed fewer days and were charged less.
Race. Race was divided into four groups: non-Hispanic White, Hispanic, non-Hispanic Black, and non-Hispanic other. Both non-profit and for-profit facilities treated a majority of non- Hispanic White patients. Non-profit facilities treated a greater proportion of Hispanic, non- Hispanic Black, and non-Hispanic other patients. In non-profit facilities, non-Hispanic other patients stayed a shorter amount of time and were charged less than the other groups of patients.
In for-profit facilities, non-Hispanic Black patients stayed longer and were charged more than every other group of patients. Non-Hispanic White patients in for-profit facilities stayed longer than Hispanic patients and non-Hispanic other patients, while non-Hispanic other patients stayed the shortest amount of time in for-profit facilities.
Discharge Status. A greater proportion of patients were discharged against medical advice in for-profit facilities (5.0%) than non-profit facilities (3.4%). On average, patients who left treatment against medical advice stayed fewer days and were charged more than patients who were discharged through other means in both types of hospitals.
Severity Upon Admission. This measure of severity had three different levels. The highest level upon admission, categorized as “Emergency” (level 3), represented a patient that
“required immediate medical intervention as a result of severe, life threatening or potentially disabling conditions”; “Urgent” (level 2) was defined as a patient that “required attention for the care and treatment of a physical or mental disorder”; “Elective” (level 1) was defined as a patient
with a condition that “permitted adequate time to schedule the services” (Florida Agency for Health Care Administration, 2010). Patients with the highest level of severity (“emergency”) stayed a fewer number of days than the “urgent” patients for both types of hospitals, although this trend was exacerbated in for-profit facilities. In for-profit facilities, patients with the
“elective” level of severity (level 1) were charged more than patients with an “urgent” level of severity, but not in non-profits.
Payer. Payer type was divided into two groups: Medicare and Other. A large majority of the Medicare patients in the sample were under the age of 65 (91.9%). A more detailed
breakdown of the Medicare patients in the study can be found in Table 4. On average, Medicare patients stayed longer and were charged more in both types of hospitals, although this effect was greater in for-profit facilities than in non-profit facilities. In addition, for-profit hospitals treated a larger proportion of Medicare patients (25.6%) compared to non-profit hospitals (9.1%).
Type of Addiction. The patient’s type of addiction was used as another measure of severity. There were two types of substance use that the study examined: dependence and abuse.
Dependence typically represents a more serious and severe drug use disorder with a longer history of substance abuse. Both types of ownership treated a majority of patients suffering from dependence, rather than abuse, although for-profit centers treated a higher proportion of
dependent users (97.6%) than non-profit centers (91.8%). Patients suffering from drug abuse stayed a shorter period of time in non-profit facilities than average and stayed a longer period of time in for-profit facilities.
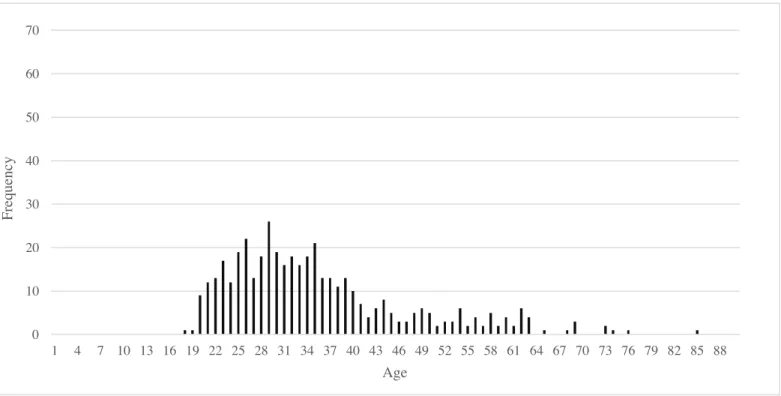
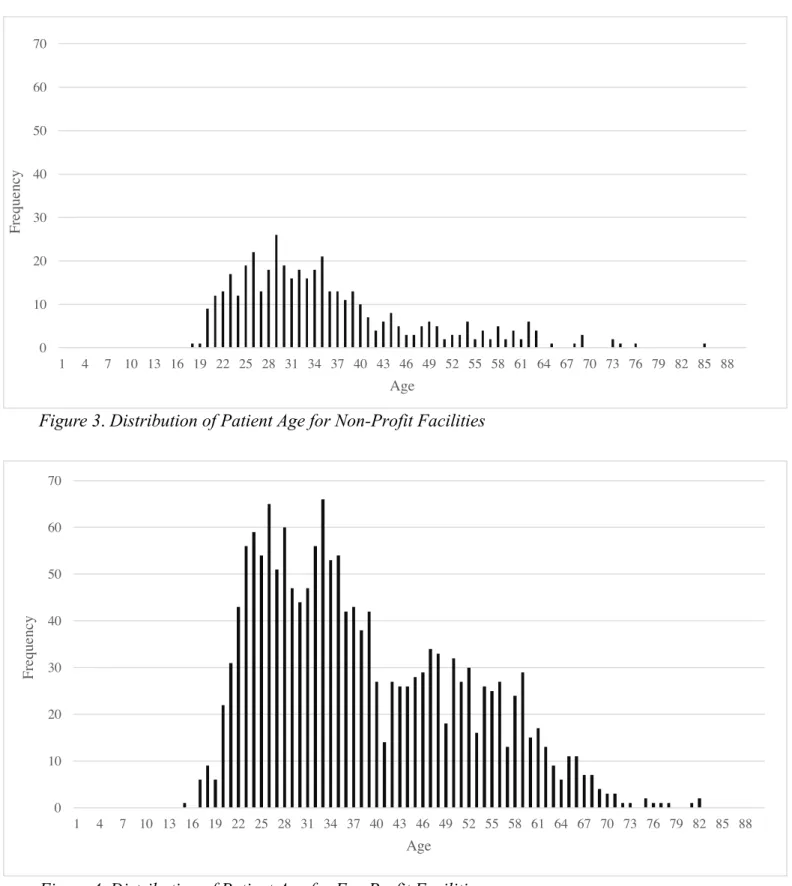
Age. For-profit facilities treated patients who were about 2.7 years older on average (38.2 years) than non-profit facilities (35.5 years). A distribution of patient age for each facility type is shown in Figures 3 and 4.
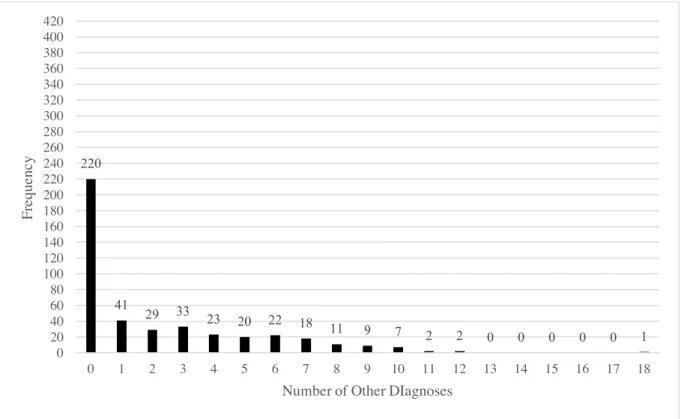
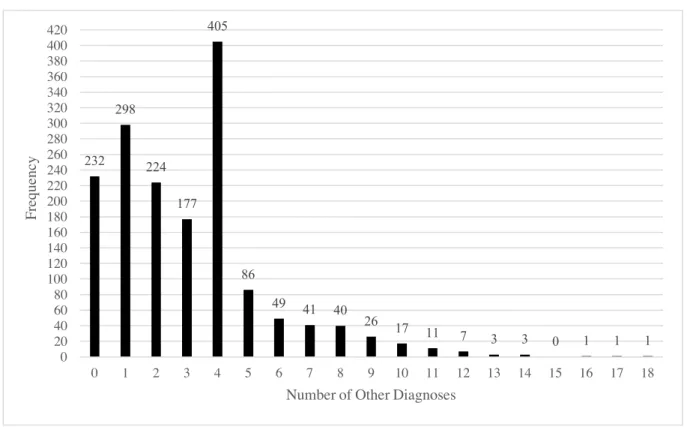
Number of Other Diagnoses. On average, for-profit patients with a principal diagnosis of opioid abuse or dependence had a greater number of “other diagnoses” (2.2) than non-profit patients (3.0). For the distribution of the number of other diagnoses for non-profit and for-profit facilities, see Figures 5 and 6.
Results
Correlation Matrices
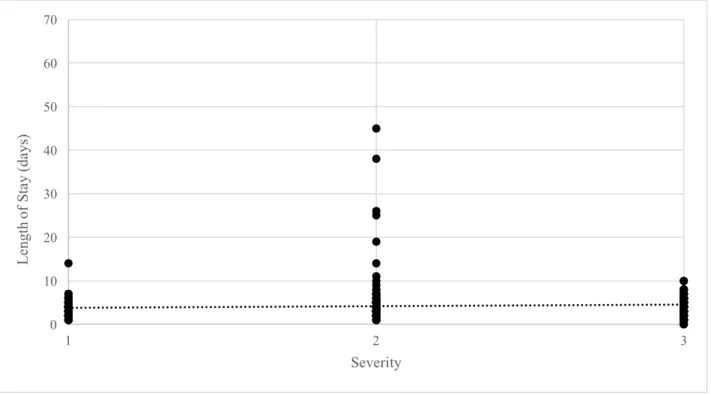
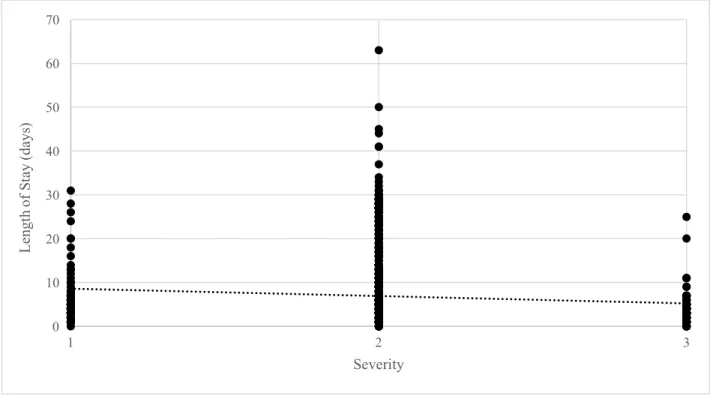
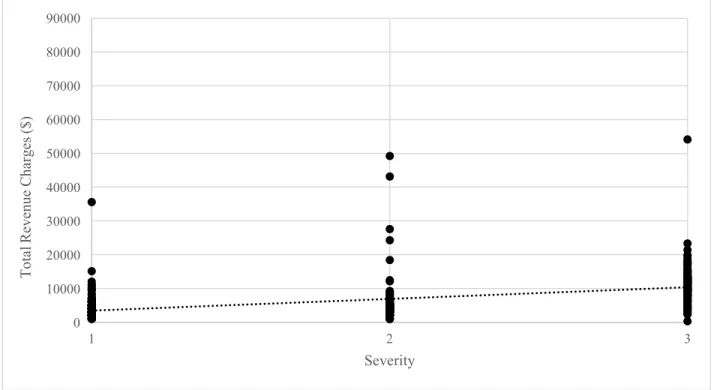
Tables 5 and 6 show the correlation matrices for non-profit and for-profit hospitals, while Figures 7, 8, 9, and 10 depict graphical representations of the correlation between severity, length of stay, and total charges for both non-profit and for-profit facilities. For both the for- profit and the non-profit sample, general hospitals were strongly correlated with severity
“emergency” (level 3). For non-profits, this trend was stronger, with a correlation coefficient was 0.94, compared to for-profits general hospitals with a correlation coefficient of 0.61. In addition, in both the non-profit and the for-profit sample, general hospitals were negatively correlated (- 0.46, -0.54, respectively) with severity “urgent” (level 2) and slightly positively correlated (0.14, 0.23) with patients being discharged AMA.
In the non-profit facility sample, there was a stronger correlation (0.29) between Hispanic patients and severity “emergency” (level 3) than other groups of patients. There was also a stronger correlation (0.24) between Hispanic patients and discharging AMA than other groups of patients in the non-profit sample. In the for-profit sample, there was a slightly stronger negative correlation (-.20) between Hispanic patients and severity “urgent” (level 2) when compared to other groups of patients in the for-profit sample. The highest level of severity was slightly positively correlated (0.15) with patients discharging AMA. There were no significant correlations between substance abuse and any other factors for non-profit facilities.
In the for-profit sample, severity “emergency” (level 3) was positively correlated (0.22) with patients discharging AMA, while severity “urgent (level 2) was negatively correlated (- 0.27) with patients discharging AMA. Substance abuse was not significantly correlated with any other factor.
Medicare patients were positively correlated with higher charges and length of stay in both the non-profit and the for-profit samples, although the correlation was stronger in the for- profit sample. For total charges and length of stay, the non-profit sample saw correlation coefficients of 0.23 and 0.28, respectively. The for-profit sample saw a Medicare correlation coefficient of 0.47 and 0.55, respectively. For the non-profit sample, Medicare payment was slightly correlated (0.15) with severity “urgent” (level 2). In the for-profit sample, Medicare was negatively correlated (-0.19) with general hospitals.
The non-profit sample saw several strong correlations associated with the number of other diagnoses that were not present in the for-profit sample. The number of other diagnoses was correlated with total charges (0.51), general hospitals (0.75), Hispanic patients (0.23), non- Hispanic Black patients (0.18), severity “emergency” (level 3) (0.75), and patients that discharge AMA (0.19). The for-profit sample had similar correlations for the number of other diagnoses, but these correlations were typically weaker. The number of other diagnoses was correlated with total charges (0.29), general hospitals (0.42), severity “emergency” (level 3) (0.25), and
Medicare (0.10).
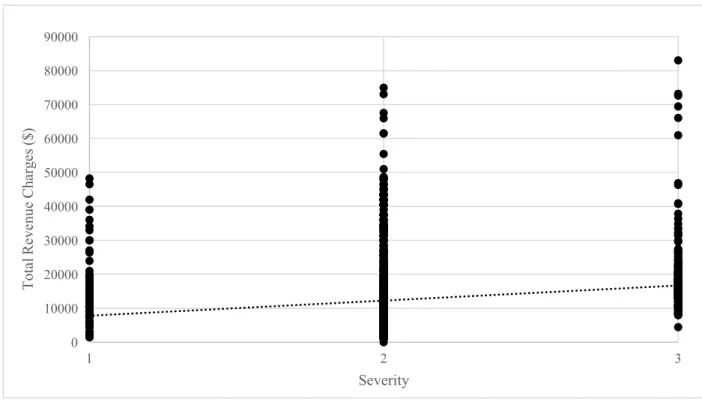
For the graphical representations of correlations in Figures 7 and 8, both non-profit and for-profit hospitals saw no correlation between severity and length of stay. Non-profit hospitals had a slight positive correlation coefficient of 0.087 for these two variables, while for-profit hospitals had a slightly negative correlation of -0.10. In Figures 9 and 10, the two types of
facilities did differ in the relationship between severity and total charges. Non-profit hospitals saw a stronger positive correlation between severity and total charges, with a correlation
coefficient of .485, while for-profit hospitals had a correlation of 0.17 between these two factors.
Regressions
Tables 7 and 8 show the regression results for the dependent variables length of stay and total charges, while Tables 9 and 10 show the regression models after adding the interaction variables. For the regressions, dummy variables were used to represent facility ownership, hospital type, sex, race, discharge status, severity upon admission, payer, and type of addiction.
Patient age and the number of other diagnoses were also included as independent variables. The equation for the least squared regression line for length of stay can be defined as:
!" = $ +&'()(+&'*)*+&'+)+ +&',),+ '-)- + '.).+ '/)/+ '0)0+&'1)1+&'(2)(2 +&'(()((+&'(*)(*+ '(+)(+
where !"&is the length of stay in days. )( represents the ownership status (0 for non-profit, 1 for for-profit,), )* represents the hospital type (0 for specialized, 1 for general), )+ represents the sex of the patient (0 for male, 1 for female), ),, )-&, and ). represent the race of the patient (1 for Hispanic for ),, 1 for non-Hispanic Black for )-, and 1 for non-Hispanic other for ). ), )/ represents the discharge status (0 for “other”, 1 for AMA), )0 represents Severity3 of the patient (0 for severity “elective” or “urgent”, 1 for “emergency”), )1 represents Severity2 (0 for
“emergency” or “elective”, 1 for “urgent”), )(2 represents the payer type (0 for “other”, 1 for Medicare), )(( represents the type of addiction (0 for dependence, 1 for abuse). Variables )(*&and )(+ are both continuous variables, and represent age of the patient and number of other diagnoses of the patient, respectively. The equation for the least squared regression line for total
charges is the same as the equation stated above, with !" representing the total revenue charges in dollars.
Three different regression were done for length of stay and total revenue charges to account for the two different measures of severity (severity level upon admission and type of addiction). The first regression included both severity level and type of addiction as measures of the severity of the addiction. The second regression included only the severity level as a measure of severity. The third regression included only the type of addiction as a measure of severity.
Length of Stay Regression
The least squared regression line equation for length of stay regression 1, including both measures of severity, was:
Yd = 3.10 + 0.68*For-Profit – 2.89*General Hospital + 0.05*Female – 0.23*Hispanic + 2.44*Non-Hispanic Black – 0.46*Non-Hispanic Other – 2.13*Discharged AMA + 1.22*Severity3 “Emergency” + 0.98*Severity2 “Urgent” + 7.95*Medicare + 0.19*Abuse +
0.01*Age + 0.19*No. of Other Diagnoses
Bolded variables represent those that are significant at the 95 percent confidence level. The least squared regression equations for regressions 2 and 3 vary slightly from the equation above.
See Table 7 for exact variations.
The patient represented in the intercept (a male, non-Hispanic White, not discharged AMA, “elective” severity, non-Medicare, drug dependent patient treated in a non-profit specialized hospital) stayed a total of 3.10 days, with an additional 0.01 days added for each additional year in age and 0.19 days added for each additional diagnosis. Controlling for other factors, there was no statistically significant relationship between ownership status and length of stay and a patient in a for-profit hospital was predicted to stay just under 0.7 days longer than the
same patient in a non-profit hospital (this coefficient is significant at the 90 percent confidence level). Non-Hispanic black patients stayed significantly longer than other groups of patients, staying almost 2.5 days longer than average. Patients choosing to discharge against medical advice stayed, on average, about one day, which was 2.13 days shorter than the average stay of 3.10 days. Patients with a level of severity classified as “emergency” (level 3) stayed
significantly more days than “elective” (level 1) patients, staying 1.22 days more when controlling for other factors, while patients with severity “urgent” (level 2) stayed also significantly longer than “elective” (level 1) patients, staying an additional 0.98 days when controlling for other factors. Patients who were covered by Medicare stayed significantly longer than patients covered by other payer types. Controlling for other factors, a Medicare patient stayed around 11 days; almost 8 days longer than the average patient. Finally, the number of other diagnoses resulted in a significantly longer stay, with each additional diagnosis adding almost .20 days to the average length of stay.
Total Charges Regression
The least squared regression line equation for the total charges regression 1, including both measures of severity, was:
Yd = 1,702 + 4,700*For-Profit + 3,094*General Hospital + 566*Female – 1,660*Hispanic + 2,005*Non-Hispanic Black – 533*Non-Hispanic Other – 2,272*Discharged AMA + 3,807*Severity3 “Emergency” – 965*Severity2 “Urgent” + 12,137*Medicare – 447*Abuse + 22*Age + 494*No. of Other Diagnoses
Bolded variables represent those that are significant at the 95 percent confidence level. The least squared regression equations for regressions 2 and 3 vary slightly from the equation above.
See Table 8 for exact variations.
The patient represented in the intercept was charged an average of $1,702 for treatment services, with an additional $22 of charges per additional year in age and an additional $494 in charges for each additional diagnosis. The results of the regression show that for-profit hospitals charged patients significantly more than non-profit hospitals. The same patient treated in both a for-profit and a non-profit hospital was charged an average of $4,700 more for services in the for-profit hospital. Hispanic patients were charged significantly less than their non-Hispanic counterparts, resulting in charges that were $1,660 less than the average patient. Patients who were discharged against medical advice were charged significantly less than patients discharged through other means, although this was an expected result due to the shorter length of stay typical of these types of patients. Patients with the highest level of severity were charged
significantly more than patients with other levels of severity, resulting in charges that were over
$3,800 more than the average patient. This result was surprising when compared to the length of stay regression model, which found patients with the highest level of severity stayed fewer days than patients with other levels of severity. Medicare patients were charged significantly more than patients with other methods of payment. Medicare patients were charged, on average, over
$14,000, which was about $12,000 more than the charges for an average patient. This result was to be expected in conjunction with the length of stay regression, which concluded that Medicare patients had longer lengths of stay than patients with other types of payers. Finally, each
additional diagnosis resulted in a significant increase in charges, with each diagnosis adding almost $500 to the total revenue charges.
Interaction Regressions
Upon analyzing results from the initial regressions, further regression tests were conducted to understand the effect of for-profit ownership on significant variables. Due to
limitations with EXCEL, only two interaction variables could be added to each regression at one time. Variables )(, and )(-& represent the interaction variables. The new equation was written as:
!" = $ +&'()(+&'*)*+&'+)+ +&',),+&'-)- +&'.).+&'/)/+&'0)0+ '1)1+ '(2)(2 + '(()((+ '(*)(*+ '(+)(++ '(,)(,+&'(-)(-
with Yd representing either length of stay in days or total revenue charges in dollars. For interaction regression 1, )(, and )(- represent the interaction between ownership and hospital type and the interaction between ownership and Hispanic patients. For interaction regression 2, )(, and )(- represent the interactions between ownership and non-Hispanic Black patients and ownership and discharging against medical advice. For interaction regression 3, )(, and )(- represent the interactions between ownership and severity “emergency”( level 3) and severity
“urgent” (level 2). Finally, interaction regression 4 only has variable )(,, which represents the interaction between ownership and Medicare payment. Results of the interaction regressions on length of stay and total charges can be seen in Tables 9 and 10.
Length of Stay Interaction Regression
Table 9 includes the intercept and coefficient values for the length of stay interaction regressions. The coefficient and T statistic for the three interaction variables represent the direction and significance of the interaction between two variables. A statistically significant interaction variable implies, in this case, that the for-profit ownership status of a hospital had a unique effect on another variable that was not present in a non-profit hospital. The interaction between ownership and hospital type produced a significantly negative coefficient. The combination of a for-profit, general hospital results in a length of stay that is 0.58 days shorter than the length of stay for the same patient treatment in a non-profit general hospital. The interaction between ownership and Hispanic patients and ownership and non-Hispanic Black
patients did not have a significant impact on the length of stay. The interaction between
“emergency” level severity (level 3) and facility ownership was significantly negative. On average, a patient with the highest level of severity stayed 0.81 days less in a for-profit hospital than the same patient stayed in a non-profit hospital. The interaction between ownership and severity “urgent” (level 2) was not significant. The interaction between Medicare and facility ownership was significantly positive. The for-profit ownership of a hospital had a unique effect on Medicare patients, resulting in a stay that was 5.52 days longer than the average stay of a similar Medicare patient treated in a non-profit hospital, controlling for other factors.
Total Charges Interaction Regression
Table 10 includes the intercept and coefficient values for the total revenue charges interaction regressions. The interactive relationship between for-profit ownership and general hospitals resulted in a significantly positive relationship. A patient treated in a for-profit general hospital is charged, on average, $8,192 more than the patient would have been charged in a non- profit general hospital. There was no significant interaction between ownership status and Hispanic patients on the total revenue charges. For non-Hispanic Black patients, being treated in a for-profit hospital had a significant impact on the total revenue charges received. A non-
Hispanic Black patient, treated in a for-profit hospital, received charges that were $9,870 higher, on average, than the charges that would have been received if the patient had been treated in a non-profit hospital. The interaction between for-profit hospitals and patients that were discharged AMA did not produce a significant result. The interaction between severity “emergency” (level 3) and for-profit centers was significantly positive. Not only did for-profit ownership have significant negative effect on the length of stay of patients with the highest level of severity (see Table 9), but it had a significant positive effect on the total revenue charges for these patients,
resulting in charges that were $8,084 more than a similar patient with “emergency” severity (level 3) would have received at a non-profit hospital. The interaction between severity “urgent”
(level 2) and hospital ownership did not have a significant result. Finally, the interaction
coefficient between for-profit ownership and Medicare payment was significantly positive. The interaction between for-profit ownership and Medicare patients resulted in charges that were
$12,161 more than would have occurred for a Medicare patient treated in a non-profit hospital.
Discussion
There were three key findings that can be drawn from the results of the regressions. First, controlling for other factors, for-profit hospitals charged substance abuse patients more than non- profit centers. Second, patients admitted to general hospitals, especially with the highest level of severity, stayed fewer days and were charged more in for-profit hospitals than patients admitted to non-profit hospitals. Lastly, Medicare patients received higher charges and stayed longer in both for-profit and non-profit centers, but the trend was more pronounced in for-profit hospitals, as Medicare patients stayed significantly longer and were charged significantly more.
Higher Total Revenue Charges at For-Profit Hospitals
For-profit centers charged patients a significantly higher amount than non-profit hospitals. The difference between length of stay among these two types of ownership was not statistically significant. Therefore, the increase in charges at a for-profit hospital can not be attributed to a longer length of stay.
The finding that for-profit hospitals charged substance abuse patients more than non- profit hospitals is consistent with the original hypothesis of the study. The review of the literature concluded that for-profit hospitals often charge more for services than their non-profit
counterparts. There are several possible reasons that for-profit hospitals charge more for services.
The drive to increase profits and pressure from investors could lead to inflated charges for patients. Another possibility is that for-profit hospitals are providing higher quality care and therefore charging patients accurately for the higher quality care that is being provided, although there is no evidence in this study that supports the argument that the care provided at for-profit hospitals is of higher quality.
Shorter Length of Stay and Higher Charges in For-Profit General Hospitals
Patients treated in for-profit general hospitals stayed significantly fewer days in for-profit hospitals than in non-profit hospitals and were charged significantly more. From the correlation matrices, it is clear that severity “emergency” (level 3), is positively correlated with general hospitals. General hospitals are likely treating a large proportion of patients admitted with the highest level of severity. The interaction between severity “emergency” (level 3) and hospital ownership was found to also be significant, with severity “emergency” (level 3) patients staying fewer days and receiving higher charges in for-profit hospitals. Therefore, it is likely that a key driver for shorter stays and higher charges in for-profit general hospitals is the large presence of severity “emergency” (level 3) patients.
Contradictory conclusions can be drawn from these results depending on the way in which they are interpreted. The first interpretation suggests that for-profit general hospitals are actually providing higher quality care because patients who are admitted with the highest level of severity are likely patients suffering from acute drug overdose. Therefore, a shorter stay can translate to more efficient care, and higher revenue charges represent the value of higher quality care. Factors that increase the length of stay for patients with acute drug poisoning include complications that are developed within the first or second day upon admission (Jayakrishnan, et al., 2012). A shorter average stay would suggest that fewer complications are arising among
patients, which could be a result of higher quality care. Provided that shorter lengths of stay in for-profit general hospitals are actually a result of fewer complications, it is important to note that the presence of fewer complications could be the result of a healthier patient base to begin with. It is possible that the patient base of for-profit general hospitals is made up of fewer chronic drug users, making it less likely that for-profit patients would develop complications.
However, this type of information was not available in the data set and should be examined further.
Another possible interpretation that can be drawn from these results would argue that patients treated in for-profit general hospitals are discharged more quickly to cut down on hospital costs. Patients presenting with life-threatening conditions can be expensive to hospitals, as they require more constant care and present a higher liability. Therefore, a shorter average length of stay for the most severe patients could represent a tendency for for-profit hospitals to discharge extreme patients as quickly as possible in order to save on costs and boost profit margins. In addition, higher total revenue charges at for-profit general hospitals could be an indication that these for-profit hospitals are charging higher rates to cover costs and increase profit.
Higher Charges and Length of Stay for Medicare Patients in For-Profit Hospitals Patients covered by Medicare had a longer length of stay and were charged more for services than patients covered by other types of insurance or paying out of pocket for both for- profit and non-profit hospitals. However, this trend was more prominent in for-profit hospitals, as the interaction between Medicare patients and for-profit ownership was statistically significant at the 99 percent confidence level.
A majority of the Medicare patients in this study are under the age of 65. It is possible that some of these are dual-eligible patients, meaning that they qualify for both Medicare and Medicaid. Young, dual-eligible patients (patients under 65) with mental disorders, especially those suffering from substance use disorder, have been shown to be more expensive to these programs, with the bulk of the expenses being paid for by Medicare (Frank & Epstein, 2014). In fact, Frank and Epstein (2014) find that a dual-eligible patient with a mental disorder results in expenses to Medicare that are almost double that of a dual-eligible patient without a mental disorder. Large discrepancies in spending usually result from conflicts between the two
programs’ regulations that can provide incentives for health care companies to exploit the system for higher payments (Frank & Epstein, 2014). The for-profit hospitals in this study treated a much higher percentage of Medicare patients than the non-profit hospitals (26% compared to 9%). It is possible that for-profit hospitals are realizing an opportunity for higher profits through the treatment of these dual-eligible patients. However, the proportion of patients in the study that are dual-eligible for Medicare and Medicaid is not provided and needs to be examined further to determine if the higher charges and increased length of stay is a result of dual-eligible patients.
In addition, further research into regulation conflicts that could be creating incentives to keep Medicare patients longer and charge these patients more needs to be conducted.
Other Findings and Future Tests
There were two other interesting findings from the study that need to be further
examined. First, Hispanic patients were being charged significantly less than their non-Hispanic counterparts when controlling for other factors. There was no significant interaction between Hispanic patients and for-profit hospitals, so Hispanic patients are being charged less in both for- profit and non-profit settings. Other than Native Hawaiian and Pacific Islanders, Hispanics have
the highest rate of being uninsured in Florida (U.S. Census Bureau, 2015a). Further tests need to be conducted to understand if there is an interaction between a lack of insurance and lower revenue charges. Interestingly, for-profit hospitals in the sample treated a higher proportion of Hispanic patients than non-profit hospitals. Typically, for-profit centers are criticized for displacing the care of uninsured patients to non-profit or government facilities. However, evidence in this sample suggests the opposite. Because Hispanics are more likely to be uninsured, and for-profit hospitals treated a higher proportion of these patients in this sample, there is reason to believe that for-profit hospitals are actually accepting more of the burden of providing care to the uninsured than non-profit hospitals. However, further details about the Hispanic patients in the sample, such as insurance status, need to be obtained and analyzed to make any conclusive arguments.
Secondly, non-Hispanic Blacks stayed significantly longer than their Hispanic and non- Black counterparts. In addition, the interaction between for-profit status and non-Hispanic Blacks resulted in significantly higher charges than non-Hispanic Blacks received in non-profit hospitals. There was not a significant interaction between for-profit status and non-Hispanic Black patients in regards to length of stay, meaning that non-Hispanic Black patients were not staying longer in for-profit hospitals than they were in non-profit hospitals. In Florida, Black households made the lowest median household income of any other race or ethnic group (U.S.
Census Bureau, 2015b). Therefore, it is concerning that they received higher charges, especially in for-profit centers. These results could suggest that for-profit hospitals are exploiting a low- income population by charging them higher costs, even when controlling for longer lengths of stay. Further information about income and insurance status need to be obtained about the non- Hispanic Blacks included in the sample to continue to explore this result.
Study Limitations
There were several limitations present in this study revolving around a lack of
information regarding several factors that could have impacts on the variables measured. A key limitation was the attempt to use length of stay as a measure of quality care. First and foremost, length of stay is a better measure of quality in residential treatment centers, when rehabilitation is the primary goal. In hospital inpatient care, stabilizing and detoxing a patient are also important procedures, but extended length of stay is not necessarily correlated with better outcomes of these two procedures. In addition, a lack of important additional information also leads to issues with using length of stay as a measurement of quality care. Numerous factors can have an effect on length of stay, with the most important variables being severity and chronicity of the primary disease, and the presence, severity, and chronicity of other diagnoses (Wolff, et al., 2015). The chronicity and history of substance abuse for each patient was not available and could not be measured in this study.
There were two measures of severity used in the study. The first measured severity of the primary disease by priority of the patient at admission and proved to be an unreliable variable. If this severity at admission were a true measure of the severity of addiction, then we would expect to see a positive correlation between length of stay and severity. Rather, the study found a very mixed relationship between these two factors, with patients of the highest level of severity staying fewer days. Rather, what the severity at admission was measuring was the degree to which the patient’s life was being threatened at the time of admission rather than the severity of the actual addiction. It is likely that patients admitted with the highest priority of admission were patients experiencing acute drug overdose, as this is the most immediate life threatening
complication of substance use. Therefore, the highest measure of severity was not actually a
reflection of the severity of the addiction, but rather a measure of acute drug poisoning. The second measure of severity used in the study was the level of drug addiction, measured as either dependence or abuse. Typically, patients meeting the criteria for drug dependence should have a more serious addiction and have suffered from drug use for a longer period of time than patients suffering from drug abuse. Therefore, patients with drug dependence should be considered more severe and should have a longer length of stay. However, the study found no significant
relationship between these factors and length of stay, suggesting that the using dependence and abuse to measure severity of addiction was also not a reliable measure.
The other key factor that affects length of stay is the severity and chronicity of other diagnoses. Although the number of other diagnoses and ICD-9-CM code for each diagnosis was given, the severity and chronicity of these diseases was not provided. Without controlling for these factors, length of stay is not an accurate measure of quality of care.
In addition to issues with length of stay as a measure for quality, the lack of information about socioeconomic status (SES) could be causing a misinterpretation of results. We know that lower SES is correlated with poor health outcomes, so it is important in future research to examine the interactions between SES, facility ownership, quality of care, and patient charges.
For example, SES is important when looking at the relationship between discharge status and facility ownership. Although higher rates of discharges against medical advice can be associated with increased readmission for substance abuse and suggest lower quality care, there are also financial reasons that a patient could choose to leave care. Including SES in regression models with the interaction between for-profit and discharge status could have produced significant results rather than the current interaction that was not significantly significant. SES would have also been an important factor in understanding the trends in spending on Medicare patients. To
further examine the results of this study, it is imperative to know the number of patients that are dually eligible to qualify for Medicaid and Medicare to analyze how potential conflicts between the two programs could result in profit-driving incentives.
Conclusion
In conclusion, there are significant differences in certain factors among substance abuse patients who are treated in for-profit and non-profit hospitals. Regression results suggest that patients are charged more in for-profit centers, but there is no effective way to measure a possible difference in quality of care. Although the length of stay for high severity patients is shorter in for-profits than in non-profits, this factor does not necessarily correlate with quality of care and can not be used to make any definitive conclusions. In addition, the tendency of for- profit centers to keep Medicare patients for a longer period of time and produce higher charges for these patients could imply that for-profit centers are exploiting a vulnerable population of dual-eligible individuals in order to increase profits. However, this conclusion can not be tested until data on SES, income levels, and Medicaid eligibility are provided for the patients in the sample.
If further tests were to be run on this data, it would be necessary to create a more accurate representation of quality of care and to obtain information about the SES of the patients. Quality of care is hard to measure, especially among substance abuse patients. Perhaps a better measure of quality of care is rates of readmission for patients already discharged from treatment.
However, this type of data is either not tracked or not available for public use. If this data could be collected and tested against facility ownership and other factors examined in this study, more conclusive arguments could be formulated regarding differences in the quality of care provided.
In addition to data about readmission rates, data about the SES of patients is necessary to form a
full understanding of the interactions between variables in this study. SES is a key social determinant of health, and could have significant impact on the length of stay, total charges, discharge status, facility ownership preference, payer type, and a multitude of other factors. The regressions run in this study only accounted for between 33% and 35% of the variation in the data. Accounting for SES could increase the amount of variation that the regressions are able to explain and provide key insight into further interactions between these variables.
It is important to acknowledge that the data collection on substance abuse treatment facilities and the availability of such data is poor, especially in Florida. The SAMHSA treatment locator lists 355 private (non-government owned) facilities in the State of Florida that provide substance abuse treatment in an inpatient hospital setting (“Behavioral Health Treatment”, n.d.b).
However, the Florida AHCA only collects data on 20 of these hospitals. Of the data that are collected, very little information is given on the actual treatment that the patients receive while in care, or the health outcomes and results of the care that is given.
The results of this study are specific to inpatient hospital treatment in Florida. Although they can be helpful about making conclusions about inpatient hospital treatment in other states, they cannot be used to make conclusions about other types of facilities, such as inpatient residential or outpatient care. Data specific to these types of facilities need to be analyzed. For substance abuse treatment provided in non-hospital settings, the State of Florida collects no patient discharge data. Collecting data and measuring the quality of care at treatment facilities is imperative to improving care and ensuring that substance abuse patients are receiving adequate treatment. The State of Florida needs to charge a regulatory agency with the task of collecting and analyzing data on residential and outpatient treatment options.
It is evident that there are differences in a variety of variables among for-profit and non- profit hospitals that provide inpatient substance abuse treatment. For-profit centers do charge patients more for treatment, but it is unclear whether or not the treatment that they are providing is of a higher quality than their non-profit counterparts. The differences in length of stay and total charges among these facilities can not be ignored. An examination of the demographics of patients treated at each type of facility show that for-profit and non-profit hospitals treat different types of patients based on sex, ethnicity, race, and age. While the percentage of for-profit
treatment facilities continues to increase, differences in patient experience and outcomes at facilities with different types of ownership will only have an increasingly profound effect as this trend continues. Differences in experiences and outcomes will also have disparate effects on different demographics that are more likely to be treated in one type of facility over another. It is necessary to collect more extensive data on facilities that provide substance abuse treatment in order to make more definitive conclusions regarding the impact of differences in length of stay and total charges among a variety of different factors on quality of care provided to patients.
References
Bachhuber, M.A., Southern, W. N., & Cunningham, C. O. (2014). Profiting and providing less care: comprehensive services at for-profit, non-profit, and public opioid treatment programs in the United States. Med Care, 52(5), 428-434.
Behavioral Health Treatment Services Locator – SAMHSA. (n.d.a) Retrieved December 8, 2015, from https://findtreatment.samhsa.gov/locator?sAddr=33618&submit=Go
Behavioral Health Treatment Services Locator – SAMHSA. (n.d.b) Retrieved April 4, 2016, from https://findtreatment.samhsa.gov/locator?sAddr=Florida&submit=Go
Buck, J. A. (2011). The looming expansion and transformation of public substance abuse treatment under the Affordable Care Act. Health Affairs 30(8), 1402-1410.
Capstone Partners (2015). Behavioral Healthcare Services 1Q15. New York City, NY.
Center for Medicare & Medicaid Services (2008). MSDRG summary table. Retrieved from https://www.cms.gov/Medicare/Medicare-Fee-for-Service-
Payment/AcuteInpatientPPS/Acute-Inpatient-Files-for-Download-Items/CMS1247844.html Center for Medicare & Medicaid Services (2014, May 20). Version 32 full and abbreviated code
titles – effective October 1, 2013. Retrieved from
https://www.cms.gov/medicare/coding/ICD9providerdiagnosticcodes/codes.html Conners, N. A., Grant, A., Crone, C. C., Whiteside-Mansell, L. (2006). Substance abuse
treatment for mothers: Treatment outcomes and the impact of length of stay. Journal of Substance Abuse Treatment, 31(4), 447-456.
Choi, S., Adams, S. M., Morse, S. A., MacMaster, S. (2015). Gender differences in treatment retention among individuals with co-occurring substance abuse and mental health disorders. Substance Use and Misuse, 50(5), 653-663.
Delphin-Rittman, M., Andres-Hyman, R., Flanagan, E. H., Ortiz, J., Amer, M. M., & Davidson, L. (2012). Racial-ethnic differences in referral sources, diagnosis, and length of stay in inpatient substance abuse treatment. Psychiatric Services, 63(6), 612-615.
Devereaux, P. J., Choi, P. T. L., Lacchetti, C., Weaver, B., Schünemann, H. J., Haines, T.,…, Guyatt, G. H. (2002). A systematic review and meta-analysis of studies comparing mortality rates of private for-profit and private non-for-profit hospitals. Canadian Medical Association Journal, 166(11), 1399-1406.
Devereaux, P. J., Heels-Ansdell, D., Lacchetti, C, Haines, T., Burns, K. E. A., Cook, D. J.,…, Guyatt, G. J. (2004). Payments for care at private for-profit and private not-for-profit hospitals: A systematic review and meta-analysis. Canadian Medical Association Journal, 170(12), 1817-1824.
Donovan, J. (1997). A question of community: At not-for-profit hospitals health is a local affair.
Fund Raising Management, 28(8), 32-42.
Florida Not for Profit Corporations Act, F.S. 617 (2013).
Florida Agency for Health Care Administration (2010). Hospital inpatient data file (includes short-term/long-term psychiatric and comp rehab hospitals) limited data set file layout.
Tallahassee, FL: Florida Agency for Health Care Administration.
Frank, R. G., & Epstein, A. M. (2014). Factors associated with high levels of spending for younger dually eligible beneficiaries with mental disorders. Health Affairs, 33(6), 1006- 1013.
Gray, B. H., McNerney, W. J. (1986). For-profit enterprise in health care. New England Journal of Medicine, 314(23), 1523-1528.
Herrera, C. A., Rada, G., Kuhn-Barrientos, L., & Barrios, X. (2014). Does ownership matter? An overview of systematic reviews of the performance of private for-profit, private not-for- profit and public healthcare providers. PLoS ONE, 9(12), 1-18.
Hospital Corporation of America (2013). 2013 Behavioral Healthcare Conference Presented by Avondale Partners. Nashville, TN: Bridges and Kimbrough.
Jayakrishnan, B., Asmi, A. A., Qassabi, A. A., Nadhagopal, & R. Mohammed, I. (2012). Acute drug overdose: Clinical profile, etiologic spectrum and determinants of duration of intestive medical treatment. Oman Medical Journal, 27(6), 501-504.
Joynt, K. E., Orav, E. J., & Jha, A. K. (2014). Association between hospital conversions to for- profit status and clinical and economic outcomes. Journal of the American Medical Association, 312(16), 1644-1652.
Levit, K. R., Stranges, E., Coffey, R. M., Kassed, C., Mark, T. L., Buck, J. A., & Vandivort- Warren, R. (2013). Current and future funding sources for specialty mental health and substance abuse treatment providers. Psychiatric Services, 64(6), 512-519.
Medicare Learning Network (2013). Acute care hospital inpatient prospective payment system (ICN 006815). Baltimore, MD: Center for Medicare & Medicaid Services.
McBride, D. C., Chriqui, J. F., Terry-McElrath, Y. M., & Mulatu, M. S. (2012). Drug treatment program ownership, Medicaid acceptance, and service provision. Journal of Substance Abuse Treatment, 42, 116-124.
Rosenau, P. V., & Linder, S. H. (2003). A comparison of the performance of for-profit and nonprofit US psychiatric inpatient care providers since 1980. Psychiatric Services, 54(2), 183-187.
Sloan, F.A., Picone, G.A., Taylor Jr., D. H., & Chou, S. Y. (2001). Hospital ownership and cost and quality of care: is there a dime’s worth of difference? Journal of Health Economics, 20, 1-21.
Substance Abuse and Mental Health Services Administration (2005). National Survey of Substance Abuse Treatment Services (N-SSATS): 2004. Data on Substance Abuse Treatment Facilities (DASIS Series: S-28, DHHS Publication No. (SMA) 05-4112).
Rockville, MD: Substance Abuse and Mental Health Services Administration.
Substance Abuse and Mental Health Services Administration (2009). National Survey of Substance Abuse Treatment Services (N-SSATS): 2008. Data on Substance Abuse Treatment Facilities (DASIS Series: S-49, HHS Publication No. (SMA) 09-4451).
Rockville, MD: Substance Abuse and Mental Health Services Administration.
Substance Abuse and Mental Health Services Administration (2014a). National Su