Non-Invasive Venous Waveform Analysis (NIVA) for Estimation of Pulmonary Capillary Wedge Pressure
By Monica Polcz
Thesis
Submitted to the Faculty of the Graduate School of Vanderbilt University
in partial fulfillment of the requirements for the degree of
MASTER OF SCIENCE in
Biomedical Engineering
August 31, 2020 Nashville, Tennessee
Approved:
Professor Colleen Brophy, MD Professor Cynthia Reinhart-King, PhD
ii
ACKNOWLEDGEMENTS
First and foremost, I would like to thank Dr. Colleen Brophy for her unwavering support and guidance throughout my medical and graduate career. Without her mentorship I would not have had this tremendous opportunity for personal and professional growth. I would like to thank Dr. Cynthia Reinhart-King for her mentorship and collaboration. I would also like to thank Dr.
Kyle Hocking and Dr. Bret Alvis for their ongoing mentorship and invaluable guidance and assistance with performing this research. I would like to thank Dr. Jessica Huston for her clinical insight and assistance with interpretation of hemodynamic tracings for this experiment, and Dr.
JoAnn Lindenfeld who is an expert in Cardiology and assisted greatly with experimental design and analysis. I would like to thank Jon Whitfield for his programming expertise and development of the automated algorithm described in this thesis. I would also like to thank Dr. Joyce Cheung- Flynn and Dr. Padmini Komalavilas for their mentorship and guidance throughout my research.
I would like to acknowledge the Division of Cardiovascular Medicine at Vanderbilt University Medical Center for the opportunity to enroll patients in the catheterization lab for this study. This research was supported by a National Institutes of Health Postdoctoral Individual National Research Service Award (F32) # 5F32HL140849-02.
iii
TABLE OF CONTENTS
PAGE
ACKNOWLEDGEMENTS……….……….…..ii
LIST OF TABLES………..………v
LIST OF FIGURES………..………..vi
LIST OF ABBREVIATIONS………....……...………....vii
INTRODUCTION………..……….1
Clinical Assessment of Intravascular Volume……….1
Venous Waveform Analysis………..2
Current State of Non-Invasive Venous Waveform Analysis……….7
METHODS………..………8
Cardiac Catheterization………....……..8
Signal Analysis………..…….…….9
Algorithm Training………...….10
Statistical Analysis……….……11
RESULTS……….……….12
Study Population………12
NIVA Algorithm……….14
Thoracic Impedance (ZOE®)………18
DISCUSSION………18
Limitations……….22
Conclusion……….23
Potential Impact and Future Directions………..………..24
REFERENCES………..29
iv
TABLE OF CONTENTS (cont.)
PAGE APPENDIX………35 A. C++ Script for AlgorithmRunner.exe……….……..35 B. Supplementary Information for Selected Lasso Model……….………51
v
LIST OF TABLES
TABLE PAGE
1. Characteristics of included and excluded right heart catheterization subjects……….….13
SUPPLEMENTARY TABLE
1. Lasso linear model………...……..51
2. Goodness of fit of in-sample predictions………...……51
vi
LIST OF FIGURES
FIGURE PAGE
1. Comparison of central and peripheral venous waveforms………...4
2. NIVA device………5
3. Representative venous waveform signals of a patient with volume overload………….…7
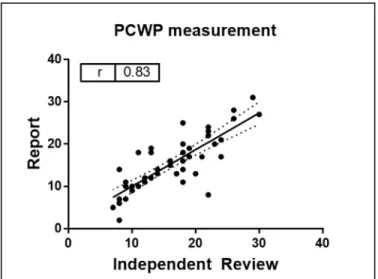
4. Correlation between pulmonary capillary wedge pressures (PCWP) obtained from report versus blinded review of hemodynamic waveform………...14
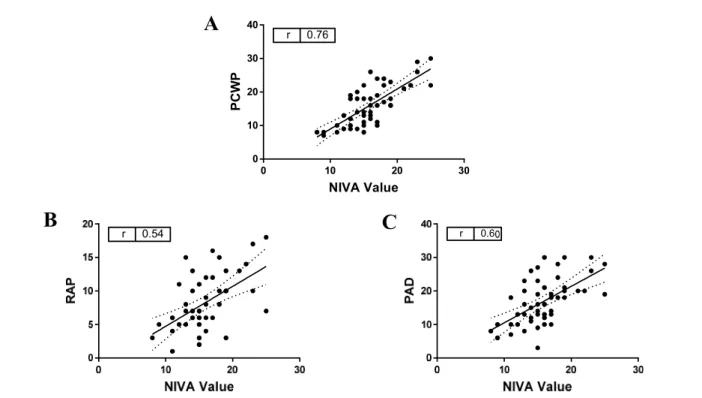
5. Correlation of NIVA value to measured PCWP, right atrial pressure (RAP) and pulmonary artery diastolic pressures (PAD) in subjects undergoing right heart catheterization………15
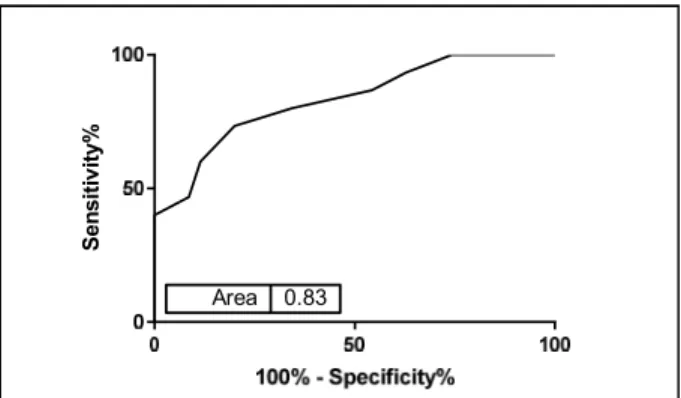
6. ROC curve for ability of NIVA to detect PCWP>18mmHg……….16
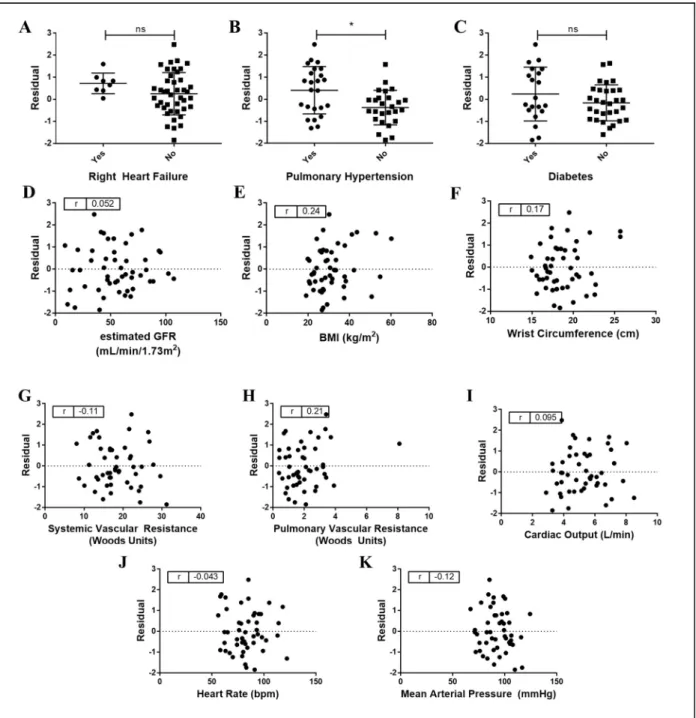
7. Predictive accuracy of NIVA to estimate PCWP based on clinical variables and catheterization data………17
8. Correlation between ZOE® and PCWP………18
9. Hemodynamic flow loop………...27
10. NIVA signal obtained in patient with atrial fibrillation……….28
SUPPLEMENTARY FIGURE 1. Cross Validation Function……….…52
vii
LIST OF ABBREVIATIONS
AUC = Area under the curve BMI = Body mass index CKD = Chronic kidney disease CO = Cardiac output
EF = Ejection Fraction
GFR = Glomerular filtration rate HF = Heart failure
HTN = Hypertension
LVEDV = Left ventricular end diastolic volume MAP = Mean arterial pressure
NIVA = Non-Invasive Venous waveform Analysis PAC = Pulmonary artery catheter
PAD = Pulmonary artery diastolic pressure PCWP = Pulmonary capillary wedge pressure PIVA = Peripheral Intravenous waveform Analysis PVR = Pulmonary vascular resistance
viii RAP = Right atrial pressure
RHC = Right heart catheterization RHF = right heart failure
ROC = Receiver Operating Characteristic SNR = Signal to noise ratio
SVR = Systemic vascular resistance
1 Introduction:
Clinical Assessment of Intravascular Volume
Accurate assessment of intravascular volume status remains a challenge for clinicians.
Pathological volume overload is particularly problematic in patients with heart failure (HF), renal failure, and in the critically ill population that is prone to over-resuscitation with crystalloid solutions. Such volume overload ultimately results in decreased cardiac output due to
overstretching of the myocardium, hypertension, tissue and pulmonary edema, and increased morbidity and mortality.1,2 Current measures of volume status rely largely on clinical signs which have proven unreliable including vital signs, jugular venous distention, subjective shortness of breath, weight changes, extent of peripheral edema, and laboratory values.3
Hemodynamic measures of volume status, though more accurate, are largely limited to the inpatient setting and require an invasive approach which limits their utility. Pulmonary capillary wedge pressure (PCWP) is the gold standard measure for volume status utilized by clinicians and represents left-sided cardiac filling pressures, a surrogate for preload. This is obtained through insertion of a Swan-Ganz catheter (PAC) into a central vein -- risking infection, arterial, or pulmonary injury. The catheter is then advanced past the right heart and into a
terminal pulmonary artery which is occluded by a balloon for distal pressure measurements, associated with the low but finite risk of pulmonary artery rupture. Its use is supported by the observation that elevated cardiac filling pressures have been associated with increased
hospitalizations and mortality,4,5 and often precede the development of symptoms related to HF decompensation.6 Other hemodynamic parameters that have more limited accuracy for
estimation of volume status include absolute central venous pressure measurements,7 absolute
2
peripheral venous pressure measurements,8 and arterial waveform analysis [which is limited in accuracy to mechanically ventilated patients with high tidal volumes (>8cc/kg)].9
There has been increasing interest in developing non-invasive methods to estimate volume status for use in the inpatient and outpatient settings to guide volume management and prevent costly hospital readmissions. Thoracic impedance is one such method developed for this purpose. This technique quantifies the resistance encountered by an electrical current through the chest, with decreased resistance (lower values) corresponding to increased fluid content. Such devices demonstrate moderate correlation with PCWP,10,11 but the specificity of static impedence measurements is limited by patient positioning,12 body tissue (fat) composition,13 presence of cutaneous hair or sweat, and lead placement. Other described techniques utilize changes with Valsalva in the pulse amplitude or slope of non-invasively obtained plethysmograph14,15 or arterial signals16-18, respectively. Although these techniques also have moderate to strong
correlations with PCWP, performance of a sustained Valsalva maneuver may present difficulties in patients with shortness of breath due to congestion. Thus, there remains an unmet clinical need for accurate, reliable, easy to use, non-invasive technologies that assess volume status.
Venous Waveform Analysis
Venous waveform analysis has recently been developed as a novel, alternative approach for monitoring intravascular volume status. The venous system consists of the central venous compartment which contains ~18% of the total blood volume and the peripheral venous
compartment which contains ~45%.19 The peripheral venous system has a high capacitance and serves as the body’s main blood volume reservoir. This is because the peripheral venous system
3
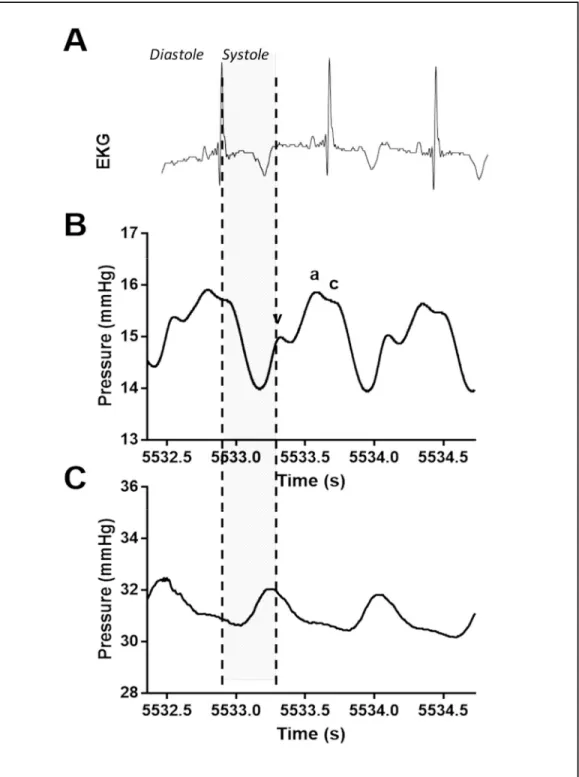
is more compliant (110 mL/mmHg) than the arterial (2 mL/mmHg) or even the central venous compartment (4 mL/mmHg).20 In response to physiological demand, neurohumoral input of venous tone allows shifting of blood between the peripheral and central venous compartments in order to maintain cardiac stroke volume. The central venous waveform consists of various peaks and troughs representing forward and backward waves as blood flows through the heart.
Peripheral venous waveform morphology differs from the central venous waveform, potentially due to the direction of the waveform (forward vs. backward compression wave), dampening related to the presence of valves, increased compliance, and/or distance from the heart (Figure 1).
4
Figure 1 Comparison of central and peripheral venous waveforms. (A) Electrocardiogram (EKG) time-synced with directly transduced (B) central venous waveform obtained from the superior vena cava and (C) peripheral venous waveform obtained from the extremity in a pig. In the central venous waveform (B), the a-wave corresponds to atrial contraction, which is followed by the c-wave which occurs due to bulging of the tricuspid valve during early systole. The v-wave occurs in late systole with
filling of the right atrium.
5
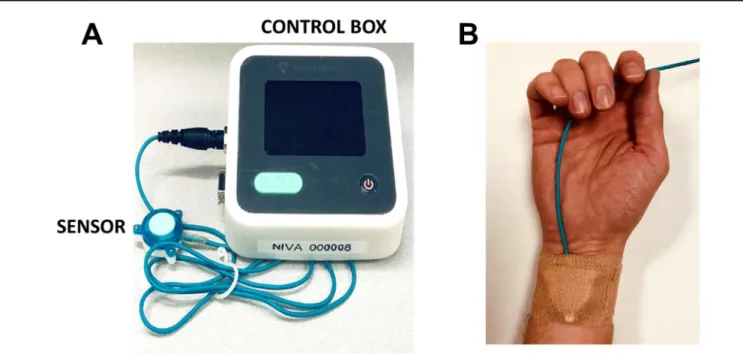
Because the peripheral venous system serves as a volume reservoir, storing a majority of the total blood volume, it is a logical focus of technology aiming to estimate intravascular volume status. Acquisition of venous waveforms is most directly performed via direct transduction through a peripheral intravenous catheter. Venous signals may also be captured non-invasively with a piezoelectric sensor placed on the volar aspect of the wrist, directly over the superficial veins, known as Non-Invasive Venous waveform Analysis (NIVA, Figure 2). The piezoelectric sensor is connected to a control box that amplifies the venous waveform detected from vibrations related to the low amplitude pulsatile flow of venous blood.
Figure 2 NIVA device. (A) Photograph of the NIVA device (sensor and control box) used for venous waveform capture. (B) Photograph of the NIVA device sensor placed on subject’s wrist for waveform capture.
6
Mean peripheral venous pressures, which change minimally with volume due to the high compliance of peripheral veins, do not correlate strongly with PCWP.8 Venous waveform parameters demonstrated in small studies to change with hypovolemia include time-domain parameters such as venous pulse pressure, mean venous pressure, pulse width, and maximum and minimum slope over the whole peak.21 Analysis of the venous waveform in the frequency
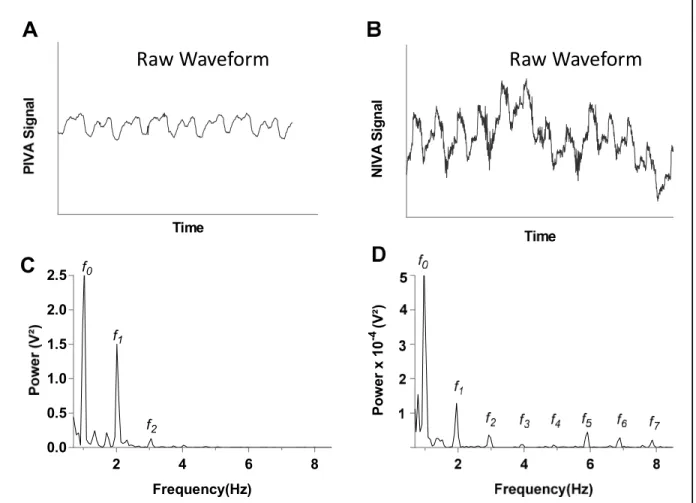
domain also yields predictable changes with changes in venous volume. Similar to other vascular waveforms, the raw venous signal is characterized most prominently by a wave generated by the cardiac cycle. Although this fundamental frequency (f0), equal to the pulse rate is easily observed by eye in the time-domain, deconvolution of the waveform into the frequency domain with a Fourier transformation exposes additional frequencies which are not otherwise visible -- this includes a wave (low-frequency) generated by the respiratory cycle, as well as higher harmonics, or multiples, of the pulse rate (f1-f7, Figure 3). The harmonics of the pulse rate are generated and transmitted as a result of local resonance, and therefore are more prominent in non-invasively obtained signals as the result of the soft tissue layer between the sensor and the vein. Ratiometric algorithms incorporating the relative amplitude or power contributions of these cardiac
frequencies to their overall sum have been developed and validated in states of hypo- and hypervolemia in both directly transduced and non-invasively obtained waveforms.22-26 These algorithms are referred to as Peripheral IntraVenous waveform Analysis (PIVA) in directly transduced waveforms and Non-Invasive Venous waveform Analysis (NIVA) in waveforms obtained non-invasively with a piezoelectric sensor placed on the wrist.
7
Current State of Non-Invasive Venous Waveform Analysis
NIVA holds particular promise as an easy to use, non-invasive method of venous waveform capture and analysis for assessment of volume status. In addition to the ability to detect small amounts of blood loss in normal human subjects donating blood (AUC 0.94, p<0.05),22 an early prototype and algorithm have demonstrated strong correlation with a wide range of PCWP in patients undergoing elective right heart catheterization (r=0.69, p<0.05, n=83,
Figure 3 Representative venous waveform signals of a patient with volume overload (PCWP=28). (A) and (C) display the raw waveform and fast Fourier transform (FFT), respectively, of the peripheral intravenous
pressure waveform (PIVA) obtained from an intravenous pressure transducer. (B) and (D) display the raw waveform and fast Fourier transform, respectively, of the peripheral venous waveform obtained noninvasively
utilizing a piezo electric sensor (NIVA).
Time
A
NIVA SignalPower x 10-4 (V²)
2 4 6 8
0.0 0.5 1.0 1.5 2.0 2.5
Frequency(Hz) f0
f1
f2
C
Raw Waveform Raw Waveform
8
PCWP 4-40 mmHg) and ability to accurately predict PCWP >18 mmHg, a clinically accepted value indicating venous congestion, with a sensitivity of 80% and a specificity of 53%.23 Subsequent technological improvements to improve signal acquisition have included the incorporation of a charge amplifier. With an improved prototype, the aim of this thesis was to use machine learning to refine an algorithm for estimation of PCWP from NIVA signals with the updated sensor. As input for algorithm development, non-invasively obtained venous signals were obtained from patients undergoing elective right heart catheterization. For comparison, the correlation between PCWP and thoracic impedance scores were also investigated (ZOE®).
Methods:
Cardiac Catheterization
Seventy-eight subjects undergoing elective right heart catheterization (RHC) were enrolled under approval from the University of Alabama Birmingham and Vanderbilt University Medical Center Institutional Review Boards. Indications for RHC included management of congestive heart failure, post-heart transplant biopsy, and workup for dyspnea. Subjects with severe valvular disease, active atrial fibrillation, congenital heart disease, or cardiac assist devices were excluded from this study.
The sensor of the NIVA device was secured to the middle volar aspect of the wrist overlying the superficial veins with Coban elastic wrap (3M; Minneapolis, MN). Placement laterality was preferential to an upper extremity without any existing peripheral IV lines. Signals were acquired for at least two minutes within one hour of catheterization keeping the extremity
9
still. All subjects were positioned in the semi-recumbent position (head of bed elevated to 30-60 degrees). Additional information obtained included demographic information, comorbidities, hemodynamic parameters obtained from the final catheterization report, and vital signs at the time of signal acquisition.
In twenty patients without visible chest hair, a ZOE® measurement was obtained per manufacturer’s instructions. Prior to placement of the leads, it was ensured that the placement area was dry. Three consecutive ZOE® measurements were obtained and averaged for each subject.
RHC was performed by an experienced interventional cardiologist per standard protocol.
An 8 French sheath was placed into either the internal jugular or femoral vein depending on anatomy. A 7 French Swan-Ganz catheter (Edwards Lifesciences; Irvine, CA) was introduced into the sheath and transducer was zeroed at the mid-axillary line.The Swan-Ganz catheter was positioned in the right heart system to record pressures and cardiac outputs.All subjects were spontaneously breathing with PCWP measurements obtained at end-expiration. RHC tracings were reviewed and PCWP values were assigned by an independent cardiologist. The PCWP values were assigned at an end expiratory measurement of the mean of the “a” wave, determined based on simultaneous electrocardiogram.
Signal Analysis
Data was collected using a three dimensional printed housing containing a mu rata piezoelectric sensor fashioned to the volar aspect of the wrist. This prototype device was attached via a cable to the monitoring data-logger device which used a low (~0.9 Hz) cutoff
10
frequency created by changing the input impedance on the charge amplifier. The data was then ported to a PC computer where an automated application (AlgorithmRunner.exe, Appendix A) was used to determine the pulse rate as well as the power of various harmonics of the signal (f0- f7). This program used 50% overlapping 8K windows. The sampling rate for the device was 500 Hz. Adequate signal was defined as three or more signal segments with a signal to noise ratio estimation of greater than 20. This threshold was chosen based on previous data that examined the minimal threshold at which reproducibility of amplitude measurements with low variance could be obtained.
Algorithm Training
An algorithm was trained using data from 3-5 windows for each subject in Stata 16/IC (StataCorp; College Station, TX) to generate a “NIVA value” that estimates PCWP. In addition to heart rate, the raw powers of f0-f7 computed by the automated algorithm were used as input for model development, as well as calculated variables that included the relative power of each frequency, the ratio of each power to the power of f0, and the high frequency component (sum of powers f3-f7) relative to total power or the power of f0. Lasso technique was used to select and fit covariates to create a linear regression model. Lasso is a commonly used method invented by Tibshirani for building prediction models, and avoids overfitting by limiting the number of included predictor variables and minimizing an estimate of the out-of-sample prediction error.27 Lasso orders models on a scalar parameter (λ) which is a parameter of the penalty function, defined over 0 to +∞. A large λ corresponds to a large penalty and a model with few or no variables, while a model with smaller λ has more variables. Model selection was performed using cross-validation with ten folds to select a λ that minimizes an estimate of the out-of-sample
11
prediction error. Once a model was chosen, final predicted PCWP was calculated by averaging the NIVA values across the 3-5 windows for each subject.
Statistical Analysis
Statistical analysis was performed using Stata 16/IC (StataCorp; College Station,TX) and GraphPad Prism (GraphPad Software Inc.; La Jolla, CA). Results for continuous variables are reported as mean + standard deviation. Pearson correlation coefficients were calculated for NIVA value compared to PCWP, pulmonary artery diastolic pressure (PAD), and right atrial pressure (RAP), as well as ZOE® value compared to PCWP. Residual analyses were performed to evaluate the effects of clinical right heart failure (RHF), systemic vascular resistance (SVR, Wood units), pulmonary vascular resistance (PVR, Wood units), cardiac output (CO, L/min), pulmonary hypertension (defined as mean pulmonary artery pressure >25 mmHg)28, presence of diabetes, estimated glomerular filtration rate (GFR, mL/min/1.73m2), heart rate, mean arterial blood pressure (MAP, mmHg), body mass index (BMI, kg/m2), and wrist circumference (cm) on the predictive accuracy of NIVA to PCWP. Residuals were plotted as the standardized residual calculated from the linear regression of NIVA vs PCWP. Of note, SVR and PVR were recorded in the catheterization reports as Wood Units, with 1 Wood Unit = 80dynes*sec*cm-5. A
Receiver Operating Characteristic (ROC) curve was used to determine whether NIVA could predict clinical congestion, defined as a PCWP >18 mmHg, a threshold chosen based on prior literature defining a resting PCWP >18 mmHg as indicative of congestion and decompensation in heart failure. 3,29 P-values <0.05 were considered significant for all analyses.
12 Results:
Study Population
Of the 78 subjects enrolled, 23 (29.4%) were excluded due to a NIVA signal-to-noise ratio (SNR) <20 throughout the entire signal. An additional 5 (6.4%) were excluded because there were less than three windows with a SNR>20.
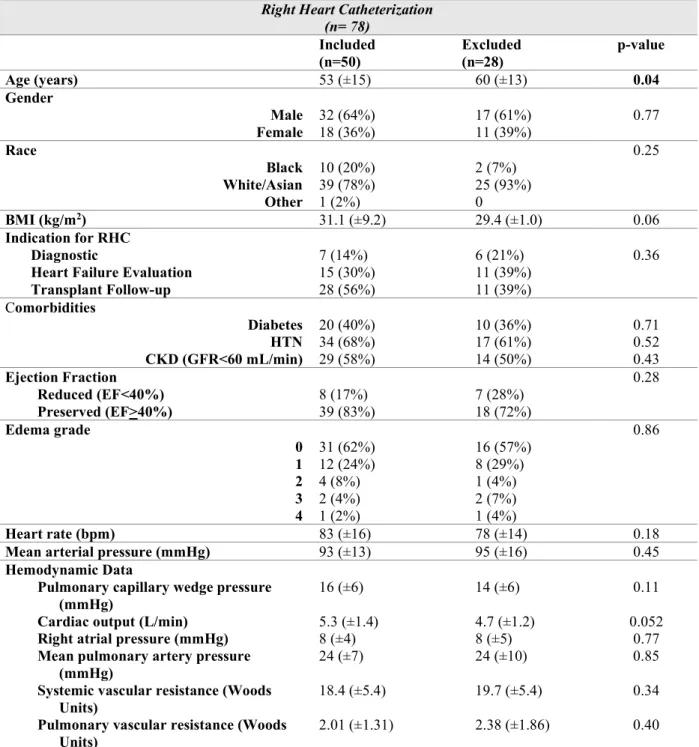
Demographic information for the analyzed cohort (n=50) and characteristics of excluded patients are displayed in Table 1. Mean age was 53 (±15) years, 64% of subjects were male, and 10 (20%) were black. Indications for RHC included heart failure evaluation in 15 (30%), post- cardiac transplant rejection surveillance in 28 (56%), or as diagnostic workup in 7 (14%). Of those patients undergoing RHC for heart failure evaluation that had an echocardiogram within the preceding year, ejection fraction was reduced (EF<40%) in 8 (53%) and preserved in 7 (47%).
13
Right Heart Catheterization (n= 78)
Included
(n=50) Excluded
(n=28) p-value
Age (years) 53 (±15) 60 (±13) 0.04
Gender
Male
Female 32 (64%)
18 (36%) 17 (61%)
11 (39%) 0.77
Race
Black White/Asian Other
10 (20%) 39 (78%) 1 (2%)
2 (7%) 25 (93%) 0
0.25
BMI (kg/m2) 31.1 (±9.2) 29.4 (±1.0) 0.06
Indication for RHC Diagnostic
Heart Failure Evaluation Transplant Follow-up
7 (14%) 15 (30%) 28 (56%)
6 (21%) 11 (39%) 11 (39%)
0.36
Comorbidities
Diabetes HTN CKD (GFR<60 mL/min)
20 (40%) 34 (68%) 29 (58%)
10 (36%) 17 (61%) 14 (50%)
0.71 0.52 0.43 Ejection Fraction
Reduced (EF<40%) Preserved (EF>40%)
8 (17%) 39 (83%)
7 (28%) 18 (72%)
0.28
Edema grade
0 1 2 3 4
31 (62%) 12 (24%) 4 (8%) 2 (4%) 1 (2%)
16 (57%) 8 (29%) 1 (4%) 2 (7%) 1 (4%)
0.86
Heart rate (bpm) 83 (±16) 78 (±14) 0.18
Mean arterial pressure (mmHg) 93 (±13) 95 (±16) 0.45
Hemodynamic Data
Pulmonary capillary wedge pressure
(mmHg) 16 (±6) 14 (±6) 0.11
Cardiac output (L/min) 5.3 (±1.4) 4.7 (±1.2) 0.052
Right atrial pressure (mmHg) 8 (±4) 8 (±5) 0.77
Mean pulmonary artery pressure
(mmHg) 24 (±7) 24 (±10) 0.85
Systemic vascular resistance (Woods
Units) 18.4 (±5.4) 19.7 (±5.4) 0.34
Pulmonary vascular resistance (Woods
Units) 2.01 (±1.31) 2.38 (±1.86) 0.40
Table 1. Characteristics of included and excluded right heart catheterization subjects. Data presented as mean (+SD) for continuous variables or count (%) for categorical variables.
PCWP measurements used in the analysis were those obtained from a post hoc
independent review of the hemodynamic tracings. These correlated with PCWP measurements in
14
the computerized report (r=0.83, p<0.05, Figure 4). PCWP in the analyzed cohort ranged from 7 to 30 mmHg, with a mean of 16 (±6) mmHg. Other hemodynamic indices obtained during catheterization are displayed in Table 1. Other than age, no notable differences were noted between included and excluded subjects.
NIVA Algorithm
Of the 26 potential predictor variables included in the Lasso, 22 were included in the final model with a λ=0.015 selected (Appendix B). Goodness of fit of predictions using penalized coefficients from the selected model demonstrated an R-squared of 0.49. Final NIVA values demonstrated a significant positive correlation with PCWP (r=0.76, p<0.05, Figure 5A). NIVA values also demonstrated a positive correlation with RAP (r=0.54, p<0.05, Figure 5B) and PAD (r=0.60, p<0.05, Figure 5C).
Figure 4 Correlation between pulmonary capillary wedge pressures (PCWP) obtained from report versus blinded review of hemodynamic waveform.
15
ROC analysis demonstrated that NIVA is able to identify a PCWP >18 mmHg with a sensitivity of 73% and a specificity of 80% (AUC=0.83, p<0.05, Figure 6).
Figure 5 Correlation of NIVA value to measured PCWP, right atrial pressure (RAP) and pulmonary artery diastolic pressures (PAD) in subjects undergoing right heart catheterization. (A) NIVA values correlate with PCWP (mmHg) in elective right heart catheterization (n=115, r=0.89, p<0.05). (B) NIVA values correlate with right atrial pressure (n=114, r=0.60, p<0.05) and (C) pulmonary artery diastolic pressure (n=115,
r=0.55, p<0.05) measurements (mmHg) in elective right heart catheterization. Abbreviations: NIVA= non- invasive venous waveform analysis, PCWP=pulmonary capillary wedge pressure, RAP= right atrial pressure,
PAD= pulmonary artery diastolic pressure.
0 10 20 30
0 10 20 30 40
NIVA Value
PCWP
r 0.76
r 0.6 r 0.54
A
B C
16
Residual analyses demonstrated that the accuracy of NIVA to predict PCWP was not significantly affected by SVR, PVR, CO, GFR, RHF, diabetes, BMI, wrist circumference, heart rate, or mean arterial pressure (Figure 7). Residuals were higher (mean 0.41 vs -0.38, p<0.05) in subjects with pulmonary hypertension.
Figure 6 ROC curve for ability of NIVA to detect PCWP>18mmHg.
Sensitivity%
Area 0.83
17
Figure 7 Predictive accuracy of NIVA to estimate PCWP based on clinical variables and catheterization data. * signifies p-value <0.05. All other correlations were nonsignificant (p>0.05). Pulmonary hypertension is
defined as a mean pulmonary arterial pressure > 25 mmHg.
18 Thoracic Impedance (ZOE®)
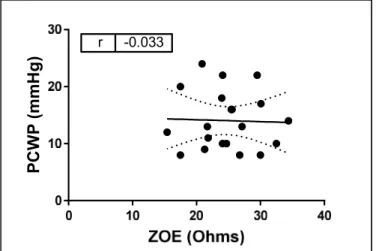
With impedance technology, lower resistance is associated with increased thoracic fluid content (thus, ZOE® values inversely correlate with volume status). ZOE® demonstrated a nonsignificant negative correlation with PCWP (r= -0.03, p=0.89, Figure 8).
Discussion:
The NIVA value is a numerical value generated from algorithmic analysis of the harmonics of peripheral venous waveforms derived from a non-invasive sensor. This report demonstrates the ability to use machine learning to generate an algorithm to calculate a NIVA value that estimates PCWP with a high degree of accuracy (r=0.76, p<0.05) over a range of clinical variables including systemic vascular resistance, pulmonary vascular resistance, and
Figure 8 Correlation between ZOE® and PCWP.
ZOE® did not correlate significantly with PCWP (r=- 0.03, p=0.89, n=20)
PCWP (mmHg) r -0.033
19
cardiac output. Unlike PCWP, which requires invasive catheterization, NIVA is non-invasive and therefore may be used to monitor congestion in the inpatient, outpatient, and home settings with minimal risk. NIVA was able to detect a PCWP>18, clinically indicative of congestion, with a sensitivity of 73% and a specificity of 80% (AUC=0.83, p<0.05). These findings represent an improvement from the earlier prototype23 and demonstrate the ability of venous waveform analysis to accurately and non-invasively estimate PCWP, which has the potential to help guide therapy in patients with heart failure in and out of the hospital.
The current clinical gold standard utilized by clinicians to assess volume status is pulmonary capillary wedge pressure, which represents left-sided cardiac filling pressures, a surrogate of preload, and carries inherent risks due to the invasive nature of the procedure. In 2005, data from the multicenter Evaluation Study of Congestive Heart Failure and Pulmonary Artery Catheterization Effectiveness (ESCAPE) trial was published evaluating 433 patients admitted with acute decompensated heart failure, assigned to receive therapy guided by clinical assessment alone or in conjunction with PAC targets.30 Although use of the PAC demonstrated improvements in exercise and quality of life endpoints, patients in this cohort also had increased risk of adverse events with no differences in observed mortality. Therefore, although the routine use of PAC-obtained measurements in management of HF has not been established, the 2013 ACCF/AHA Guidelines for the Management of Heart Failure continue to support the use of invasive hemodynamic monitoring in select patient populations. These include “patients who have respiratory distress or clinical evidence of impaired perfusion in whom the adequacy or excess of intracardiac filling pressures cannot be determined from clinical assessment” as well as patients with worsening renal function and/or persistently low systolic blood pressure in the setting of unclear fluid status.31
20
Additionally, there has been data to support the use of an implantable wireless pulmonary artery pressure monitor to guide outpatient management of HF to reduce hospitalizations. The CHAMPION trial (2010) evaluated patients with persistent NYHA Class III heart failure randomized to usual disease management strategies versus therapy guided by daily pressure measurements from an implanted pulmonary artery pressure monitor, and demonstrated a
significant reduction in heart failure related hospitalizations in the latter group.32 Therefore, these hemodynamic measurements, although risky to obtain, have clinical value in patient
management and quality of life. Therefore, a device that could provide a similar measure while abolishing the risks involved with an invasive procedure has clear promise toward improving inpatient and outpatient care of patients with HF with expansion toward other disorders that lead to pathological alterations in intravascular volume. These results demonstrate that NIVA, a noninvasive device, correlates strongly with a wide range of PCWP (r=0.76) and PAD (r=0.60).
Given these promising results, further studies are warranted to determine if the NIVA device can provide the same improved clinical outcomes as the invasive measures with which it correlates.
In comparison, the correlation between PCWP and existing thoracic impedance technology (ZOE®) was not significant. A limitation is that only a small number of enrolled patients lacked chest hair and were thus able to participate in obtaining an impedance
measurement, and future comparisons should attempt to obtain a higher number of subjects.
Impedance technology relies on downstream effects of congestion, such as pulmonary edema and intrathoracic fluid content, rather than estimation of intracardiac filling pressures, and it is unclear whether resolution of pulmonary edema correlates with complete intravascular
decongestion.33,34 Another difficulty in interpreting measures of thoracic impedance is that the output value (Ohms) is difficult to understand clinically as it does not equate to any existing
21
understood measures of intravascular volume, and the scale is inverse to volume status (lower number = higher intravascular volume). NIVA is simple to use and can provide a numeric output that predicts a widely understood clinical measure of intravascular volume, PCWP.
Though the algorithm used in this report was tailored to correlate with PCWP, which may raise the concern of overfitting, use of a Lasso regression model avoids overfitting by limiting the number of included predictor variables and minimizing an estimate of the out-of-sample prediction error. As displayed in Supplementary Table 1, selection of the described model using cross-validation has an estimated out-of-sample R-squared of 0.37 – future enrollment of patients undergoing RHC to generate a “test” dataset not involved in model training will be useful for validation of this algorithm and to determine a more accurate R-squared. Alternatively, future enrollment of a larger dataset with lasso model selection using the plugin estimator, rather than the cross-validation method, may further control for overfitting by calculating a value for λ that dominates the noise in the estimating equations, which results in fewer variables in the final model and ensures that the variables selected belong to the true model with high probability.
Data was obtained at a single institution (VUMC). TheRHC population incorporated a wide range of demographics, BMI, and PCWP. Residual analysis demonstrated that prediction error was not altered over a range of systemic vascular resistance, pulmonary vascular resistance, cardiac output, heart rate, mean arterial blood pressure, and presence of diabetes (which may affect vessel compliance). Additionally, although a linear relationship between predictor
variables and PCWP is assumed in the model development chosen for this study, future iterations of algorithm development may use more sophisticated machine learning techniques, such as neural networks, to better identify and quantify complex nonlinear relationships between waveform parameters and PCWP.
22 Limitations
The major limitation of this study is the large number of waveforms excluded due to signal noise, accounting for approximately one-third of enrolled subjects. This is almost certainly related to the low-amplitude nature of the peripheral venous signal (10-15 mmHg), which is easily obscured by motion artifact. A comparison of the included and excluded cohorts did not identify any other obvious explanations for poor signal quality in excluded subjects (Table 1).
This suggests that ongoing improvements in sensor apposition, signal acquisition and
amplification are required for future prototypes if they are to be used in awake patients. A SNR threshold of 20 was chosen for this study based on previous data that examined the minimal threshold at which reproducibility of amplitude measurements with low variance could be obtained. A minimum of three windows was also employed to enhance reproducibility during algorithm development. As newer prototypes are developed, these threshold values can be reassessed to ensure optimization of maximal signal capture with minimal signal variance.
Potential future sensor and analysis improvements include incorporation of a
photoplethysmograph to assist with validation of the pulse rate by the automated program, incorporation of an accelerometer to automatically discard signal segments with significant motion artifact, use of band or notch filters to attenuate signals due to respiration or motion, adjustment of amplifier gain, or attempts to subtract noise from the signal through incorporation of additional piezos to detect motion.
Strict exclusion criteria were utilized including subjects with active atrial fibrillation, congenital heart disease, or cardiac assist devices as it remains unclear whether accurate
measurements can be obtained in these populations, and further studies are warranted to further investigate these. Although not relevant in this particular study population, the effect of
23
vasoactive drugs and altered venous tone on the venous signal also remains incompletely understood. Henry et al. demonstrated that isoflurane, a vasodilating volatile anesthetic, affects the peripheral venous waveform morphology in a dose-dependent manner, which may directly impact waveform analysis.35 Further studies are needed to quantify these effects and how they may affect assessment of volume. Another limitation of this study is that inherent to the question of whether PCWP accurately reflects left ventricular end-diastolic volume (LVEDV),35 however this correlate was chosen given the improved clinical outcome data described earlier as well as its relative availability for ease of data collection and objectivity over radiographic measures of LVEDV, which may be more user-dependent. Another inherent limitation in comparison of NIVA to PCWP lies in the reproducibility and accuracy of PCWP measurements.35 To overcome this, PCWP measurements were analyzed in patients undergoing RHC, a controlled setting, and tracings reviewed by an independent, blinded cardiologist.
Conclusion
NIVA is a promising non-invasive technology for estimation of volume status. This study demonstrates a process of iterative algorithm development as the sensor is modified and
improved, resulting in an improved correlation with PCWP and specificity in detection of congestion. Machine learning is used to incorporate the amplitude changes of the cardiac component of the venous waveform, a fundamental concept of venous waveform analysis for volume assessment, toward estimation of a clinical gold-standard, PCWP. Further validation of this algorithm in a separate test set is needed. Importantly, this study also highlights that ongoing improvements in signal acquisition and reduction of noise are still required. As the device is
24
updated, and this process repeated, additional machine learning techniques such as neural networks may be used to improve accuracy through identification of complex nonlinear relationships between waveform parameters and volume status.
Potential Impact and Future Directions
Future applications for a user-friendly, non-invasive device that can accurately estimate volume status are broad, including in resource scare environments and the inpatient and
outpatient settings. The ability to quickly identify and guide resuscitation in life-threatening states of hypovolemia, such as that due hemorrhage, would have great impact not only in the hospital and operating room, but for emergency triage, in combat, and globally. Dehydration, another etiology of hypovolemia, is rampant in the elderly, athletes, and worldwide secondary to malnutrition, malignancy, and gastrointestinal illness. To be most useful, application of NIVA to these settings may also benefit from expansion of the current device output. For example, development of an algorithm that quantifies rate of volume loss may be more practical in the setting of hemorrhage; this could be elucidated first in a porcine model of controlled hemorrhage and subsequently validated in human studies. In a small number of patients undergoing
hemodialysis, rate of volume loss as detected by an early NIVA prototype has demonstrated the ability to predict intradialytic hypotension – highlighting a potential use for NIVA to guide both ultrafiltration amounts and rate.36
Prevention and treatment of volume overload, or congestion, is an every day worry in the inpatient and outpatient setting for patients with heart failure or end stage renal disease.
25
Hemodynamic congestion and pulmonary edema may also occur in the acute setting as a complication of sepsis and critical illness; early identification has the potential to improve outcomes and prevent progression to respiratory failure and prolonged intubation. Additionally, in the setting of highly contagious infectious disease (i.e. COVID-19), a non-invasive device that can be monitored from a distance may assist in guiding care for critically ill patients while minimizing provider contact and potential exposure. Future studies in these populations are warranted to define the areas in which NIVA can improve clinical care.
For the use of NIVA to be practical and safe in such a wide assortment of clinical pathology, further work toward understanding additional physiologic parameters that may be altered by disease and affect non-invasively obtained venous waveforms are required. Local resonance of the venous waveform through soft tissue results in amplification of the higher harmonics of the pulse rate in non-invasively obtained signals compared to directly transduced waveforms (Figure 3). In clinical states of volume overload, varying degrees of edema alter the stiffness of the extravascular tissue in between the vein and NIVA sensor, potentially altering the amplitudes of the higher harmonics. Vessel compliance, altered by venous tone, may also affect the transmission of these higher harmonics.
Future work will examine these potential effects with an in vivo porcine model and an ex vivo hemodynamic flow loop. Phenylephrine, a vasoconstrictor, or sodium nitroprusside, a vasodilator, can be administered during controlled blood loss or crystalloid volume overload in a porcine model to determine the effect of venous tone on captured venous waveforms at various volume states. Venous compliance will be measured through diameter and pressure changes recorded with an intravenous ultrasound (ComboWireXT, Philips). Ongoing work is also
26
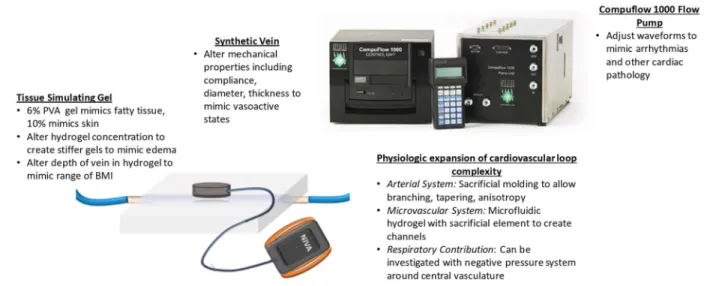
underway to design a hemodynamic flow loop (Figure 9) for controlled benchtop tuning of physiologic parameters that may confound or differentially affect the NIVA signal. This will consist initially of a single synthetic vein construct with tunable dimensions and mechanical properties to reflect altered compliance and tone, and will eventually be expanded to include an arterial and microvascular system. Sacrificial molding with ice allows for the creation of freestanding hierarchal synthetic vessels from a variety of natural or synthetic polymers, with wall thickness determined by dipping time.37 Alternatively, vessel scaffolds can be created using a 3-D printer. These synthetic vessels will be embedded in a poly-vinyl alcohol (PVA) hydrogel that represents soft tissue. A 6% PVA hydrogel mimics normal fatty tissue and will be covered by a 2mm layer of 10% PVA hydrogel to mimic skin.38,39 The effect of soft tissue mechanical properties on the NIVA signal will be investigated through variation in PVA concentration to represent altered levels of edema. A physiological flow pump (Compuflow 1000, Simutec) will be used that contains a database of pre-programmed waveforms and also allows user input of venous waveforms obtained directly from patients. 40% glycerol solution will be used as a blood-mimicking fluid.
27
The closed flow loop will also assist with device testing in the setting of various arrhythmias, which can be programmed using the pump. Atrial fibrillation, the most common arrhythmia in patients with heart failure, is characterized by an irregularly irregular heart rate.
This results in multiple peaks corresponding to f0 and its harmonics (Figure 10). It is unknown at this time whether NIVA can accurately estimate volume status in these patients. The flow loop will assist with determining whether NIVA can consistently differentiate between atrial
fibrillation (or other arrhythmias) and normal sinus rhythm, and whether the NIVA algorithm can be accurately tailored to this setting. After defining the noise floor to identify “true peaks”, examples of power estimation at each frequency for analysis include direct summation of peak amplitudes or calculation of the integral of a gaussian curve fit to the peaks.
Figure 9 Hemodynamic flow loop. Various parameters of the closed flow loop can be altered for benchtop testing of the NIVA device.
28
In conjunction with additional clinical validation studies, these in vivo and in vitro experiments will help ensure the safe and accurate broadening of future clinical applications for the NIVA device.
Figure 10 NIVA signal obtained from patient with atrial fibrillation. Frequency distribution demonstrates multiple peaks corresponding to the pulse rate and its harmonics.
29 REFERENCES
1. Prowle JR, Echeverri JE, Ligabo EV, Ronco C, Bellomo R. Fluid balance and acute kidney injury. Nat Rev Nephrol. 2010;6(2):107-115.
2. Murphy CV, Schramm GE, Doherty JA, et al. The importance of fluid management in acute lung injury secondary to septic shock. Chest. 2009;136(1):102-109.
3. Chakko S, Woska D, Martinez H, et al. Clinical, radiographic, and hemodynamic correlations in chronic congestive heart failure: conflicting results may lead to inappropriate care. Am J Med. 1991;90(3):353-359.
4. Nauta JF, Hummel YM, van der Meer P, Lam CSP, Voors AA, van Melle JP. Correlation with invasive left ventricular filling pressures and prognostic relevance of the
echocardiographic diastolic parameters used in the 2016 ESC heart failure guidelines and in the 2016 ASE/EACVI recommendations: a systematic review in patients with heart failure with preserved ejection fraction. Eur J Heart Fail. 2018;20(9):1303-1311.
5. Grodin JL, Drazner MH, Dupont M, et al. A disproportionate elevation in right ventricular filling pressure, in relation to left ventricular filling pressure, is associated with renal impairment and increased mortality in advanced decompensated heart failure.
Am Heart J. 2015;169(6):806-812.
6. Adamson PB. Pathophysiology of the transition from chronic compensated and acute decompensated heart failure: new insights from continuous monitoring devices. Curr Heart Fail Rep. 2009;6(4):287-292.
30
7. Lichtwarck-Aschoff M, Beale R, Pfeiffer UJ. Central venous pressure, pulmonary artery occlusion pressure, intrathoracic blood volume, and right ventricular end-diastolic volume as indicators of cardiac preload. J Crit Care. 1996;11(4):180-188.
8. Sperry BW, Campbell J, Yanavitski M, Kapadia S, Tang WHW, Hanna M. Peripheral Venous Pressure Measurements in Patients With Acute Decompensated Heart Failure (PVP-HF). Circ Heart Fail. 2017;10(7).
9. De Backer D, Heenen S, Piagnerelli M, Koch M, Vincent JL. Pulse pressure variations to predict fluid responsiveness: influence of tidal volume. Intensive Care Med.
2005;31(4):517-523.
10. Uriel N, Sayer G, Imamura T, et al. Relationship Between Noninvasive Assessment of Lung Fluid Volume and Invasively Measured Cardiac Hemodynamics. J Am Heart Assoc. 2018;7(22):e009175.
11. Maines M, Catanzariti D, Cirrincione C, Valsecchi S, Comisso J, Vergara G.
Intrathoracic impedance and pulmonary wedge pressure for the detection of heart failure deterioration. Europace. 2010;12(5):680-685.
12. Lozano-Nieto A, Turner AA. Effects of orthostatic fluid shifts on bioelectrical impedance measurements. Biomed Instrum Technol. 2001;35(4):249-258.
13. Kauppinen PK, Hyttinen J, Malmivuo JA. Effects of fat resistivity changes on
measurement sensitivity of impedance cardiography determined by a 3D finite element model of the visible human man. Paper presented at: Proceedings of 18th Annual
International Conference of the IEEE Engineering in Medicine and Biology Society1996.
14. Gilotra NA, Tedford RJ, Wittstein IS, et al. Usefulness of Pulse Amplitude Changes During the Valsalva Maneuver Measured Using Finger Photoplethysmography to
31
Identify Elevated Pulmonary Capillary Wedge Pressure in Patients With Heart Failure.
Am J Cardiol. 2017;120(6):966-972.
15. Gilotra NA, Wanamaker BL, Rahim H, et al. Usefulness of Noninvasively Measured Pulse Amplitude Changes During the Valsalva Maneuver to Identify Hospitalized Heart Failure Patients at Risk of 30-Day Heart Failure Events (from the PRESSURE-HF Study). Am J Cardiol. 2020;125(6):916-923.
16. Sharma GV, Woods PA, Lindsey N, et al. Noninvasive monitoring of left ventricular end-diastolic pressure reduces rehospitalization rates in patients hospitalized for heart failure: a randomized controlled trial. J Card Fail. 2011;17(9):718-725.
17. McIntyre KM, Vita JA, Lambrew CT, Freeman J, Loscalzo J. A noninvasive method of predicting pulmonary-capillary wedge pressure. N Engl J Med. 1992;327(24):1715-1720.
18. Sharma GV, Woods PA, Lambrew CT, et al. Evaluation of a noninvasive system for determining left ventricular filling pressure. Arch Intern Med. 2002;162(18):2084-2088.
19. Bartelstone HJ. Role of the veins in venous retunr. Circ Res. 1960;8:1059-1076.
20. Mohrman DE, Heller LJ. Hemodynamic Interactions. In: Cardiovascular Physiology, 9e.
New York, NY: McGraw-Hill Education; 2018.
21. Alian AA, Galante NJ, Stachenfeld NS, Silverman DG, Shelley KH. Impact of lower body negative pressure induced hypovolemia on peripheral venous pressure waveform parameters in healthy volunteers. Physiol Meas. 2014;35(7):1509-1520.
22. Alvis BD, McCallister R, Polcz M, et al. Non-Invasive Venous waveform Analysis (NIVA) for monitoring blood loss in human blood donors and validation in a porcine hemorrhage model. J Clin Anesth. 2020;61:109664.
32
23. Alvis BD, Polcz M, Huston JH, et al. Observational Study of Noninvasive Venous Waveform Analysis to Assess Intracardiac Filling Pressures During Right Heart Catheterization. J Card Fail. 2020;26(2):136-141.
24. Hocking KM, Alvis BD, Baudenbacher F, et al. Peripheral i.v. analysis (PIVA) of venous waveforms for volume assessment in patients undergoing haemodialysis. Br J Anaesth.
2017;119(6):1135-1140.
25. Hocking KM, Sileshi B, Baudenbacher FJ, et al. Peripheral Venous Waveform Analysis for Detecting Hemorrhage and Iatrogenic Volume Overload in a Porcine Model. Shock.
2016;46(4):447-452.
26. Miles M, Alvis BD, Hocking K, et al. Peripheral Intravenous Volume Analysis (PIVA) for Quantitating Volume Overload in Patients Hospitalized With Acute Decompensated Heart Failure-A Pilot Study. J Card Fail. 2018;24(8):525-532.
27. Tibshirani R. Regression Shrinkage and Selection Via the Lasso. 1996;58(1):267-288.
28. Kovacs G, Dumitrescu D, Barner A, et al. Definition, clinical classification and initial diagnosis of pulmonary hypertension: Updated recommendations from the Cologne Consensus Conference 2018. Int J Cardiol. 2018;272S:11-19.
29. Yamamoto K, Nishimura RA, Redfield MM. Assessment of mean left atrial pressure from the left ventricular pressure tracing in patients with cardiomyopathies. Am J Cardiol. 1996;78(1):107-110.
30. Binanay C, Califf RM, Hasselblad V, et al. Evaluation study of congestive heart failure and pulmonary artery catheterization effectiveness: the ESCAPE trial. JAMA.
2005;294(13):1625-1633.
33
31. Yancy CW, Jessup M, Bozkurt B, et al. 2013 ACCF/AHA guideline for the management of heart failure: a report of the American College of Cardiology Foundation/American Heart Association Task Force on Practice Guidelines. J Am Coll Cardiol.
2013;62(16):e147-239.
32. Adamson PB, Abraham WT, Bourge RC, Stevenson LW, Yadav JJJoCF. CardioMEMS heart sensor allows monitoring of pressures to improve outcomes in NYHA class III heart failure patients (CHAMPION) trial: impact of hemodynamic guided care on patients with preserved ejection fraction. 2010;16(11):913.
33. Uhley HN, Leeds SE, Sampson JJ, Friedman M. Role of pulmonary lymphatics in chronic pulmonary edema. Circulation research. 1962;11:966-970.
34. Chase SC, Taylor BJ, Cross TJ, Coffman KE, Olson LJ, Johnson BD. Influence of Thoracic Fluid Compartments on Pulmonary Congestion in Chronic Heart Failure. J Card Fail. 2017;23(9):690-696.
35. Kumar A, Anel R, Bunnell E, et al. Pulmonary artery occlusion pressure and central venous pressure fail to predict ventricular filling volume, cardiac performance, or the response to volume infusion in normal subjects. Crit Care Med. 2004;32(3):691-699.
36. Alvis BD, Polcz M, Miles M, et al. Non-invasive venous waveform analysis (NIVA) for volume assessment in patients undergoing hemodialysis: an observational study. BMC Nephrol. 2020;21(1):194.
37. Wang R, Ozsvar J, Aghaei-Ghareh-Bolagh B, Hiob MA, Mithieux SM, Weiss AS.
Freestanding hierarchical vascular structures engineered from ice. Biomaterials.
2019;192:334-345.
34
38. Akki RS, Arunachalam K. Breast tissue phantoms to assist compression study for cancer detection using microwave radiometry. Conf Proc IEEE Eng Med Biol Soc.
2014;2014:1119-1122.
39. Bader DL, Bowker P. Mechanical characteristics of skin and underlying tissues in vivo.
Biomaterials. 1983;4(4):305-308.
35 APPENDIX
Appendix A: C++ Script for AlgorithmRunner.exe
/**
* @file: main.cpp * * @date: Sep 5, 2018
* @author: Volumetrix, Jonathan Whitfield *
* @copyright Copyright (c) 2018 VoluMetrix LLC * * All Rights Reserved.
* * All information contained herein is, and remains the * property of VoluMetrix LLC. and its suppliers, if any.
* The intellectual and technical concepts contained herein are * proprietary to VoluMetrix LLC. and its suppliers and may * be covered by U.S. and Foreign Patents, patents in process, * and are protected by trade secret or copyright law.
* Dissemination of this information or reproduction of this material * is strictly forbidden unless prior written permission is obtained * from VoluMetrix LLC.
* */
#include <string>
#include <vector>
#include <iostream>
#include <istream>
#include <fstream>
#include <iterator>
#include <algorithm>
#include "dirent.h"
#include <map>
#include <string.h>
#include <sys/types.h>
#include <sys/stat.h>
#include "algorithm.hpp"
#include "fir.hpp"
#include "ppg_detection.hpp"
typedef struct {
std::string absolutePath;
36
std::string fileName;
}inputFile_t;
typedef struct { inputFile_t niva;
inputFile_t ppg;
}nivaPpgFilePair_t;
/** * @ingroup algorithm-host * @{
*/
typedef enum { TXT = 0, AFE, RAW, RENE, OTHER, }FileType_t;
float getStd(float * data, size_t len, float mean) { float sum = 0.0f;
/* sanity check */
if (len < 1) { return NAN;
}
/* sum sample minus mean squared */
for (int i = 0; i < (int)len; i++) { float temp = data[i] - mean;
sum += temp * temp;
}
/* scale ny number of samples */
sum /= (float)len;
/* square root for standard deviation */
return (float)std::sqrt(sum);
}
static constexpr float PPG_SCALE = 5.72204589843750e-07;
static constexpr float NIVA_SCALE = 2.88486480712891e-07; //!< (2.42 / 2^23) /**
* @brief Print help for the program to the console */
void printHelp() {
std::cout << std::endl;
std::cout << "Usage: algorithmRunner <path> [-e <file extension>] [-o <path>] [-s <value>]"
<< std::endl;
std::cout << "Must include input path" << std::endl << std::endl;
std::cout << "options: " << std::endl;
std::cout << "\t-e\tSupply file extension, program will find analyze all files found in -- if omitted '.txt' is used -- '.rene' for niva/ppg analysis" << std::endl;
std::cout << "\t-o\tSupply output path for analysis file to be stored -- if omitted input path is used" << std::endl;
std::cout << "\t-s\tSupply start sample, number of lines to skip at the beginning of the file -- if omitted 25 is used" << std::endl;
std::cout << "\t-x\t1 for extended algorithm output, 0 for normal output" << std::endl;
std::cout << "\t-d\t1 to enable taking the derivative of the input signal before analysis, 0 for normal input" << std::endl;
} /**
37
* @brief Parse input arguments for a * @param argc: argument count * @param argv: argument array
* @param option: option to search for * @return empty string on failure */
const std::string getOption(int argc, char * argv[], const std::string option) {
/* populate options */
std::vector<std::string> inputs;
for(int i = 1; i < argc; i++) {
inputs.push_back(std::string(argv[i]));
}
std::vector<std::string>::const_iterator itr;
itr = std::find(inputs.begin(), inputs.end(), option);
/* check that we found the option and an option parameter exists */
if( itr != inputs.end() && (itr + 1) != inputs.end() ) { /* return option */
return *(++itr);
}
static const std::string empty("");
return empty;
}
/** * @brief Check if path is an actual directory * @param path: path to check
* @return: non-zero if path is not a directorys */
int directoryExists(const std::string& path) { DIR * dir = opendir(path.c_str());
if(dir != nullptr) { return 0;
}
return -1;
}
/** * @brief Get list of files in directory of a given file type * @param path: path to directory
* @param extension: file extension to filter by * @param files: output list of files
* @return number of files found in directory */
int getFilesForDirectory(const std::string& path, const std::string& extension, std::vector<std::string>& files) {
DIR * dir = opendir(path.c_str());
struct dirent * d;
while( (d = readdir(dir)) != nullptr) { std::string fName = d->d_name;
std::size_t found = fName.find(extension);
if(found != std::string::npos) { files.push_back(fName);
} }
closedir(dir);
return files.size();
}
int getFileSize(const std::string &fileName) {
std::ifstream file(fileName.c_str(), std::ifstream::in | std::ifstream::binary);
if(!file.is_open()) {
38
return -1;
}
file.seekg(0, std::ios::end);
int fileSize = file.tellg();
file.close();
return fileSize;
}
/** * @brief Get list of files in directory of a given file type * @param path: path to directory
* @param extension: file extension to filter by * @param files: output list of files
* @return number of files found in directory
*/ int getFilesForDirectory(const std::string& path, const std::string& extension, std::vector<inputFile_t>& files) {
DIR * dir = opendir(path.c_str());
if(dir == nullptr) { return -1;
}
struct dirent * d;
while( (d = readdir(dir)) != nullptr) { std::string fName = d->d_name;
std::size_t found = fName.find(extension);
if(found != std::string::npos) { inputFile_t file;
file.absolutePath = std::string(path);
if(file.absolutePath.back() != '/') { file.absolutePath.append("/");
}
file.absolutePath.append(fName);
file.fileName = fName;
files.push_back(file);
} else if (directoryExists(fName)) {
std::string downPath = std::string(path);
if(downPath.back() != '/') { downPath.append("/");
}
downPath.append(fName);
getFilesForDirectory(downPath, extension, files);
} }
closedir(dir);
return files.size();
}
int getRawFilesForDirectory(const std::string& path, std::vector<inputFile_t>& files) { DIR * dir = opendir(path.c_str());
if(dir == nullptr) { return -1;
}
struct dirent * d;
while( (d = readdir(dir)) != nullptr) { std::string fName = d->d_name;
std::string fPath = ((std::string)path).append(fName);
/* No file extension */
std::size_t found = fName.find(".");
if(found == std::string::npos && (getFileSize(fPath) != 0) ) { inputFile_t file;
file.absolutePath = std::string(path);
if(file.absolutePath.back() != '/') { file.absolutePath.append("/");
}
39
file.absolutePath.append(fName);
file.fileName = fName;
files.push_back(file);
} else if (directoryExists(fName)) {
std::string downPath = std::string(path);
if(downPath.back() != '/') { downPath.append("/");
}
downPath.append(fName);
getRawFilesForDirectory(downPath, files);
} }
closedir(dir);
return files.size();
}
int getReneFilesForDirectory(const std::string& path, std::vector<nivaPpgFilePair_t>& files) { DIR * dir = opendir(path.c_str());
if(dir == nullptr) { return -1;
}
struct dirent * d;
while( (d = readdir(dir)) != nullptr) { std::string fName = d->d_name;
std::string fPath = ((std::string)path).append(fName);
/* No file extension */
std::size_t found = fName.find(".niva");
if(found != std::string::npos && (getFileSize(fPath) != 0) ) { /* Extract NIVA file */
inputFile_t nivaFile;
nivaFile.absolutePath = std::string(path);
if(nivaFile.absolutePath.back() != '/') { nivaFile.absolutePath.append("/");
}
nivaFile.absolutePath.append(fName);
nivaFile.fileName = fName;
inputFile_t ppgFile;
ppgFile.absolutePath = std::string(path);
if(ppgFile.absolutePath.back() != '/') { ppgFile.absolutePath.append("/");
}
std::string ppgName = fName.substr(0, fName.length() - 4);
ppgName.append("ppg");
ppgFile.absolutePath.append(ppgName);
ppgFile.fileName = ppgName;
nivaPpgFilePair_t filePair = {nivaFile, ppgFile};
files.push_back(filePair);
} else if (directoryExists(fName)) {
std::string downPath = std::string(path);
if(downPath.back() != '/') { downPath.append("/");
}
downPath.append(fName);
getReneFilesForDirectory(downPath, files);
} }
closedir(dir);
return files.size();
}