IESE Cities in Motion Index
2022
IESE Cities in Motion Index
2022
We gratefully acknowledge the financial support of the Agencia Estatal de Investigación (AEI) of the Ministry of Economy and Competitiveness—ECO2016-79894-R (MINECO/FEDER), Ministry of Science and Innovation PID2019-104679RB-I00, the Schneider-Electric Sustainability and Business Strategy Chair, the Carl Schroeder Chair in Strategic Management and the IESE’s High Impact Projects initiative (2017/2018).
Foreword 05 About Us 08
Working Team 08
Introduction: The Need for a Global Vision 09
Our Model: Cities in Motion—Conceptual Framework, Definitions and Indicators 11
Limitations of the Indicators 23
Geographic Coverage 23
Cities in Motion: Ranking 26
Cities in Motion: Ranking by Dimension 28
Cities in Motion: Regional Distribution 40
Cities in Motion: Regional Ranking 43
Stand-Out Cities 51
Cities in Motion: Evolution 64
Cities in Motion Versus Other Indexes 67
Cities in Motion: City Ranking by Population Size 68
Cities in Motion: Analysis of Dimensions in Pairs 72
Cities in Motion: A Dynamic Analysis 79
Recommendations and Conclusions 81
Appendix 1. Indicators 83
Appendix 2. Graphical Analysis of the Profiles of the 183 Cities 90
CONTENTS
Foreword
We are pleased to present the eighth edition of the Cities in Motion Index (CIMI) for the year 2022. Last year, for the first time in our history, we were unable to publish our ranking. This was because one of our main data providers decided to change its data collection methodology. Combined with the effects of the COVID-19 pandemic, this change made it impossible for us to evaluate the new information satisfactorily.
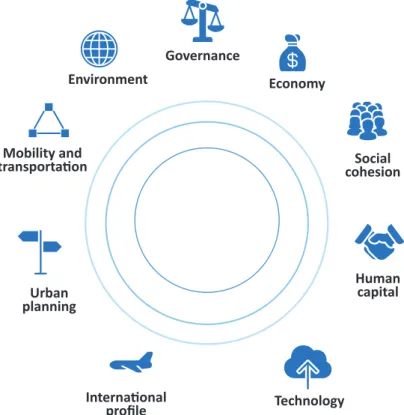
With these issues now resolved, we present this new edition of the CIMI, which once again aims to evaluate a selection of cities in relation to what we consider nine key dimensions: economy, human capital, technology, environment, international profile, social cohesion, mobility and transportation, governance and urban planning.
In addition to long-standing challenges facing cities, including aging populations, heterogeneous social demands, the digital divide, and environmental problems (energy inefficiency, waste management and pollution), there are now new challenges arising from the recent pandemic and the economic and social consequences of the war in Ukraine (unemployment, inflation, segregation, migration and poverty). The scope and magnitude of these issues pose new challenges for the sustainability of cities. In this context, the concept of urban resilience (i.e., the ability of cities to overcome adverse circumstances) seems more important than ever.
To meet these challenges, all the world’s cities need to undertake a process of strategic review and consider what kind of cities they want to be, what their priorities will be going forward, and where they currently stand. Our index aims to offer a platform for comprehensive initial diagnosis of the cities considered and, through comparative analysis, serve as a first point of reference for other cities.
As in previous editions, we have taken on the challenge of creating an index of cities that is superior to existing ones—one that is objective, broad in its scope and coverage, and guided by the principles of conceptual relevance and statistical rigor. Previous editions of the index had a major media impact and were very well received in various forums related to city management. This positive response has encouraged us to continue working to improve it. In our presentations, we receive many recommendations and suggestions, and we have tried to take such input into account in this new edition.
The most significant changes in this year’s index include the following:
• Greater geographic coverage. We have increased the number of cities included in the ranking by nine (5%) with respect to the 2020 edition. The CIMI now covers a total of 183 cities (85 of which are capitals), and 92 countries are represented. New cities in Africa, Oceania, the Middle East and the Americas have been included. Thanks to this effort, the CIMI is now one of the indexes offering the widest geographic coverage.
• More indicators. We have increased the number of indicators that measure the nine relevant dimensions of a city by 11%, to a total of 112. The new indicators are intended to provide a more precise assessment of the situation of the cities included in the CIMI.
• New indicators that reflect the changes cities are undergoing. New indicators included in this edition include artificial intelligence projects, electric vehicle charging stations, and climate vulnerability. These variables are intended to capture advances and challenges facing 21st-century cities.
• Combination of objective and subjective indicators. In making the calculations for our index, we have used quantitative variables that capture both objective and subjective data. This approach enables us to offer a broader vision of cities that takes into account the views of their citizens.
Unlike other editions, where changes of position were due to variations in multiple dimensions, in this edition, the reordering of positions is explained largely by the economy dimension. The pandemic has had a significant impact on both GDP levels and GDP growth prospects and is the main factor behind changes in the rank of individual cities. A case in point is Dublin, which was one of the few cities to experience economic growth in 2020 and is projected to achieve double-digit growth this year. This explains why the Irish capital moved up from 40th place in 2019 to 33rd in 2020 and 18th in 2021.
In light of this factor—and the introduction of new cities and variables, as well as methodological changes—we remind the reader that the rankings for different years are not directly comparable, given that these factors result in variations that do not necessarily reflect the trajectory of cities over time. In order to study the evolution of individual cities, in each edition, we analyze the trend for each one by calculating the index for the last three years, which enables us to make more meaningful comparisons.
It is also important to bear in mind limitations related to the data used. One problem is that some indicators are only available at the country level and must be considered approximate at the city level. In addition, there are variables that may underestimate the impact of a given dimension due to regulatory issues or specific factors that come into play in a particular city. The variables are intended as an approximation of the reality of cities; in no case do they fully capture their multidimensionality and complexity. Caution should therefore be exercised when interpreting the results of this report.
This year, we will once again make the CIMI Calculator available on our website. The calculator allows users to enter the data for any city (for the variables included in this index) and shows the position the city would occupy in the ranking based on this input. This practical tool is useful both for cities that are already included in the ranking and wish to see what changes occur with more up-to-date variable values and for those that are not included in the CIMI but would like to see where they would rank. The new version of the calculator will be available shortly on our website.
We would also like to inform our readers that the work of the IESE Cities in Motion platform has not been limited to ranking cities. We have continued to publish our series of mini-books in English, in which we identify best practices in each dimension of the IESE Cities in Motion model. This year we have published two new volumes on urban technology and others on city governance, in addition to the volumes on the environment, mobility and transportation, economics, social cohesion and international profile. All these books are available on Amazon. The collection will soon be expanded with a volume on best practices in urban planning.
We are also continuing our work on a series of academic articles. This year we have published a study in the prestigious international academic journal Research Policy, where we evaluate the conditions under which digital platforms can successfully deliver their stakeholder value propositions in cities. We have also published a study in the journal Business Research Quarterly, in which we discuss the importance of smart governance in achieving the UN’s Sustainable Development Goals (SDGs) in 128 cities. Finally, we have published the results of another study on present and future mobility in Europe in the journal Papeles de Economía Española, in which we discuss challenges and possible courses of action as regards European transportation and mobility. These studies are in addition to those previously published in prestigious international journals such as Strategy Science, Academy of Management Discoveries, Academy of Management Journal, California Management Review and Harvard Deusto Business Review.
We also invite readers to browse our collection of case studies on cities at the IESE Insight Knowledge Portal (www.iesepublishing.com). This teaching material has enabled us to strengthen our courses related to cities in both IESE programs and those delivered in collaboration with other schools and institutions.
We hope that this report will be useful for mayors, city managers, and all stakeholders whose aim is to improve the quality of life of citizens, as well as to companies involved in urban solutions, given that internationalization strategies are increasingly defined at the city rather than the country level.
We are convinced that we can live in better cities, but this will only be possible if all social actors—
the public sector, private companies, civic organizations and academic institutions—contribute and collaborate to achieve this shared goal. This report is our contribution to that effort.
THE AUTHORS
Prof. Pascual Berrone
Holder of the Schneider Electric Sustainability and Business Strategy Chair
Academic Co-Director of IESE Cities in Motion
Prof. Joan Enric Ricart Holder of the Carl Schroeder Chair of Strategic
Management
Academic Co-Director of IESE Cities in Motion
ACADEMIC TEAM
Professors
Pascual Berrone
Holder of the Schneider Electric Sustainability and Business Strategy Chair, IESE Business School Joan Enric Ricart
Holder of the Carl Schroeder Chair of Strategic Management, IESE Business School
Research Collaborators
Esther Brito
Research assistant at IESE Business School
TECHNICAL TEAM
David Giuliodori
Consultant at Econfocus Consulting and professor of Statistics 2 at the National University of Córdoba (Argentina)
Andrea Giuliodori
Professor of Statistics at the Institute for Stock Market Studies (IEB)
Design: IESE Business School
About Us
Working Team
IESE Cities in Motion is a research platform launched jointly by the Center for Globalization and Strat- egy and IESE Business School’s Department of Strategy.
The initiative connects a global network of experts on cities and specialized private companies with local governments around the world. Our goal is to promote changes at the local level and develop valuable ideas and innovative tools to make cities more sustainable and smarter.
The platform’s mission is to promote the Cities in Motion model, based on an innovative approach to city governance and a new urban model for the 21st century that revolves around four key factors:
sustainable ecosystem, innovative activities, equity among citizens, and connected territory.
Introduction:
The Need for a Global Vision
Today more than ever, cities need to engage in strategic planning. Only by taking this step will they be able to ex- plore pathways to innovation and prioritize the issues that are most important for their future.
This process should be participatory, flexible and focused on a key objective: defining a sustainable action plan to make the city unique and raise its profile. Just as no two compa- nies can have the same recipe for success, each city must seek to develop its own model based on a series of common ideas and considerations.
Experience shows that large cities should avoid short-ter- mism, broaden their field of view, and make more frequent use of innovation to improve the efficiency and sustainabil- ity of the services they provide. They should also promote communication and get citizens and businesses engaged in their projects.
In the context of COVID-19, these points have become even more relevant. It is now that we can see how prepared cit- ies really are to face a crisis that is disrupting their stability in many of its dimensions. The time has come to practice smart governance that takes account of all relevant factors and social actors and that is underpinned by a broad vision.
In fact, over the last few decades, various national and in- ternational organizations have produced studies that focus on defining, creating and applying indicators with a range of aims, but with the main goal of helping to diagnose the state of cities. The definition of indicators and the process through which they are created are determined by the char-
techniques that best fit the theoretical model used and the available data, and the preferences of the analysts involved.
We now have a large number of “urban” indicators, but many of them are not standardized, consistent or useful for comparing cities. In fact, although numerous attempts have been made to develop city indicators on a national, region- al or international scale, few have been sustainable in the medium term. This is because they were usually created specifically for studies intended to meet the specific infor- mation needs of certain entities whose lifespan depended on how long their funding lasted. In other cases, the system of indicators depended on political will, linked to particular circumstances, and was abandoned when political priorities or the authorities themselves changed. As for the indicators developed by international organizations, it is true that they aim to provide the consistency and robustness needed to compare cities, but most tend to be biased or focused on a particular area (e.g., technology, the economy or the en- vironment).
In this context, the IESE Cities in Motion Index (CIMI) has been designed with the aim of constructing a “next-level”
indicator (in terms of its completeness, properties, compa- rability and quality, and the objectivity of the information included) that makes it possible to measure the future sus- tainability of the world’s leading cities and the quality of life of their inhabitants.
The CIMI aims to help citizens and governments understand the performance of cities in nine key dimensions: human
ment, mobility and transportation, urban planning, inter- national profile and technology. All of the indicators come together around a strategic purpose, leading to a different kind of economic and social development that entails the creation of a global city and the promotion of entrepreneur- ship, innovation and social justice, among other outcomes.
Each city is unique and inimitable. Each has its own needs and opportunities. Cities must therefore design their own plan, set their own priorities, and be flexible enough to adapt to changes.
Smart cities generate numerous business opportunities and possibilities for public-private sector collaboration. All stake- holders have a role to play, so a networked ecosystem that involves all of them—citizens, organizations, institutions, governments, universities, companies, experts, research centers and non-profit entities—must be developed.
Working within a network has certain advantages. Such an approach makes it possible to better identify the needs of a city and its residents, set common goals, ensure ongoing communication among participants, increase learning op- portunities, strengthen transparency, and apply more flex- ible public policies.
Private enterprise also has much to gain from a networked system of this kind, which enables private actors to engage in long-term collaboration with public authorities, access new business opportunities, better understand the needs of the local ecosystem, increase their international visibility, and attract talent.
Thanks to its technical expertise and experience in project management, private enterprise (in collaboration with uni- versities and other institutions) is ideally suited to lead and carry out smart city projects. Private-sector actors can help public-private entities achieve greater efficiency and signif- icant savings.
Finally, we must not overlook the key role that the human factor plays in the development of cities. In the absence of an active, participatory society, any strategy, however smart and comprehensive, will be doomed to failure. Beyond tech- nological and economic development, it is citizens who hold the key to making cities progress from being “smart” to be- ing “wise.” This is precisely the goal that every city should pursue—to get local residents and leaders to deploy all their talents in the pursuit of progress.
To help cities identify effective solutions, we have created an index that integrates nine dimensions into a single indi- cator and covers 183 cities around the world. Thanks to its broad, integrated vision, the CIMI makes it possible to iden- tify the strengths and weaknesses of each city.
9 DIMENSIONS 92 COUNTRIES 183 CITIES 85 CAPITALS 114 INDICATORS
Our Model: Cities in Motion—Conceptual Framework,
Definitions and Indicators
Our platform proposes a conceptual model based on the study of a large number of success stories and in-depth interviews with city leaders, business people, academics and experts involved in city development.
The model proposes a set of steps that span diagnosis of the existing situation, the development of a strategy, and its subsequent implementation. The first step in making a good diagnosis is to analyze the situation with respect to the key dimensions. In the following sections, we will describe each of these dimensions and the indicators used to calculate the CIMI.
Human capital
The main objective of any city should be to improve its human capital. A city with smart governance must be capable of attracting and retaining talent, creating plans to improve education, and fostering creativity and research.
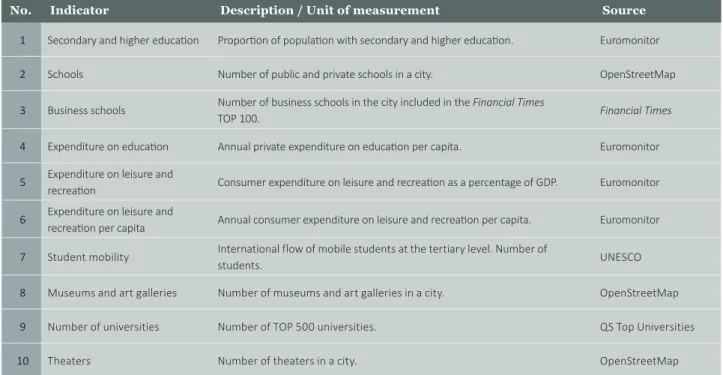
Table 1 shows the indicators used for the human capital dimension, a description of each one, the units of measurement, and the information sources used.
Although human capital includes factors that make it broader than what can be measured using these indicators, there is an international consensus that level of education and access to culture are essential components for measuring it. One of the pillars of human development is this capital. Moreover, given that the Human Development Index (HDI), published annually by the United Nations Development Program (UNDP), includes education and culture as dimensions, there is a sound basis for taking these indicators as explanatory of differences in a city’s human capital.
To define this dimension, the CIMI includes the 10 variables listed in Table 1. Most of the variables are incorporated into the index with a positive sign due to their contribution to the development of human capital. Private expenditure on education per capita is an exception.
To measure access to culture, the number of museums, art galleries and theaters, as well as consumer expenditure on leisure and recreation, are considered. These indicators reflect a city’s commitment to culture and human capital.
Cities that are considered creative and dynamic on a global scale typically have museums and art galleries that are open to the public, offer visits to art collections, and take action to conserve such collections. The presence of cultural and recreational offerings in a city increases spending on these activities by the population.
Finally, expenditure on education per capita represents what each citizen pays to attain an adequate level of education. A high figure indicates that state expenditure on education is insufficient, and that citizens must therefore bear this cost to attain an adequate education. That is why this variable is included with a negative sign.
Social cohesion
In recent decades, rapid urbanization has led to segregation of social groups, with little or no social mixing. This pattern of urbanization has negative impacts on urban areas, leading to social fragmentation in cities.
This phenomenon is more evident in urban settings in developing countries, where the division built into the spatial configuration of cities is immediately apparent.
However, it is also becoming a major challenge in urban areas of developed countries, where social and economic
Social cohesion
Human capital Environment
Urban planning Mobility and transportation
Economy Governance
International
profile Technology
With the COVID-19 pandemic, these differences have become even more pronounced and have particularly affected the most vulnerable people in urban areas.
Many cities measure their intelligence only in terms of technological advances. However, the number of cities that include social cohesion as a key element for their development is growing. In their smart city strategies, cities such as New York and Tokyo have included concrete actions that allow them to be inclusive, taking into account the diversity of citizens and the needs of each social group.
Social cohesion is a sociological dimension of cities that can be defined as “the degree of consensus of the members of a social group” or “the perception of belonging to a common project or situation.” It is a measure of the intensity of social interaction within a group.
In the urban context, social cohesion refers to the level of social harmony between groups of people who live in the same city but differ in terms of their income, culture, age or occupations. Concern for a city’s social environment requires that we consider factors such as immigration, community development, care for the elderly, health system efficiency, and public safety and inclusion. In the age of COVID-19, particular emphasis is placed on evaluating and measuring the efficiency and universality of health systems, and the hope is that the health crisis has served to better understand the importance of these systems and strengthen them.
The presence of various groups in the same space, and
sustainable urban system. In this context, social cohesion state in which citizens and the government have a shared vision of a model of society based on social justice, the primacy of the rule of law, and social solidarity. This underscores the importance of policies that promote and strengthen social cohesion based on democratic values.
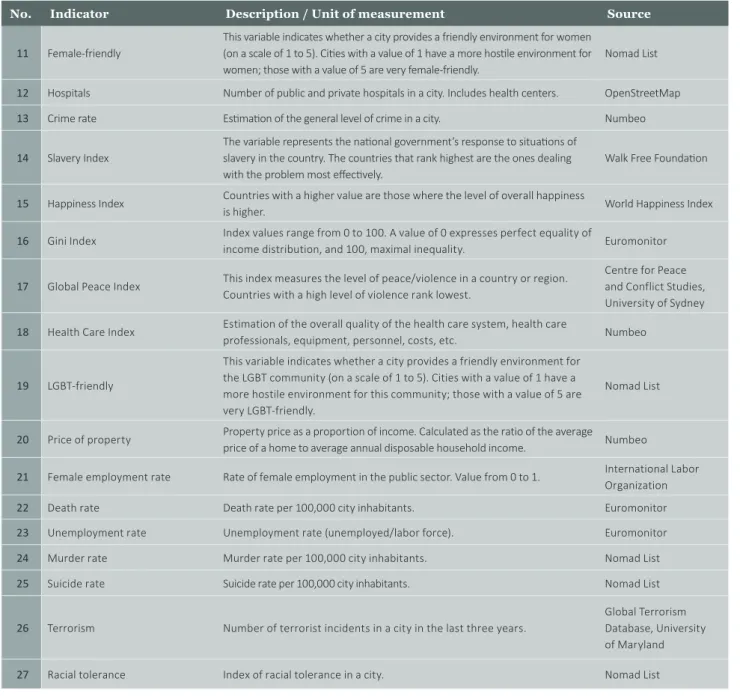
Table 2 shows the indicators selected to analyze this dimension, a description of each one, the units of measurement, and the information sources used. The selected indicators are intended to incorporate all the sociological sub-dimensions of social cohesion, bearing in mind the variables available.
Within the group of variables used, death rate per 100,000 inhabitants and crime rate are both incorporated with a negative sign when this dimension is generated. The Health Care Index and the number of hospitals (public and private) and health centers in a city are added with a positive sign, given that access and coverage provided by basic social services contribute to strengthening social cohesion.
Employment is fundamental to any society. Indeed, history shows that its scarcity can break the implicit consensus or social contract. The unemployment rate is therefore incorporated with a negative sign in the social cohesion dimension. The rate of female employment in the public sector is incorporated with a positive sign, given that it is an indicator of gender equality in access to government jobs.
The Gini Index is calculated based on the Gini coefficient and measures social inequality. A value of 0 expresses
No. Indicator Description / Unit of measurement Source
1 Secondary and higher education Proportion of population with secondary and higher education. Euromonitor
2 Schools Number of public and private schools in a city. OpenStreetMap
3 Business schools Number of business schools in the city included in the Financial Times
TOP 100. Financial Times
4 Expenditure on education Annual private expenditure on education per capita. Euromonitor 5 Expenditure on leisure and
recreation Consumer expenditure on leisure and recreation as a percentage of GDP. Euromonitor 6 Expenditure on leisure and
recreation per capita Annual consumer expenditure on leisure and recreation per capita. Euromonitor 7 Student mobility International flow of mobile students at the tertiary level. Number of
students. UNESCO
8 Museums and art galleries Number of museums and art galleries in a city. OpenStreetMap
9 Number of universities Number of TOP 500 universities. QS Top Universities
10 Theaters Number of theaters in a city. OpenStreetMap
Table 1. Human Capital Indicators
the same income); a value of 100 expresses maximal inequality (one person has all the income and all the others have none). This indicator is included in the dimension with a negative sign since a higher index value has a negative effect on social cohesion in a city.
The price of property as a percentage of income is also negatively related to the CIMI, given that as the proportion of income that must be spent to buy a property increases, the incentives to belong to the society of a given city decrease.
As for happiness, it is increasingly seen as an appropriate measure of social progress and has become a goal of government policy. According to the World Happiness Report, people say they are happy if they have a stable job and good health, and when wealth is more evenly distributed within the country or city where they live. To represent this level of satisfaction, the Happiness Index is
positive sign since countries that are “happier” (i.e., with high values in the index) are those that pay particular attention to freedom, employment, health, income and good governance. Therefore, the happiness of a country or a city is also likely to be reflected in greater social harmony.
Slavery is considered a crime. The proportion of people in slavery in a country is therefore incorporated into the ranking with a negative sign, given that slavery does not contribute to the development of a just and socially cohesive city.
The terrorism variable, which reflects the number of terrorist incidents that have occurred in a city in the last three years, is included with a negative sign as such incidents represent a threat to social peace in a city.
The female-friendly variable is intended to measure the degree to which cities are spaces where women can
No. Indicator Description / Unit of measurement Source
11 Female-friendly
This variable indicates whether a city provides a friendly environment for women (on a scale of 1 to 5). Cities with a value of 1 have a more hostile environment for women; those with a value of 5 are very female-friendly.
Nomad List 12 Hospitals Number of public and private hospitals in a city. Includes health centers. OpenStreetMap
13 Crime rate Estimation of the general level of crime in a city. Numbeo
14 Slavery Index
The variable represents the national government’s response to situations of slavery in the country. The countries that rank highest are the ones dealing with the problem most effectively.
Walk Free Foundation 15 Happiness Index Countries with a higher value are those where the level of overall happiness
is higher. World Happiness Index
16 Gini Index Index values range from 0 to 100. A value of 0 expresses perfect equality of
income distribution, and 100, maximal inequality. Euromonitor 17 Global Peace Index This index measures the level of peace/violence in a country or region.
Countries with a high level of violence rank lowest.
Centre for Peace and Conflict Studies, University of Sydney 18 Health Care Index Estimation of the overall quality of the health care system, health care
professionals, equipment, personnel, costs, etc. Numbeo
19 LGBT-friendly
This variable indicates whether a city provides a friendly environment for the LGBT community (on a scale of 1 to 5). Cities with a value of 1 have a more hostile environment for this community; those with a value of 5 are very LGBT-friendly.
Nomad List
20 Price of property Property price as a proportion of income. Calculated as the ratio of the average
price of a home to average annual disposable household income. Numbeo
21 Female employment rate Rate of female employment in the public sector. Value from 0 to 1. International Labor Organization
22 Death rate Death rate per 100,000 city inhabitants. Euromonitor
23 Unemployment rate Unemployment rate (unemployed/labor force). Euromonitor
24 Murder rate Murder rate per 100,000 city inhabitants. Nomad List
25 Suicide rate Suicide rate per 100,000 city inhabitants. Nomad List
26 Terrorism Number of terrorist incidents in a city in the last three years.
Global Terrorism Database, University of Maryland
27 Racial tolerance Index of racial tolerance in a city. Nomad List
Table 2. Social Cohesion Indicators
are assigned to categories, scored from 1 to 5, where the highest score corresponds to the cities that are most female- friendly. This variable is therefore included in the index with a positive sign.
The variables suicide rate and murder rate are included in the index with a negative sign to reflect their impact on this dimension. The higher the murder rate, the more insecure a city is; and the higher the suicide rate, the less attractive it is to live in.
This year, two new variables have been added: LGBT- friendly and racial tolerance. These variables represent how welcoming a city is to diversity. Both are incorporated with a positive sign. In each case, the higher the value, the greater the level of tolerance.
Economy
This dimension includes all elements that support the economic development of a territory: local economic development plans, transition plans, strategic industrial plans, cluster development, innovation and entrepreneurial initiatives.
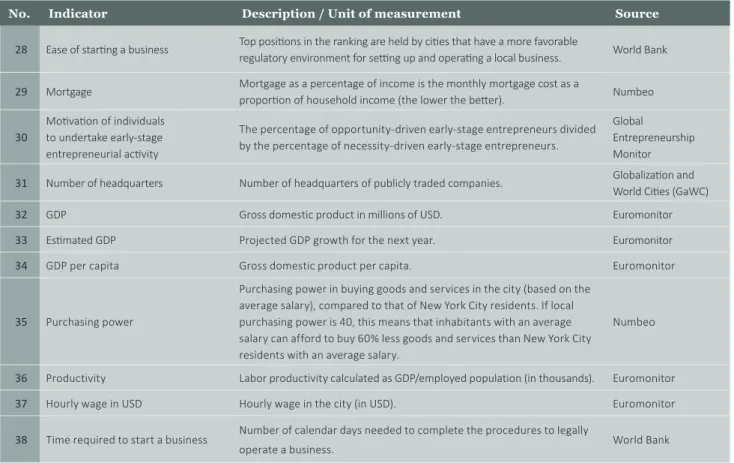
Table 3 shows the indicators used to represent a city’s performance in this dimension, a brief description of each one, their units of measurement, and the information sources used.
The CIMI aims to measure, via multiple dimensions, the future sustainability of the world’s major cities and the quality of life of their inhabitants, and real GDP is a measure of a city’s economic power and the income of its inhabitants. In fact, in numerous studies, GDP is considered the only (or most important) measure of the performance of a city or country. However, in this report it is not considered the sole or most significant measure, but rather one more indicator for one of the nine dimensions of the CIMI. It is therefore assigned a weight similar to that of other indicators. If a city with a high or relatively high GDP does not perform well on other indicators, it may not hold one of the top positions in the ranking. Thus, a city that is highly productive but has problems related to transportation, inequality, weak public finances, or a production process that uses polluting technology will probably not hold one of the top positions in the ranking.
The variable projected annual GDP growth serves as a measure of a city’s future progress.
Labor productivity is a measure of the strength, efficiency and technological level of the production system. As regards local and international competitiveness, productivity will naturally have an impact on real wages, capital income and business profits (which is why it is very important to consider this factor in the economy dimension: different productivity levels can explain differences in the quality of life of workers). Labor productivity will also affect the sustainability of the production system over time.
No. Indicator Description / Unit of measurement Source
28 Ease of starting a business Top positions in the ranking are held by cities that have a more favorable
regulatory environment for setting up and operating a local business. World Bank 29 Mortgage Mortgage as a percentage of income is the monthly mortgage cost as a
proportion of household income (the lower the better). Numbeo 30
Motivation of individuals to undertake early-stage entrepreneurial activity
The percentage of opportunity-driven early-stage entrepreneurs divided by the percentage of necessity-driven early-stage entrepreneurs.
Global
Entrepreneurship Monitor 31 Number of headquarters Number of headquarters of publicly traded companies. Globalization and
World Cities (GaWC)
32 GDP Gross domestic product in millions of USD. Euromonitor
33 Estimated GDP Projected GDP growth for the next year. Euromonitor
34 GDP per capita Gross domestic product per capita. Euromonitor
35 Purchasing power
Purchasing power in buying goods and services in the city (based on the average salary), compared to that of New York City residents. If local purchasing power is 40, this means that inhabitants with an average salary can afford to buy 60% less goods and services than New York City residents with an average salary.
Numbeo
36 Productivity Labor productivity calculated as GDP/employed population (in thousands). Euromonitor
37 Hourly wage in USD Hourly wage in the city (in USD). Euromonitor
Number of calendar days needed to complete the procedures to legally
Table 3. Economy Indicators
Other indicators selected to represent this dimension enable us to measure aspects of a city’s business landscape. These include the number of headquarters of publicly traded companies; the entrepreneurial capacity and opportunities available to inhabitants, represented by the percentage of entrepreneurs who launch their activity due to a personal motivation to improve their lives; the time required to start a business; and the ease of setting up a business (in terms of regulatory requirements). These indicators measure a city’s capacity for sustainability over time and its potential to improve the quality of life of its inhabitants. The time required to start a business and the ease of starting a business are incorporated into the economy dimension with a negative sign given that lower values indicate that it is easier to start a business. The number of headquarters of publicly traded companies, the entrepreneurial capacity and opportunities available to a city’s inhabitants, and the number of entrepreneurs all have a positive bearing on this dimension; high values for these indicators point to a city’s economic dynamism and the ease of setting up and running new businesses.
The mortgage as a percentage of household income variable is incorporated to supplement the information captured by the private property price variable. It is intended to measure how affordable a 20-year mortgage (set at this term for the purposes on this report) is for a middle-income family. The higher the percentage of household income that goes to mortgage payments, the worse a family’s financial situation will be. The variable is therefore incorporated with a negative sign.
Finally, the variables hourly wage and purchasing power in buying goods and services in the city (compared to the purchasing power of New York City residents) are incorporated with a positive sign as higher values for these indicators reflect a better employment situation.
Governance
“Governance” is the term commonly used to refer to the effectiveness, quality and proper orientation of state intervention. Given that citizens have a central role to play in solving all the challenges cities face, factors such as the level of citizen participation, the ability of authorities to engage business leaders and local actors, and implementation of e-government plans must be considered. This dimension also encompasses all actions aimed at improving the efficiency of public administration, including the design of new organizational and management models. In this area, significant opportunities open up for private initiative, which can deliver greater efficiency.
In this study, we consider governance as highly correlated with the state of a city or country’s public finances. Public accounts have a very significant impact on the quality of life of the population and the sustainability of a city as they determine the level of present and future taxes to be paid by citizens and the production system. They also affect expected growth of the general price level, scope for public investment in basic social infrastructure, and incentives for private investment. Moreover, if the state needs financing, it will compete with the private sector for funds available in the financial system, which will affect investment.
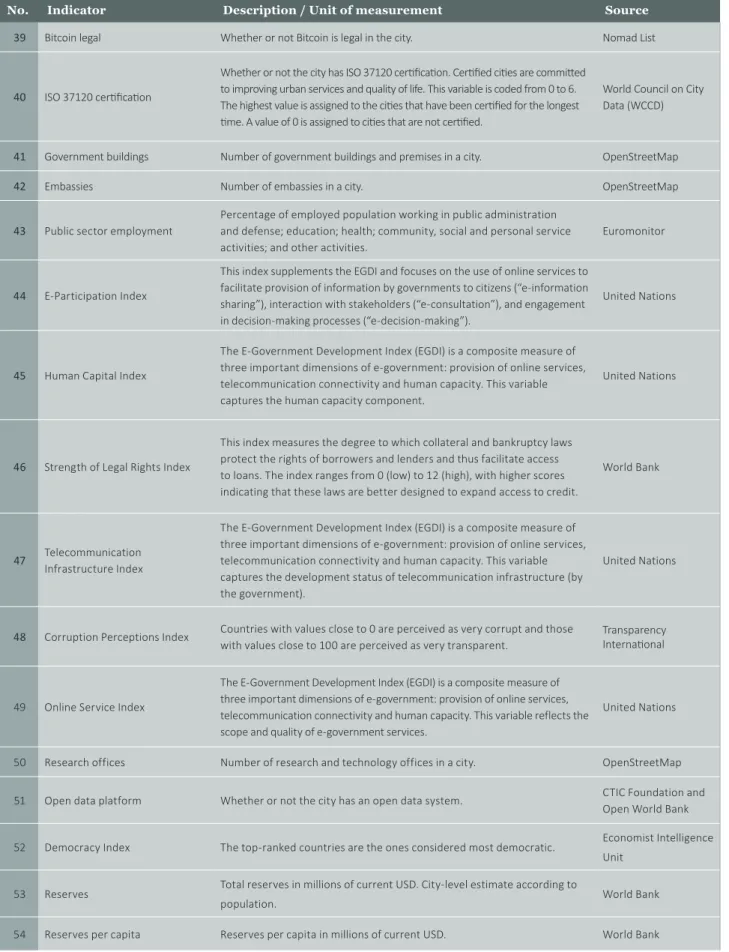
Table 4 shows the indicators that represent the governance dimension in this report, a description of each one, the units of measurement, and the information sources used.
Cities that have ISO 37120 certification are committed to improving the services they offer and quality of life.
ISO 37120 establishes smart city standards based on 100 indicators and aims to provide a benchmark for comparing all cities on equal terms. This variable is incorporated with a positive sign.
The number of research offices and the number of government buildings show how responsive the local government is to the needs of citizens in terms of dealing with queries and carrying out administrative, regulatory and other functions. These variables are included with a positive sign in the CIMI calculation. Similarly, the number of embassies and consulates (i.e., the number of embassies foreign countries assign to a city) is an indicator of its international importance by global standards.
Percentage of public sector employment—in education, defense, health and other areas—is a variable incorporated into this dimension with a positive sign, given that it is an indicator of human capital in the public sector.
The E-Government Development Index (EGDI) incorporates the access characteristics, such as the infrastructure and educational levels, to reflect how a country is using information technologies to promote access and inclusion of its citizens. It is a measure composed of four important dimensions of e-government, which are included as independent variables this year. These variables (included with a positive sign) are: provision of online services, telecommunication connectivity, the ability of individuals to use available e-government services, and the development status of telecommunication infrastructure (by the government).
The E-Participation Index, which supplements these four variables and measures the means used by each country to involve its citizens in decision-making, is also included
Table 4. Governance Indicators
No. Indicator Description / Unit of measurement Source
39 Bitcoin legal Whether or not Bitcoin is legal in the city. Nomad List
40 ISO 37120 certification
Whether or not the city has ISO 37120 certification. Certified cities are committed to improving urban services and quality of life. This variable is coded from 0 to 6.
The highest value is assigned to the cities that have been certified for the longest time. A value of 0 is assigned to cities that are not certified.
World Council on City Data (WCCD)
41 Government buildings Number of government buildings and premises in a city. OpenStreetMap
42 Embassies Number of embassies in a city. OpenStreetMap
43 Public sector employment
Percentage of employed population working in public administration and defense; education; health; community, social and personal service activities; and other activities.
Euromonitor
44 E-Participation Index
This index supplements the EGDI and focuses on the use of online services to facilitate provision of information by governments to citizens (“e-information sharing”), interaction with stakeholders (“e-consultation”), and engagement in decision-making processes (“e-decision-making”).
United Nations
45 Human Capital Index
The E-Government Development Index (EGDI) is a composite measure of three important dimensions of e-government: provision of online services, telecommunication connectivity and human capacity. This variable captures the human capacity component.
United Nations
46 Strength of Legal Rights Index
This index measures the degree to which collateral and bankruptcy laws protect the rights of borrowers and lenders and thus facilitate access to loans. The index ranges from 0 (low) to 12 (high), with higher scores indicating that these laws are better designed to expand access to credit.
World Bank
47 Telecommunication Infrastructure Index
The E-Government Development Index (EGDI) is a composite measure of three important dimensions of e-government: provision of online services, telecommunication connectivity and human capacity. This variable captures the development status of telecommunication infrastructure (by the government).
United Nations
48 Corruption Perceptions Index Countries with values close to 0 are perceived as very corrupt and those
with values close to 100 are perceived as very transparent. Transparency International
49 Online Service Index
The E-Government Development Index (EGDI) is a composite measure of three important dimensions of e-government: provision of online services, telecommunication connectivity and human capacity. This variable reflects the scope and quality of e-government services.
United Nations
50 Research offices Number of research and technology offices in a city. OpenStreetMap 51 Open data platform Whether or not the city has an open data system. CTIC Foundation and
Open World Bank 52 Democracy Index The top-ranked countries are the ones considered most democratic. Economist Intelligence
Unit 53 Reserves Total reserves in millions of current USD. City-level estimate according to
population. World Bank
54 Reserves per capita Reserves per capita in millions of current USD. World Bank
The Strength of Legal Rights Index measures the degree to which collateral and bankruptcy laws protect the rights of borrowers and lenders and thus facilitate access to loans. Index values range from 0 to 12, with higher scores indicating that laws are better designed to expand access to credit. Establishing appropriate conditions and ensuring enforcement of the rights of citizens and companies based in their territory are functions of national or local governments and cannot be delegated.
The perception that legal rights are enforced influences all aspects of the life of a country or city, including the business climate, incentives for investment, and legal security, among others. This index has therefore been incorporated with a positive sign when creating the indicator for this dimension.
The Corruption Perceptions Index serves to measure the quality of governance. A high societal perception of corruption in public bodies indicates that state intervention is not efficient from the standpoint of the social economy (because public services, broadly understood, entail higher costs than they would in the absence of corruption). Moreover, incentives to invest or settle in countries or cities with a high perception of corruption will be lower than in others with low levels of perceived corruption, which has a negative impact on sustainability. For the CIMI, this index is used as an explanatory indicator for the governance dimension. Transparency International assigns a value of 0 to countries with high levels of corruption and 100 to those that are highly transparent, so this variable is incorporated with a positive sign.
The Democracy Index shows the level of democracy in a country as reflected in its electoral system, freedom of expression, government functioning, and political participation and culture. Values are included with a negative sign since the countries in the top positions are the ones considered most democratic.
The variable that assesses whether the government of a city has an open data platform is an indicator of transparency in management by the local executive and the existence of a channel for communicating with citizens and a platform for generating new business models. A value of 1 is assigned if the city has an open data platform; otherwise, a value of 0 is assigned. The indicator is therefore incorporated into this dimension
The level of reserves (total and per capita) is an indicator of the short- and medium-term strength of public finances, the ability to cope with changing economic cycles, and the soundness and sustainability of the economic structure as regards the state. This variable is incorporated with a positive sign.
Finally, in view of the widespread use of virtual currency, this year the variable Bitcoin legal (with a positive sign) is included to indicate whether or not a city has legalized the use of Bitcoin.
Environment
In relation to cities, sustainable development can be defined as “development that meets the needs of the present without compromising the ability of future generations to meet their own needs.” Improving environmental sustainability through anti-pollution plans, support for green buildings and alternative energies, efficient water and waste management, and policies that help counteract the effects of climate change are essential to ensure the sustainability of cities over time.
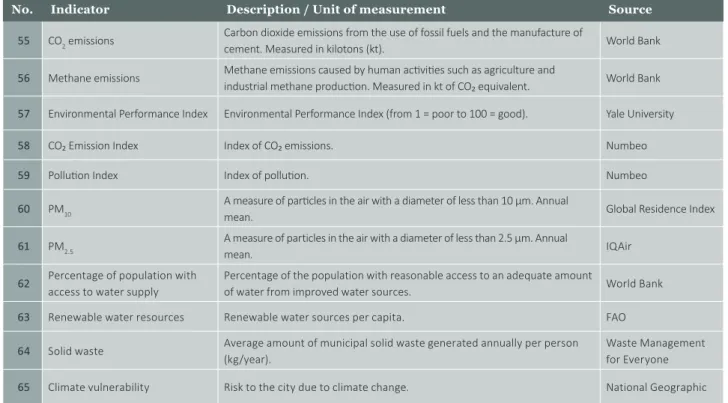
Since the CIMI also aims to measure environmental sustainability, the environment is included as one of the key dimensions for quantitative assessment. Table 5 shows the indicators selected for this dimension, a brief description of each one, their units of measurement, and the information sources used.
The indicators selected include measures of air pollutants and water quality in cities (clear indicators of the quality of life of their inhabitants) and of the sustainability of a city’s production and urban development structure.
CO₂ emissions are generated by the use of fossil fuels and the manufacture of cement, while methane emissions are produced by human activities such as agriculture and industrial production. These two types of emissions are the main measures commonly used to quantify the level of air pollution, given that these gases are closely linked to the greenhouse effect. In fact, reducing the values of these indicators is one of the objectives of the Kyoto Protocol.
Other key indicators for measuring air pollution in cities
liquid) of dust, ash, soot, metal, cement and pollen dispersed in the atmosphere, with a diameter of 2.5 µm or less in the case of PM2.5 and 10 µm or less in the case of PM10. Such particles are mainly composed of inorganic compounds such as silicates and aluminates, heavy metals, and organic material associated with carbon particles (soot). These indicators are commonly used in indexes that aim to measure environmental pollution.
They are supplemented by information provided by a city’s pollution index, which estimates overall pollution.
The greatest weight is given to the cities with the most polluted air.
The Environmental Performance Index (EPI), calculated by Yale University, is an indicator based on the measurement of two major dimensions related to the environment, namely, environmental health and ecosystem vitality.
The former is divided into three sub-dimensions: effects of air pollution on human health, water quality, and the environmental burden of disease. Ecosystem vitality, in turn, encompasses seven sub-dimensions that take account of the effects on the ecosystem of air pollution, water quality, biodiversity and habitat, deforestation, fisheries, agriculture and climate change. Given that this indicator is very comprehensive (covering almost all factors related to measuring the status and evolution of a city’s environment and supplemented by the other indicators included in the CIMI), we believe the environment dimension is represented in a proportionate manner in the index.
Water is a renewable resource that has a highly important role to play in dealing with climate change and its devastating effects. The variable total renewable water sources per capita takes account of both internal and external renewable surface water resources and represents the resources that a country has available to ensure a sustainable future. Water is also a vital resource for the population. Therefore, the variable percentage of population with access to water supply is considered a critical element in the development of a city. Both variables are incorporated with a positive sign in the calculation of the index.
Given the prevalence of poor solid waste management, the average amount of municipal solid waste (garbage) generated annually per person (kg/year) in a city represents potential harm to its inhabitants and the environment. In many cities, poor waste management poses an additional health risk to people who work with waste materials. The variable is therefore incorporated into the index with a negative sign.
This year, the climate vulnerability variable, which is calculated by National Geographic and measures how vulnerable a city is to climate change, has been added to the index. This variable takes into account current temperatures in a city and the temperature projected for the year 2070. Indicator values range from 1 to 5, with the highest value assigned to the most vulnerable cities.
No. Indicator Description / Unit of measurement Source
55 CO2 emissions Carbon dioxide emissions from the use of fossil fuels and the manufacture of
cement. Measured in kilotons (kt). World Bank
56 Methane emissions Methane emissions caused by human activities such as agriculture and
industrial methane production. Measured in kt of CO₂ equivalent. World Bank 57 Environmental Performance Index Environmental Performance Index (from 1 = poor to 100 = good). Yale University
58 CO₂ Emission Index Index of CO₂ emissions. Numbeo
59 Pollution Index Index of pollution. Numbeo
60 PM10 A measure of particles in the air with a diameter of less than 10 µm. Annual
mean. Global Residence Index
61 PM2.5 A measure of particles in the air with a diameter of less than 2.5 µm. Annual
mean. IQAir
62 Percentage of population with access to water supply
Percentage of the population with reasonable access to an adequate amount
of water from improved water sources. World Bank
63 Renewable water resources Renewable water sources per capita. FAO
64 Solid waste Average amount of municipal solid waste generated annually per person (kg/year).
Waste Management for Everyone
65 Climate vulnerability Risk to the city due to climate change. National Geographic
Table 5. Environment Indicators
Mobility and transportation
Cities of the future face two major challenges in the area of mobility and transportation: facilitating travel (often over large territories) and access to public services.
Mobility and transportation (in terms of road and route infrastructure, the vehicle fleet, public transit and air transport) affect the quality of life of a city’s inhabitants and can be key to its sustainability over time. However, perhaps the most important issues to consider are the externalities generated in the production system, whether due to the need of the labor force to commute or the need to distribute production.
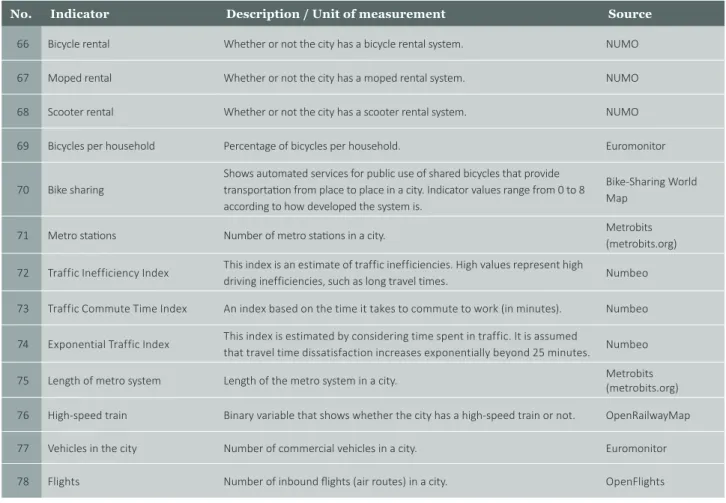
Table 6 shows the indicators used for the mobility and transportation dimension, a description of each one, the units of measurement, and the information sources used.
Variables related to bicycle, moped and scooter rental services (collected by the New Urban Mobility Alliance, NUMO) capture the impact of micromobility in cities.
These three variables are binary and indicate the presence or absence of these services in a city. They are incorporated into the index with a positive sign.
The indexes for time in traffic (considered in exponential terms), traffic commute time, and traffic inefficiency are estimates of traffic dysfunction caused by long driving times and the dissatisfaction that these situations generate in the population. These indicators enable us to measure the safety of roads and public transit, which, if it is effective and has good infrastructure, contributes to reducing vehicular road traffic and the number of accidents. They are all included with a negative sign in the calculation of the CIMI as they have a negative impact on the development of a sustainable city.
The bike sharing indicator captures information regarding the bicycle sharing system in a city, which allows residents to get around using public bicycles. Indicator values range from 0 to 8, where 0 indicates the absence of such a system in a city and 8 denotes the presence of a highly developed system. This indicator is incorporated into the CIMI with a positive sign.
The number of metro stations and the length of the subway system are indicators of a commitment to city development and investment in relation to the size of the population. Similarly, the number of air routes (inbound) and the presence of high-speed rail represent the level of development in mobility. A highly developed city will favor the incorporation of new commercial air routes
No. Indicator Description / Unit of measurement Source
66 Bicycle rental Whether or not the city has a bicycle rental system. NUMO
67 Moped rental Whether or not the city has a moped rental system. NUMO
68 Scooter rental Whether or not the city has a scooter rental system. NUMO
69 Bicycles per household Percentage of bicycles per household. Euromonitor
70 Bike sharing
Shows automated services for public use of shared bicycles that provide transportation from place to place in a city. Indicator values range from 0 to 8 according to how developed the system is.
Bike-Sharing World Map
71 Metro stations Number of metro stations in a city. Metrobits
(metrobits.org) 72 Traffic Inefficiency Index This index is an estimate of traffic inefficiencies. High values represent high
driving inefficiencies, such as long travel times. Numbeo 73 Traffic Commute Time Index An index based on the time it takes to commute to work (in minutes). Numbeo 74 Exponential Traffic Index This index is estimated by considering time spent in traffic. It is assumed
that travel time dissatisfaction increases exponentially beyond 25 minutes. Numbeo
75 Length of metro system Length of the metro system in a city. Metrobits
(metrobits.org) 76 High-speed train Binary variable that shows whether the city has a high-speed train or not. OpenRailwayMap
77 Vehicles in the city Number of commercial vehicles in a city. Euromonitor
Table 6. Mobility and Transportation Indicators
and the movement and transit of passengers in different modes of transportation. These indicators are included with a positive sign in the calculation of the index due to their positive effect in this dimension.
The variable vehicles in the city (number of commercial vehicles) is included with a negative sign due to its negative effect on traffic and traffic congestion. Conversely, the variable percentage of bicycles per household is included with a positive sign given its positive effect on traffic.
Urban planning
Urban planning in cities has always been considered a driver of development and poverty reduction. Today, it is a collective exercise that must involve all stakeholders, including citizens, civil society organizations, the public and the private sector, multilateral agencies and academia.
Urban planning, in turn, is closely related to sustainability.
To improve the livability of any territory, it is important to take into account local master plans and the design of green areas and spaces for public use while also focusing on smart growth. New urban planning methods should focus on creating compact, well-connected cities with accessible public services.
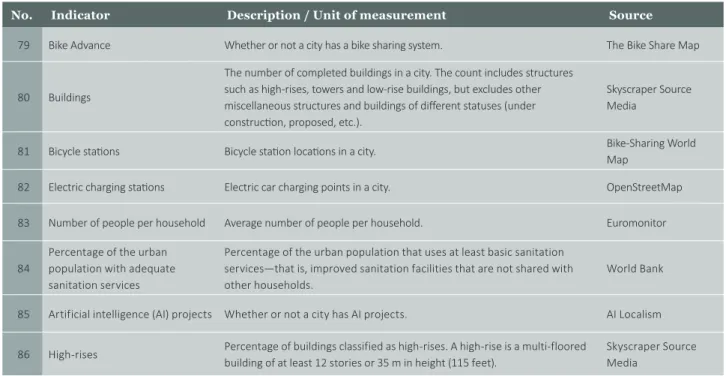
Based on the information available, several points related to urban development plans, the quality of health infrastructure, and housing policy are included as indicators for this dimension. Table 7 shows the indicators included in this dimension, a description of each one, the units of measurement, and the information sources used.
Bicycles are an efficient, fast, economical, healthy and environmentally friendly mode of transportation.
Their use has a positive impact on a city’s sustainable development because they do not pollute or use fuel, among other benefits. Given this positive effect, the CIMI incorporates the number of bike-rental or bike- sharing points, based on docking stations where they can be picked up and dropped off (the number of bicycle stations). Cities that have historically been labeled as
“smart” tend to have high bicycle use. This variable is therefore incorporated with a positive sign.
The quality of sanitation services indicator refers to the percentage of the urban population with improved sanitation facilities that are not shared with other households. This indicator is highly correlated with urban planning since it can be shown that poor planning inevitably leads to sanitation problems in the short and medium term.
Also, from an urban planning and housing perspective, a city with proper urban planning generally presents few or no problems of household overcrowding because housing policy, in relation to the estimated growth of the urban population, is a determining factor in urban planning. Therefore, within the explanatory indicators of this dimension, the number of occupants in each household is included with a negative sign.
The number of completed buildings and the percentage of high-rises contribute to creating compact, organized cities. These variables are incorporated into the index with a positive sign.
No. Indicator Description / Unit of measurement Source
79 Bike Advance Whether or not a city has a bike sharing system. The Bike Share Map
80 Buildings
The number of completed buildings in a city. The count includes structures such as high-rises, towers and low-rise buildings, but excludes other miscellaneous structures and buildings of different statuses (under construction, proposed, etc.).
Skyscraper Source Media
81 Bicycle stations Bicycle station locations in a city. Bike-Sharing World
Map
82 Electric charging stations Electric car charging points in a city. OpenStreetMap
83 Number of people per household Average number of people per household. Euromonitor
84
Percentage of the urban population with adequate sanitation services
Percentage of the urban population that uses at least basic sanitation services—that is, improved sanitation facilities that are not shared with other households.
World Bank
85 Artificial intelligence (AI) projects Whether or not a city has AI projects. AI Localism Percentage of buildings classified as high-rises. A high-rise is a multi-floored Skyscraper Source
Table 7. Urban Planning Indicators
Due to increasing use of electric cars, this year a variable that captures information on charging stations for vehicles of this kind in a city has been added.
AI is now playing a key role in improving the development of cities. Among other benefits, it is helping local authorities collect information about city inhabitants, thereby facilitating efficient management of resources. For example, a city that uses AI to reduce traffic problems is in a good position to solve its mobility problems. AI tools make it possible to collect traffic information in real time, predict traffic jams, improve mobility, and decongest key areas.
In light of these positive impacts, the number of AI projects underway in a city has been included in the calculation of the CIMI for the first time this year (with a positive sign).
International profile
Cities that want to make progress must achieve a prominent position in the world. To maintain a high profile globally, they must improve their brand and level of international recognition through strategic tourism plans, by attracting foreign investment, and by ensuring that they are represented abroad.
Cities in the same country can vary in terms of the strength of their international profile, but a city’s global stature is not independent of the degree of openness at the national level. This dimension is intended to reflect
such differences and measure the international profile of cities.
To this end, we have included the following indicators:
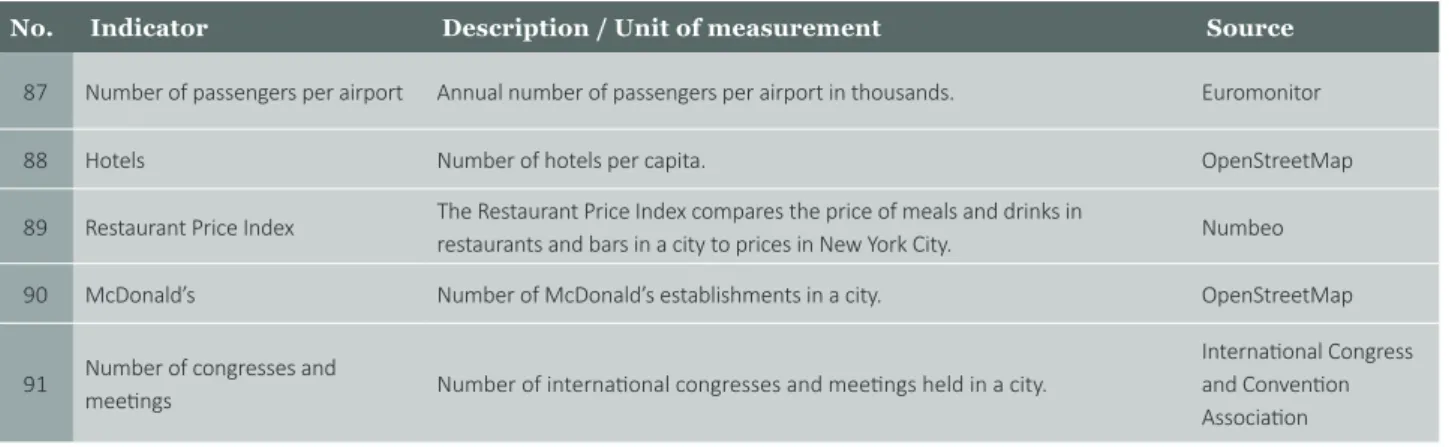
airports, number of passengers per airport, number of hotels in a city, and number of meetings and congresses held (based on data from the International Congress and Convention Association, ICCA). This last of these indicators is important in relation to a city’s international profile, given that events of this kind are generally held in cities with international hospitality services, specially equipped venues, frequent international flights, and adequate security measures. Given when the index was calculated, it should be noted that values for this indicator do not reflect the impact of the COVID-19 pandemic on events of this kind. The data source (ICCA) is working to incorporate these modifications in the near future.
Table 8 shows the indicators for this dimension, a description of each one, their units of measurement, and the information sources used.
The higher the values for these indicators, the stronger a city’s profile in the world. Therefore, all the indicators for this dimension are incorporated into the calculation of the CIMI with a positive sign. The Restaurant Price Index variable compares the price of restaurants in a city with prices in New York. As an indicator of international culinary variety, this variable is incorporated with a positive sign.
No. Indicator Description / Unit of measurement Source
87 Number of passengers per airport Annual number of passengers per airport in thousands. Euromonitor
88 Hotels Number of hotels per capita. OpenStreetMap
89 Restaurant Price Index The Restaurant Price Index compares the price of meals and drinks in
restaurants and bars in a city to prices in New York City. Numbeo
90 McDonald’s Number of McDonald’s establishments in a city. OpenStreetMap
91 Number of congresses and Number of international congresses and meetings held in a city.
International Congress and Convention
Table 8. International Profile Indicators
Technology
Though not the only important issue for cities, information and communication technologies (ICT) are part of the backbone of any society that aims to achieve
“smart” status.
Technology, a dimension included in the CIMI, is an aspect of society that improves quality of life in the present, while the level of development or extent of ICT use is an indicator of current or potential quality of life. Technological development also allows cities to be sustainable over time and to maintain or further develop the competitive advantages of their production system and the quality of employment. A technologically backward city has comparative disadvantages with respect to others, in terms of security, education and health (all key to the sustainability of a society) and also with respect to its production system. If a city falls short in this dimension, production functions become outdated and, in the absence of protective measures, competitiveness is undermined, which has a negative impact on a city’s consumption and investment capacity and reduces labor productivity.
The indicators selected to measure the performance of cities in terms of the extent and growth of technology use are presented in Table 9 below.
The indicators that represent the number of Twitter and LinkedIn users are combi