The impact of the manager–shareholder conflict on acquiring bank returns
Marcia Millon Cornett
a,*, Gayane Hovakimian
b, Darius Palia
c, Hassan Tehranian
d,*aDepartment of Finance, College of Business, Southern Illinois University, Carbondale, IL 62901, USA
bGraduate School of Business, Fordham University, New York, NY 10023, USA
cColumbia Business School, Columbia University, New York, NY 10027, USA
dCarroll School of Management, Boston College, Chestnut Hill, MA 02167, USA Received 22 May 2000; accepted 16 May 2001
Abstract
This paper examines whether shareholder value-maximizing corporate governance mecha- nisms assist in reducing the managerial incentive to enter value-destroying bank acquisitions.
We find that diversifying bank acquisitions earn significantly negative announcement period abnormal returns (AR) for bidder banks whereas focusing acquisitions earn zero AR. We then find that corporate governance variables (such as CEO share and option ownership and a smaller board size) in the bidding bank are less effective in diversifying acquisitions than in focusing acquisitions. These results are robust to the inclusion of the usual control variables.
Ó 2002 Elsevier Science B.V. All rights reserved.
JEL classification:G21; G34
Keywords:Banks; Bank acquisitions; Corporate governance
1. Introduction
Several empirical studies have documented a negative relation between firm per- formance and the level of diversification in a firm’s lines of business in the 1980s (see
*Corresponding authors. Address: Carroll School of Management, Boston College, Chestnut Hill, MA 02167, USA. Tel.: +1-618-453-2459; fax: +1-618-453-7961. Tel.: +1-617-552-3944 (H. Tehranian).
E-mail address:[email protected](M.M. Cornett).
0378-4266/02/$ - see front matterÓ 2002 Elsevier Science B.V. All rights reserved.
PII: S 0 3 7 8 - 4 2 6 6 ( 0 1 ) 0 0 2 1 0 - 2
www.elsevier.com/locate/econbase
for example, Morck et al., 1990; Lang and Stulz, 1994; John and Ofek, 1995). A pos- sible argument for lower returns from firm-level diversification is the managerial agency argument that CEOs cannot operate unrelated lines of business as efficiently as single or related business segments. Companies therefore do not create value from firm-level diversification when investors can do so more cheaply through portfolio diversification in the financial markets. According to this agency view, value-destroy- ing managerial activities (such as firm-level diversification) can be reduced by design- ing effective corporate governance mechanisms.
In the industrial firm literature, bidders’ announcement period abnormal returns (AR) have been found to be positively related to insider share ownership in the year before the takeover (Lewellen et al., 1985; You et al., 1986). However, the CEO pay–
performance studies (e.g., Jensen and Murphy, 1990a,b; Hall and Liebman, 1987) and the board of director literature (e.g., Jensen, 1993; Yermack, 1996) have found other corporate governance variables to have a statistically significant effect on firm value. In this paper, we examine a comprehensive set of corporate governance vari- ables and find many of them to have a significant impact on bidder AR around the announcement of both diversifying and focusing bank acquisitions. We then exam- ine whether these corporate governance mechanisms assist in reducing the manage- rial incentive to enter value-destroying bank acquisitions.
Our results suggest that acquisition announcements for diversifying acquisitions (geographic and activity diversification) produce significantly smaller AR for bidder banks than focusing acquisitions. Specifically, we find that bidder AR are signifi- cantly negative in interstate and activity diversifying bank acquisitions and are not significantly different from zero in intrastate and activity focusing bank acquisitions.
Importantly we find a differential impact of corporate governance variables on diver- sifying versus focusing acquisitions. We find that corporate governance variables (such as CEO share and option ownership and a smaller board size) are less signifi- cant in diversifying acquisitions than in focusing acquisitions. This might help ex- plain why diversifying acquisitions earn negative AR.
We look at diversification along two dimensions; geography and activity. Unlike other industries, the banking industry allows us to examine focusing and diversifying events that are easily observable to the external capital markets. Most previous stud- ies have used SIC codes to classify whether mergers are diversifying or focusing.
However, recent research has shown SIC codes to have significant classification issues. For example, Kahle and Wakling (1996) find significant differences between Compusat and Center for Research in Security Prices (CRSP) databases in 36% of the classifications at the two-digit level and nearly 80% at the four-digit level. They also find that these discrepancies are exacerbated among utilities, financial compa- nies and conglomerates. Further, Scarfstein, 1999 shows that segments producing very related products can have very different two-digit SIC codes, as can companies that have vertical relationships (see also Matsusaka, 1993). For the banking indus- try SIC codes reflect regulatory structure (e.g., federal member bank or state non- member bank) rather than product lines. Thus, researchers cannot use SIC codes to determine activity diversification between two merging banks. Intrastate versus in- terstate bank acquisitions, however, is a transparent classification scheme to market
participants who after all generate the AR. Intrastate acquisitions (where both the bidder and target bank are headquartered in the same state) are focusing acquisitions and tend to concentrate the acquirer’s existing market power or brand recognition and allow for greater cost efficiency. Interstate acquisitions (where the bidder extends its operations beyond the state in which it is headquartered by buying a bank whose headquarters are in another state) are diversifying acquisitions. A second observable measure of diversifying versus focusing acquisitions (which is not unique to the banking industry) is the correlation coefficient of daily stock returns for bidders and targets (Morck, 1990; DeLong, 2001). Historical stock return movements that are highly correlated indicate that the bidding and target banks are engaged in similar types of risk and therefore similar types of activities. A merger or acquisition of such banks is activity focusing. Low correlation coefficients of returns indicate that the two banks engage in different types of risks and therefore, activities. A merger or acquisition of such banks would be activity diversifying.
DeLong (1999, 2001) examines bank mergers that focus geographically and by ac- tivity and finds that these mergers create value upon announcement. Further, bank mergers that diversify either geographically or by activity do not create value. In this paper we extend DeLong’s work by examining abnormal announcement period returns in bank acquisitions that focus operations (geographically or by activity) versus acquisitions that diversify, and relate these AR to a comprehensive set of corporate governance mechanisms that have been shown (in other contexts) to re- duce the manager–shareholder conflict. Accordingly, we examine whether focus- ing/diversifying acquisitions might affect announcement period AR differentially, and how corporate governance mechanisms affect these AR. As Shleifer and Vishny (1988, p. 15) state: ‘‘In our interpretation of the acquisition process, non-value- maximizing behavior of bidders plays a central role.. . .before stressing the role of takeovers in eliminating non-value-maximizing behavior by managers of target com- panies, it is important to remember the managers of bidding firms. For them, the purchase of other companies at inflated prices may be the grandest deviation from value maximization.’’
The remainder of the paper is organized as follows. In Section 2 we identify the different corporate governance mechanisms that have been suggested in the literature to reduce the manager–shareholder conflict. Sections 3 and 4 describe the control variables, data and methodology used. Our results are presented in Section 5.
Finally, Section 6 concludes the paper.
2. Corporate governance mechanisms
Current research on the principal-agent problem in the modern corporation has focused on the ability of corporate governance mechanisms to reduce the mana- ger–shareholder conflict. The corporate governance mechanisms that have been ex- amined (in other contexts) include the CEO’s pay–performance sensitivity, board of director characteristics, the CEO’s age and equity ownership by blockholders. We explain them in detail below.
2.1. CEO’s pay–performance sensitivity
The relation between managerial compensation and shareholder wealth has been well documented in the finance literature. For example, Jensen and Murphy (1990a) find that CEO wealth increases by $3.25 per $1000 increase in shareholder wealth.
Jensen and Murphy (1990b) suggest that the level of pay alone is not important in resolving the agency issues between the CEO and the firm’s shareholders. Rather, what is crucial is the strength of the pay–performance relationship. That is, in order to induce CEOs to maximize shareholder wealth, boards should construct compen- sation contracts that are performance or stock price oriented. In an interesting case study of nine bank mergers Calomiris and Karceski (1998) show that sometimes management does not act in the interests of shareholders. For example, Boulevard in Chicago underperformed its peers for many years before the merger based on any performance measure. Management created valuable golden parachutes for themselves two months before it was sold to First Bank, wherein their shareholders got only a small acquisition premium.
There are many mechanisms by which compensation policy can provide value-in- creasing incentives to improve a CEO’s performance. These mechanisms can be clas- sified into bonus and salary, stock options and performance-based dismissal actions. 1Accordingly, we define one measure of CEO’s incentive-based pay to in- clude the ratio of the dollar value of stock options granted to the dollar value of a CEO’s salary and bonus in the year before the merger announcement. This definition of incentive-compatible compensation implicitly assumes that the sensitivity of the value of options granted to shareholder wealth increases is much greater than the sensitivity of salary and bonus to increases in shareholder wealth. Both Jensen and Murphy (1990a) and Hubbard and Palia (1995a) find evidence supporting this.
Equity holdings in the bank can be bought by the CEO independent of the direct shares received in accordance with the compensation committee. Equity ownership aligns incentives between CEOs and their shareholders (Jensen and Murphy, 1990a,b; Palia, 2000; Brown and Maloney, 1998). This congruence of interests allows us to create a second definition of CEO compensation that relates pay to perfor- mance: the percentage of equity held by the CEO in the firm.2
Given that the actions of CEOs are based on their private information (and these agents are employed to manage the principal’s company), a bank that better aligns the CEO’s interests with shareholder interests through a higher pay–performance re-
1Regarding performance-based dismissal actions, studies such as Coughlan and Schmidt (1985), Warner et al. (1988), Weisbach (1988), Jensen and Murphy (1990a) and Murphy and Zimmerman (1991) have found a negative relationship between net-of-market firm performance and the probability of managerial turnover. These findings suggest that managers are more likely to leave after bad years than after good years and are disciplined by the credible threat of dismissal. As this issue is not the focus of our study, we do not include the threat of dismissal in our definition of incentive-based pay.
2Given that CEO equity ownership is not completely under the direct control of the compensation committee, we include it separately.
lationship (either through shares or options owned) should see higher AR associated with an acquisition.
2.2. Board of directors
There is considerable disagreement in the finance literature regarding the effect of the composition of the board of directors (i.e., inside versus outside directors). Those who consider the board as an important element of corporate governance argue that boards dominated by outsiders are in a better position to monitor and control mana- gers (Dunn, 1987). Outside directors are not only independent from the firm’s mana- gers, but also bring a greater breadth of experience to the firm (Firstenberg and Malkiel, 1980; Vance, 1983). Weisbach (1988), Byrd and Hickman (1991) and Bhagat et al. (1994) show that outside dominated boards are, in fact, more likely than inside- dominated boards to respond to poor performance by replacing the CEO. A number of studies have linked the proportion of outside directors to financial performance and shareholder wealth (Brickley et al., 1994; Byrd and Hickman, 1991; Subrahmanyan et al., 1997; Rosenstein and Wyatt, 1990). These studies consistently find stock returns to be superior when outside directors hold a significant percentage of board seats.
Critics of the current-day configuration of boards of directors argue that manage- ment compensation contracts and external forces in capital markets effectively mon- itor managers. Thus, these critics argue that there is no need for a board of directors, and particularly outside members to duplicate this monitoring process (Mace, 1986;
Demsetz, 1985). Accordingly, Hermalin and Weisbach (1991) find no significant im- pact of the composition of the board on firm value. In some studies (e.g., Agrawal and Knoeber, 1995; Yermack, 1996; Bhagat and Black, 1996), a higher percentage of outsiders on the board has a significant negative impact on firm value. Given the conflicting evidence on board composition and firm value, we cannot, a priori, predict the sign of the relationship between board composition and AR at the an- nouncement of a bank acquisition.
Previous research has suggested that the size of the board of directors has a sta- tistically significant impact on firm value. Jensen (1993) suggests that small boards are more effective in monitoring a CEO’s actions, as large boards have a greater em- phasis on ‘‘politeness and courtesy’’ and are therefore easier for the CEO to control.
Yermack (1996) finds an inverse relationship between board size and Tobin’s Q in a sample of industrial companies, and concludes that large boards are less effective than small boards. Accordingly, we expect the size of the bidding bank’s board to be inversely related to the announcement period AR.
2.3. Age of CEO
The age of the CEO may determine his/her effectiveness in managing the firm. Re- search suggests that top officials in the firm with little experience have limited effec- tiveness because it takes time to gain an adequate understanding of the company (Bacon and Brown, 1973; Alderfer, 1986). In fact, increased experience has been linked to resistance to paying greenmail (Kosnik, 1987, 1990) and to financial performance
(Brown and Maloney, 1998). These articles suggest that the older the bank’s CEO, the greater the understanding of the bank and banking industry, and the greater the ability to negotiate successfully on behalf of the bank’s shareholders during an acquisition.
2.4. Equity ownership by blockholders
Shleifer and Vishny (1986) find that large shareholders (with large amounts of wealth at stake) may have a greater incentive to monitor managers than the board of directors who may have little wealth invested in the firm. McConnell and Servaes (1990) find evidence consistent with this hypothesis. Thus, the existence of large block- holders who actively monitor managers’ actions would reduce the need for pay–
performance based compensation contracts. However, Hubbard and Palia (1995b) find that block ownership of the bidders’ common stock had no effect on announce- ment period AR for manufacturing industry acquisitions. Further, the inclusion of this variable did not change the impact of managerial ownership on AR.
It needs to be noted that optimal governance mechanisms can vary across firms and over time. For example, while Jensen and Murphy (1990b) assert that high pay-for-performance is good, others (e.g., Haubrich, 1994) have demonstrated that observed sensitivities are consistent with the basic principal–agent models. As an- other example, banks tend to have very large boards: directors often play an impor- tant role relative to manufacturing firms. Thus, while previous literature has documented general trends for the governance mechanisms, it is possible that opti- mal (value-maximizing) trends will vary for the banking industry over the period of time examined.
3. Control variables
3.1. Diversifying versus focusing acquisitions
In this paper we examine diversifying versus focusing acquisitions in two ways:
geographic diversification and activity diversification. Study of the banking industry allows for a unique opportunity in examining diversifying versus focusing acquisi- tions, and how the manager–shareholder conflict plays out. That is, unlike other in- dustries, interstate versus intrastate bank acquisitions is a transparent geographic diversification classification scheme that allows market participants to observe the diversifying versus focusing nature of managerial decisions. 3Interstate acquisitions
3In a related paper, Liang and Rhoads (1988) look at the impact of geographic diversification on bank risk. They find that overall risk of banks is lower in geographically diversified banks. Houston et al. (1999) find that mergers that involve a high degree of geographic overlap result in substantial opportunities for cost savings and thus higher bank values relative to mergers that involve a low degree of overlap. Bodnar et al. (1998) examine international diversification. They find that the value of a firm with international operations is, on average, higher than that of a comparable single-activity domestic firm.
are diversifying in nature. The bidder extends its operations, allowing it to diversify away some of its overall risk, yet requiring the bank to devote additional resources beyond the state in which it is headquartered. Intrastate acquisitions, on the other hand, are focusing in nature. These acquisitions tend to concentrate the acquirer’s existing market power or brand recognition and allow for greater cost efficiency.
Historically, most states did not allow acquisitions across state lines, and the McFadden Act of 1927 required national banks to conform to state branching re- strictions. Over time, and in a piecemeal fashion, states legalized their restrictions on intrastate acquisitions; by 1990 all states allowed intrastate branching. Interstate banking, on the other hand, was initially legitimized in June 1985, with the Supreme Court ruling in Northeast Bancorp v. Board of Governors (105 S. Circuit 2545, 1985). Subsequently, many states passed interstate banking laws that allowed out of state banks to acquire their banks. However, most of these limited acquisitions to banks located in contiguous states. In 1994, Congress passed the Riegle–Neal Interstate Banking and Branching Efficiency Act that allowed nationwide banking via both interstate acquisition and branching. Riegle–Neal, therefore, legitimized full nationwide banking. (While the effective date was stated in the bill as June 1997, most states opened their doors to full interstate banking and branching shortly after Riegle–Neal was passed and many states were implementing nationwide banking be- fore final passage.) Thus, while intrastate expansion was legal throughout the period analyzed in this study (1988–1995), only with the deliberation and passage of Riegle–
Neal in 1994 was full interstate banking legitimized.
Carow and Heron (1998) examine events leading to the passage of Riegle–Neal.
They find that across the seven events that led to the passage of Riegle–Neal, banks with an existing interstate presence experienced significant negative abnormal stock returns relative to banks without an existing interstate presence. They attribute this result to the more likely aggressive interstate policies of these banks; ‘‘. . .a bank’s existing interstate presence is indicative of an increased propensity to engage in fu- ture acquisitions . . .’’. They have established their presence through acquisitions and are less likely to themselves become a target. Examining AR associated with in- terstate and intrastate acquisition announcements, Sushka and Bendeck (1988) show that external bank acquisitions (in which the bidder has less knowledge of the tar- get’s operations, e.g., an interstate acquisition) produce negative AR and internal ac- quisitions (where the bidder is familiar with the operations of the target, e.g., an intrastate acquisition) produce normal announcement period returns.4
Activity diversification considers the degree to which the bidder and target banks are involved in related versus unrelated activities. Similar to Morck et al. (1990) and DeLong (2001), we use the correlation coefficient of stock returns between the bidder and target bank prior to the acquisition to distinguish activity diversification. When the target bank has business lines that are not common to those of the bidder (i.e., the
4Some studies find that acquirers involved in interstate mergers earn insignificant AR (Cornett and Tehranian, 1992; Trifts and Scanlon, 1987), others find positive AR (Cornett and De, 1991a,b) and one study finds negative AR (Baradwaj et al., 1991). Intrastate mergers are examined in Cornett and Tehranian (1992) and Baradwaj et al. (1991) and are found to earn negative AR.
correlation coefficient of returns is low), the banks are engaged in different types of risk and therefore different types of activities. The acquisition is thus diversifying in nature. When the target and bidder banks are engaged in lines of business that are similar (i.e., the correlation coefficient of returns is high) the banks are engaged in similar types of risks and thus, activities before the acquisition. The acquisition is focusing in nature.
DeLong (1999, 2001) examines bank mergers according to whether they are focus- ing (where the two partners engage in similar activities) or diversifying (where the two partners engage in different activities). DeLong finds that focusing mergers pro- duce positive abnormal announcement period returns while diversifying mergers earn negative AR. Using an alternate measure of activity diversification, Houston and Ryngaert (1994) find bank acquisitions in which operations of the bidder and target overlap experience significantly larger AR than bank acquisitions in which op- erations do not overlap.
In this paper we examine AR associated with diversifying versus focusing acqui- sitions. Further, we explore whether any AR associated with geographic and/or ac- tivity diversifying acquisitions are related to the corporate governance mechanisms in place prior to the acquisition. 5
3.2. Medium of payment
Several hypotheses regarding a predictable relation between the medium of pay- ment and bidder returns have been explicitly suggested in the existing literature: the bidder overvaluation hypothesis (Myers and Majluf, 1984; Krasker, 1986); the wealth distribution hypothesis (Galai and Masulis, 1976; Travlos, 1987); and the tax implications hypothesis (Hansen, 1987; Travlos, 1987). Each of these lead to the conclusion that acquisition announcement AR should be higher for cash than stock offers.
Alternatively, Jensen’s (1986) free cash flow hypothesis argues that, rather than pay higher dividends to a firm’s stockholders, insiders will often prefer to use cash to finance investment projects that expand firm size but simultaneously reduce firm value (when all positive net present value projects have been exhausted). The agency
5Palia (1993) finds merger premiums (defined as the price paid to book value of the target bank) to be related to the separation of ownership and control in acquirer banks. He finds that merger premiums initially decline as managerial ownership increases, but as managerial ownership increases above 5.9%
merger premiums are positively related to managerial ownership. Whereas Palia examines the accounting variable (price paid to book value of the target bank), this paper uses the bidder’s stock price, or more specifically, the bidder’s AR on the announcement of the merger. Subrahmanyan et al. (1997) examine AR to bank acquisitions. They find a negative relation between AR and the proportion of outside directors and a positive relation between AR and the number of outsiders on the board and outside board member stock ownership. Further, Edwards (1977) and Smirlock and Marshall (1983) have studied the effect of the manager–shareholder conflict in the context of excessive consumption of managerial ‘‘perquisites’’. They find that bank managers indulge in some form of expense-preference behavior (by maximizing staff expenditures for which managers have a positive reference) and do not profit maximize.
costs associated with the use of these free cash flows leads to the conclusion that cash financed acquisition announcement returns may be lower than stock financed an- nouncement returns.
Specific to banking, Cornett and De (1991a,b) examine a sample of inter- state bank mergers and find no statistically significant difference in the excess an- nouncement period returns earned in mergers involving cash offers versus stock offers. However, Baradwaj et al. (1991) examine a sample of interstate and intra- state mergers and find that cash-financed mergers earned higher excess returns.
Given the evidence on the difference between announcement period AR and the method of financing an acquisition, we control for this variable in our empirical tests.
3.3. Size of bidder bank
CEO equity holdings in the firm are likely to be negatively related to firm size. To control for any possible impact that absolute bank size might have on CEO equity holdings, and thus on announcement period returns, we use the natural logarithm of the book value of total assets (in the year prior to the acquisition announcement) of the bidder bank as a control variable.
3.4. Capital
Unlike other industries, regulation requires banks to keep a minimum amount of capital as collateral against risk-taking activities. Whereas the above agency conflict is between bank managers and their stockholders, the banking industry has a conflict between regulators and stockholders that arises due to federally provided deposit in- surance. Since regulators are responsible for ensuring public confidence in the bank- ing system as a whole, they want to ensure that banks be given incentives to maintain the institution’s financial soundness. Capital standards are one way of providing these incentives. Given the ability of the bank to use excess capital to fund risky in- vestments (such as acquisitions), we include the bank holding company’s primary capital ratio (derived from FDIC Call Reports the year prior to the initial announce- ment) as a control variable.
It should be noted that the primary capital ratio used here is a book value-based ratio, while the abnormal return we evaluate is a market value-based number. Book values and market values can differ for banks due to many factors, particularly to credit risk from the banks’ on- and off-balance-sheet assets. Specifically, a bank may resist writing down the value of bad assets as long as possible to try to present a more favorable picture of the bank’s financial condition to stockholders, deposi- tors and regulators. Effective in 1994 banks were required to hold capital based on new (credit) risk-based capital ratios and regulators must now take specific actions based on these risk-based ratios. Thus, under the new regulation capital ratios better (although not perfectly) reflect market values.
4. Data and methodology
4.1. Sample selection and statistics
The sample of bank acquisitions examined in this study covers the period 1988–
1995. The initial list of completed bank acquisitions was obtained from the Federal Reserve Board of Governors. Initial announcement dates were identified by review- ing the Wall Street Journal Index (WSJ) and the LEXIS/NEXIS6database. We used the date on which the acquirer’s bid was first announced in either source as the initial announcement or event date. A total of 474 bank acquisition announcement dates were initially identified. To be included in the sample, we required that the bidding bank involved in each acquisition be traded on the New York Stock Exchange (NYSE), the American Stock Exchange (ASE) or in the Over-the-Counter (OTC) market. Daily return data were collected from the CRSP data tapes. Fifteen obser- vations were deleted from the initial sample because the bidding bank’s common stock prices were not available on the CRSP tapes for the entire period of analysis.
In order to avoid any bias from multiple acquisition bids we also eliminated 36 trans- actions in which the acquiring bank had more than one acquisition within a period of 135 trading days preceding the initial announcement date.
The final sample contains 423 acquisition announcements made by 177 bidding banks during the period 1988–1995. Table 1 lists the distribution of the sample of acquisitions by year of initial announcement, the number of intrastate (geographic focusing) versus interstate (geographic diversifying) acquisitions, activity focusing versus activity diversifying acquisitions, and cash financed versus stock financed ac- quisitions. As can be seen in Table 1, the majority of the sample comes from the last three years (1993–1995) of the eight-year period examined. The first five years in the sample period (1988–1992) were years in which the economy was recessionary and bank failures were numerous.7 Those banks healthy enough to expand could do so through federal government assisted purchases of failed banks (often at prices below fair market value) rather than through the acquisition of another healthy bank. As a result, the number of acquisitions of non-failing banks was relatively small. In 1992, the economy recovered, interest rates fell sharply and bank profits began to soar. Additionally, interstate banking restrictions continued to fall. Along with increased profits, the search for cost cutting, and access to new markets came a dramatic increase in the number of bank acquisitions, particularly in 1994 and 1995 after the passage of the Riegle–Neal Interstate Banking and Branching Efficiency Act in 1994. Indeed, 62.2% of our sample comes from the period 1993–1995.
6The LEXIS/NEXIS database contains full-text articles from several periodicals. We supplement our search of the WSJ with the LEXIS/NEXIS database to ensure that we have the first announcement of the acquisitions.
7For example, the number of bank failures during the 5 years 1988–1992 were 221, 207, 169, 127 and 122, respectively. The number of bank failures in 1993–1995, on the other hand, were 41, 13 and 6, respectively (see FDIC, Failed Bank Cost Study, 1996).
As mentioned earlier, previous research has found that announcement period AR for bank acquisitions differ for intrastate (geographic focusing) versus interstate (geographic diversifying) acquisitions and for cash versus stock financed acquisi- tions. Accordingly, we searched the LEXIS/NEXIS database to identify these statis- tics for the sample. We found that the sample consists of 227 intrastate and 196 interstate acquisitions. Also, 226 acquisitions were financed completely with stock, while 76 acquisitions were financed completely with cash. The difference is particu- larly large in the years 1992–1995, which coincides with the start of the tremendous stock market rise of the 1990s. Twenty-seven acquisitions involved a combination of cash and stock; information on the method of financing for the remaining 94 acqui- sitions was not identified.
Previous research has also found that activity diversification affects announce- ment period AR. One measure of activity diversification (used by Morck et al.
(1990) and DeLong (2001)) utilizes the correlation coefficient of stock returns for the acquisition partners. Following Morck, Shleifer and Vishny, we calculate the cor- relation coefficient of daily stock returns for the bidder and target banks involved in bank acquisitions in the 120-day period fromt¼ 136 tot¼ 16 days prior to the acquisition announcement. The sample’s median correlation coefficient in pre- announcement returns of the bidder and target banks is 0.386. We classify acquisi- tions with a preannouncement correlation coefficient of bidder and target returns less than this median value (n¼211) as activity diversifying acquisitions. Those with a correlation coefficient of returns greater than the median value (n¼211) are clas- sified as activity focusing. Table 1 reports this split of the sample by year of acqui- sition announcement.
Our two measures of diversification (geographic and activity) result in similar cuts of the sample. That is, the mean correlation coefficient in preannouncement re- turns of bidder and target banks for the intrastate acquisitions is 0.626, and for
Table 1
Distribution of bank acquisitions announced between 1988 and 1995 Year Full
sample
% of Full sample
Intrastate Interstate Activity focusing
Activity diversifying
Cash financed
Stock financed
1988 41 9.7 22 19 18 23 14 20
1989 31 7.3 17 14 15 16 12 14
1990 21 5.0 13 8 11 10 1 11
1991 27 6.4 16 11 15 12 11 8
1992 40 9.4 24 16 25 15 7 25
1993 78 18.4 41 37 42 36 14 42
1994 105 25.0 55 50 57 48 8 53
1995 80 18.8 39 41 28 51 9 53
Total 423 100.0 227 196 211 211 76 226
Acquisitions were provided by Federal Reserve Board of Governors. Announcement dates are eitherWall Street Journal or LEXIS/NEXIS initial announcement dates. Information on interstate/intrastate and cash/stock financed acquisition was obtained from various press releases. Activity focusing (diversifying) acquisitions are those with preannouncement correlation coefficients of bidder and target returns greater (less) than the sample median, 0.386.
the interstate acquisitions is 0.107. The difference in the correlation coefficients, 0.733, is significant at the 1% level (t-statistic¼3:97).8Thus, the intrastate acquisi- tions appear to be combinations of firms that are also activity related, whereas the interstate acquisitions are not activity related.
To identify diversifying versus focusing acquisitions more strictly, we split the sample to include only those acquisitions that are diversifying according to both geo- graphic and activity measures. Following DeLong (2001), we first separate the sam- ple by geographic diversification (interstate versus intrastate acquisitions). We then analyze the groups separately, calculating the preannouncement correlation coeffi- cient of bidder and target returns for each group. The correlation coefficients for the two groups are0.024 for the interstate acquisitions and 0.548 for intrastate ac- quisitions. Interstate acquisitions with correlation coefficients 60.024 (n¼98) are then classified as diversifying by both measures. Intrastate acquisitions with correla- tion coefficients >0.548 (n¼113) are classified as focusing by both measures.
Table 2 presents descriptive statistics (mean, standard deviation, minimum and maximum) for the sample of 423 bank acquisitions. The values of the transactions are identified from the WSJ or LEXIS/NEXIS articles for 394 of the 423 acquisi- tions. Book values of assets for the bidders and targets are identified from LEXIS/
NEXIS sources. The percentage of equity owned by the CEOs were identified for 420 of the transactions from proxy statements issued before the initial acquisition announcement and is defined as number of shares owned (outright or beneficially) by the CEO divided by the total shares outstanding at the beginning of the an- nouncement year. CEO salaries, CEO bonuses, CEO ages, total number of directors on the board, percentage of outside directors on the board and percentage of equity owned by blockholders (shareholders with more than 5% ownership) are also taken from the proxy statements. Outside directors are defined as those directors having no affiliation with the firm other than their directorship (Baysinger and Butler, 1985;
Byrd and Hickman, 1991).9 Financial data required for option valuation were identified for 410 of the transactions from COMPUSTAT data tapes. Market value of equity is based on year-end prices just prior to the acquisition announcement. Fi- nally, primary capital ratios are calculated for the bank holding companies of all 423 transactions using data from the FDIC Call Report tapes.
As shown in Table 2, the average value of the bank acquisitions is $216.01 million.
The mean book value of the acquiring banks is $17,802.27 million and of the targets is $1,292.53 million. The relative size of the target bank to bidder bank book values averages 7.26%. Although not reported in Table 2, the bidders and targets in inter- state acquisitions are much larger than those in intrastate acquisitions. The mean as- set value is $24,795.57 million for interstate bidders and $11,764.43 million for
8The median correlation coefficient in the preannouncement returns of bidder and target banks for intrastate acquisitions is 0.548 and for interstate acquisitions is0.024.
9Specifically, outsiders are directors who are listed in proxy statements as managers in an unaffiliated non-financial firm, managers of an unaffiliated bank or insurance company, retired managers of another company, major non-manager blockholders in the firm, lawyers unaffiliated with the firm and academics unaffiliated with the firm. All other board members are classified as insiders.
intrastate bidders. The difference in these values is significant at better than the 5%
level. Interstate and intrastate targets have average asset values equal to $1,825.12 and $832.62 million, respectively. The difference is significant at better than the
Table 2
Descriptive statistics for the sample of 423 bank acquisitions announced during the period 1988–1995
Mean Standard
deviation
Minimum Maximum Number of
observations Value of transaction
(millions of dollars)
216.01 806.57 1.50 10,600.00 394
Book value of assets (millions of dollars)
Acquiring bank 17,802.27 29,106.48 34.00 215,475.00 423
Target bank 1,292.53 5,559.17 4.70 65,015.00 423
Percentage of equity owned by the CEO (CEOEQ)
1.25% 2.36% 0.01% 17.98% 420
Market value of options granted to the CEO to the total market value of equity (OPTEQ)
3.26% 4.02% 0.00% 32.13% 410
Market value of options granted to the CEO to the CEO’s salary and bonus (OPTSB)
69.11% 82.14% 0.00% 473.64% 410
CEO’s age (AGE) 53.15 6.12 35.0 67.0 420
Total number of directors on the board (TDR)
16.80 6.20 3.0 50.0 420
Percentage of outside directors on board (PEROUT)
69.27% 70.12% 0.00% 93.33% 420
Percentage of equity owned by blockholders (BLKEQ)
9.15% 11.72% 0.00% 50.86% 415
Capital (CAP) 7.45% 1.04% 4.22% 11.21% 423
Percentage of sample that are intrastate acquisitions
53.66%
Percentage of sample that are interstate acquisitions
46.34%
Percentage of sample that are all stock financed
53.43%
Percentage of sample that are all cash financed
17.97%
Information for transaction values is taken fromMergers and Acquisitionsor other LEXIS/NEXIS data sources. Variables summarizing board of director characteristics are obtained from proxy statements issued the year before theWall Street Journalor LEXIS/NEXIS announcement date. Market value of options granted to the CEO are taken from the COMPUSTAT database the year prior to the initial announcement. The primary capital ratio is derived from FDIC Call Reports the year prior to the initial announcement.
5% level. On average CEOs own 1.25% of the bidding bank’s stock. This variable also varies for intrastate versus interstate acquisitions. CEOs of intrastate bidders, on average, own 1.78% of their banks, while CEOs of interstate bidders hold only 0.63% of their bank’s stock. The difference is significant at better than the 5% level.
4.2. Valuation of options granted
Stock options granted to CEOs are valued using the Black and Scholes (1973) op- tion valuation model assuming continuously paid dividends (Noreen and Wolfson, 1981; Murphy, 1985; Jensen and Murphy, 1990a). The dollar value of the options is calculated as
N½S/ðZÞ XerT/ðZr ffiffiffiffi pT
Þ; where
S¼SDerT; ð1Þ
and
Z¼lnðS=XÞ þ ðrþr2=2Þt r ffiffiffiffi
pT ;
whereNis the number of options granted in the current year at exercise priceX. We assume that each option has a ten-year maturity (as in Houston and James (1996)).
S is the year-end stock price prior to the acquisition announcement net of the present value of dividends paid andDis the annual dividend paid.10When that date was available from the firm’s proxy statements, we also calculated S using stock prices on the date the options were granted. There were no significant differences in our empirical results from the alternate calculations. We estimate the standard de- viation of stock returns,r, in the previous 12-month period using CRSP daily stock returns. Variance of each bank’s stock return is calculated asPM
i¼1ri2, whereriis the daily return for day i and M is the number of trading days during the year:
r¼ ½253=MPM
i¼1r2i1=2is the volatility measure used in the calculations. The variable ris proxied by the 10-year Treasury bond rate which is obtained from the Fx daily database on Ingres. We use the interest rates on the constant-maturity 10-year Treasury bonds in yeartas the relevant risk-free rate./ðÞis the cumulative standard normal distribution function.
4.3. Methodology
We begin by using the standard event-study methodology described in detail in Dodd and Warner (1983). The estimation period is fromt¼ 136 tot¼ 16 rela-
10Compustat item 026 is used for the dividend and item 024 (price close) is used for the year-end stock price.
tive to the initial date of announcement, dayt¼0. AR, ARi, are calculated for each security over the intervalt¼T1 toT2.11
5. Empirical results
Panel A of Table 3 presents the average abnormal portfolio returns and cumula- tive average AR around the announcement of acquisitions for the entire sample of 423 bank acquisitions. For each portfolio return, the corresponding Z-statistic and the percentage of positive AR are also reported. Panel B presents the average AR and cumulative average AR when we split the sample into interstate (n¼196) and intrastate acquisitions (n¼227). Panel C separates the sample into activity diversi- fying (n¼211) versus activity focusing (n¼211) acquisitions. Panel Dseparates the sample into those acquisitions that are diversifying according to both measures (i.e., interstate and activity diversifying) versus those that are focusing according to both measures (i.e., intrastate and activity focusing). Panel E presents the same informa- tion when we split the full sample of acquiring banks into subsamples based on the method of financing (100% cash financed¼76, 100% stock financed ¼226).
5.1. Common stock returns: Full sample
From Panel A of Table 3 we find that the full sample of acquiring banks generally experiences significant and negative average AR at the initial acquisition announce- ment. For example, the three-day CAR1;þ1is0.74% (Z-statistic¼ 2.41, signifi- cant at the 5% level). For each of the ARs and CARs, we perform a Wilcoxon signed rank test on the percent of positive returns to determine significance. The low statis- tically significant percentage of positive returns reported in Panel A leads to the con- clusion that the negative AR are not driven by outliers. From the results, it appears that, on average, acquirers involved in bank acquisitions experience small but statis- tically significant decreases in share value.
5.2. Common stock returns: Diversifying versus focusing acquisitions
Panels B–Dof Table 3 contain results for subsamples of bank acquisitions based on various measures of diversifying/focusing. The conclusions from each of the panels are identical. In Panel B, we see that interstate bank acquisitions generally experience significant negative average announcement period abnormal stock returns. For exam- ple, CAR1;0 is 0.97% (Z ¼ 2:99, significant at the 1% level) and CAR1;þ1 is 1.06% (Z¼ 2:38, significant at the 5% level). Using a Wilcoxon signed rank-test, the percent of positive returns for each of the significant returns indicates that the
11Standard event-study methodology is used to obtain abnormal returns (AR), cumulative abnormal returns (CAR), average standardized abnormal returns (ASAR) and theZ-statistics reported in the next section.
Table 3
Bidder AR and CAR for a sample of 423 bank acquisitions announced during the period 1988–1995 Interval of
trading daysa
Full sample (n¼423)
Mean (%) Z-statistics % Positive
Panel A: Average daily abnormal returns and cumulative abnormal returns for the full sample of bidder banks
AR1 0.47 2.67b 38.8d
AR0 0.23 1.45 42.5d
ARþ1 0.04 0.12 46.8e
CAR1;0 0.70 2.49c 40.0d
CAR1;þ1 0.74 2.41c 40.1d
Interstate acquisitions (n¼196) Intrastate acquisitions (n¼227) Difference in abnormal returns
Mean (%) Z-statistic % Positive Mean (%) Z-statistic % Positive Mean (%) Z-statistic Panel B: Average daily abnormal returns and cumulative abnormal returns for interstate and intrastate acquisitions
AR1 0.64 2.87b 36.1d 0.27 0.33 49.0 0.37 2.07c
AR0 0.33 1.37 39.6d 0.11 0.14 50.5 0.22 0.98
ARþ1 0.09 0.17 40.5d 0.02 0.07 53.1 0.07 0.08
CAR1;0 0.97 2.99b 37.0d 0.38 0.31 50.0 0.59 2.24c
CAR1;þ1 1.06 2.38c 37.0d 0.40 0.30 50.5 0.66 2.02c
Activity diversifying (n¼211) Activity focusing (n¼211) Mean (%) Z-statistic % Positive Mean (%) Z-statistic % Positive
Panel C: Average daily abnormal returns and cumulative abnormal returns for activity diversifying and activity focusing acquisitions
AR1 0.81 3.21b 35.5d 0.13 0.18 50.2 0.68 2.15c
AR0 0.41 1.62 41.7d 0.06 0.10 49.0 0.34 0.88
ARþ1 0.10 0.71 42.7e 0.02 0.08 52.1 0.12 0.58
CAR1;0 1.21 3.42b 37.0d 0.19 0.39 50.0 1.02 2.14c
CAR1;þ1 1.31 3.21b 38.1d 0.17 0.27 51.2 1.14 2.08c
Diversifying (n¼98) Focusing (n¼113)
Mean (%) Z-statistic % Positive Mean (%) Z-statistic % Positive
Panel D: Average daily abnormal returns and cumulative abnormal returns for interstate=activity diversifying and intrastate=activity focusing acquisitions
AR1 1.01 3.95b 19.3d 0.07 0.65 56.6 1.08 2.49c
AR0 0.49 2.11c 25.5d 0.11 0.75 57.5 0.60 1.04
ARþ1 0.15 1.40 35.7d 0.19 0.79 60.2e 0.34 0.48
CAR1;0 1.50 4.28b 21.2d 0.18 0.68 57.5 1.68 2.48c
CAR1;þ1 1.65 4.24b 25.5d 0.37 1.24 61.9e 2.02 2.31c
returns are not driven by outliers. The intrastate bank acquisitions experienced insig- nificant negative abnormal and CAR. Interestingly, the difference in the two-day CAR1;0for interstate versus intrastate acquisitions is0.59% (Z¼ 2:24, significant at the 5% level)12and the difference in the three-day CAR1;þ1is0.66% (Z¼ 2:02, significant at the 5% level).13
In Panel C, we report that activity diversifying acquisitions generally experience significant negative announcement period abnormal stock returns. For example, CAR1;0 is 1.21% (Z¼ 3:42, significant at the 1% level) and CAR1;þ1 is 1.31% (Z¼ 3:21, significant at the 1% level). Focusing acquisitions, on the other hand, earn insignificant AR. The difference in the two-day CAR1;0for activity di- versifying versus activity focusing acquisitions is 1.02% (Z¼ 2:14, significant at
Table 3 (continued) Interval of trading daysa
100% Cash acquisitions (n¼76) 100% Stock acquisitions (n¼226) Mean (%) Z-statistic % Positive Mean (%) Z-statistic % Positive
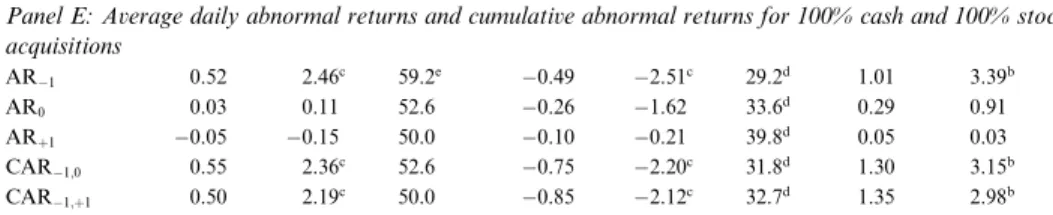
Panel E: Average daily abnormal returns and cumulative abnormal returns for 100% cash and 100% stock acquisitions
AR1 0.52 2.46c 59.2e 0.49 2.51c 29.2d 1.01 3.39b
AR0 0.03 0.11 52.6 0.26 1.62 33.6d 0.29 0.91
ARþ1 0.05 0.15 50.0 0.10 0.21 39.8d 0.05 0.03
CAR1;0 0.55 2.36c 52.6 0.75 2.20c 31.8d 1.30 3.15b
CAR1;þ1 0.50 2.19c 50.0 0.85 2.12c 32.7d 1.35 2.98b
This table reports standard event-study abnormal returns,Z-statistics and the percent of the sample with positive returns at the initial announcement of bank acquisitions. Timet¼0 is theWall Street Journalor LEXIS/NEXIS initial announcement date. Panel A reports returns for the full sample of bank acquisi- tions. Panel B separates the sample into interstate versus intrastate acquisitions. Panel C separates the sample into activity diversifying versus activity focusing acquisitions. We classify acquisitions with a preannouncement correlation coefficient of bidder and target returns less (greater) than the median as activity diversifying (focusing) acquisitions. Panel Dseparates the sample into those acquisitions that are diversifying according to both measures (i.e., interstate and activity diversifying) versus those that are focusing according to both measures (i.e., intrastate and activity focusing). Panel E separates the sample into cash versus stock financed acquisitions. The estimation period used for the market model is the 120- day period fromt¼ 136 tot¼ 16 relative to the announcement date.
aDayðtÞ ¼0 is the initial announcement day.
b,cSignificant at 1% and 5% level, respectively.
d,eWilcoxon signed rank test statistic is significant at 1% and 5% level, respectively.
12To determine whether the difference in AR is statistically significant, the following formula is used:
Z¼ASCAR1ASCAR2
ffiffiffiffiffiffiffiffiffiffiffiffiffiffiffiffiffiffiffiffiffiffiffiffiffiffiffiffiffiffiffiffiffiffi
T2T1þ1
N1 þT2T1þ1N
2
q
where ASCAR1and ASCAR2are the average standardized CAR for interstate and intrastate acquisitions over the periodt¼T1 tot¼T2, respectively, andN1andN2represent the number of observations in the two portfolios, respectively.
13The difference in the AR1for interstate versus intrastate acquisitions is also significant at the 5%
level. The difference for AR1is0.37% (Z¼ 2:07).
the 5% level) and in the three-day CAR1;þ1is1.14% (Z¼ 2:08, significant at the 5% level).
Combining the two diversity measures, the results are even stronger. Panel D reports that interstate acquisitions that also diversify activities have a two-day CAR1;0 of 1.50% (Z¼ 4:28, significant at the 1% level) and a three-day CAR1;þ1of1.65% (Z¼ 4:24, significant at the 1% level). Intrastate acquisitions that also focus activities consistently have insignificant abnormal announcement pe- riod stock returns. The difference in the two-day CAR1;0for the diversifying versus focusing acquisitions is1.68% (Z ¼ 2:48, significant at the 5% level) and the dif- ference in the three-day CAR1;þ1is2.02% (Z¼ 2:31, significant at the 5% level).
Our results for diversifying versus focusing acquisitions are consistent with pre- vious studies (e.g., Baradwaj et al. (1991), Houston and Ryngaert (1994) and DeLong (1999, 2001)). That is, bank acquisitions that diversify (geography and/or activity) produce significantly lower announcement period AR than acquisitions that focus activities.
5.3. Common stock returns: Cash versus stock financing
Panel E of Table 3 contains results for the subsamples of completely cash financed (n¼76) and completely stock financed (n¼226) bank acquisitions. For the cash fi- nanced acquisitions, AR are generally positive and significant. In contrast to these results, stock financed acquisitions produce consistently negative and significant AR. The differences in the AR for cash and stock financed acquisitions are generally significant. For instance, the difference in the three-day CAR1;þ1, 1.35%, is signifi- cant at better than the 1% level (Z ¼2:98).
5.4. Cross-sectional regression results
We estimate a multivariate cross-sectional regression in order to gain insight into which of the independent variables have a significant impact on bidder announce- ment period AR. Although ordinary least squares regression analysis has been widely used in the literature (e.g., Cornett et al. (1998)), Karafiath et al. (1991) point out that, since AR are prediction errors, each has its own variance and the standard ordinary least squares assumption of homoscedasticity may be violated. The pres- ence of heteroscedasticity results in unbiased but inefficient coefficient estimators and biased estimators of the coefficient variances. To correct for the possibility of heteroscedasticity in the error term, we use weighted-least-squares regression analy- sis. Specifically, to obtain efficient estimators, we weight observations in the cross- sectional regressions using the inverse of the standard error estimate for each bank for the 120-day estimation period from the market model.
Further, some of the variables analyzed (e.g., CEO equity ownership) are highly skewed and there are large outliers. To ensure that any results and conclusions are not due to these outliers, we first conduct our tests on the full sample. Subsequently, we remove the top and bottom one percent of the sample based on the corporate governance variables discussed in Section 2 and the relative size of the target and
bidder bank. After removing these outliers the sample size is reduced to 370 obser- vations.14
Using as independent variables the corporate governance mechanisms and control variables discussed in Sections 2 and 3 of the paper, we examine variations of the following regression:
CARð1;þ1Þi¼aiþb1Iiþb2CEOEQiþb3OPTSBiþb4AGEiþb5TDIRi
þb6PEROUTiþb7BLKEQiþb8LOGSIZEiþb9CAPi
þb10D1iþb11D2iþb12D3iþei ð2Þ
where
CARð1;þ1Þi the three-day (t¼ 1 to t¼ þ1) cumulative abnormal return for firmi15
Ii dummy variable equal to 1 if diversifying acquisition and 0 otherwise CEOEQi the percentage of equity owned by the CEO in firmi
OPTSBi the market value of options granted to the CEO divided by the CEO’s salary and bonus for firmi
AGEi the CEO’s age for firmi
TDIRi the total number of directors on the board of firmi
PEROUTi the percentage of outside directors on the board of firm i BLKEQi the percentage of equity owned by blockholders in firmi
LOGSIZEi the natural log of the book value of total assets of the bidder bank16 CAPi the primary capital ratio for firmi
D1i dummy variable equal to 1 if all cash financed and 0 otherwise
D2i dummy variable equal to 1 if the method of financing was not an- nounced
D3i dummy variable equal to 1 if year is 1994–1995 and 0 if year is 1988–
1993
ai intercept term, and
b1–b12 regression coefficients on the independent variables
We analyze three variations of diversifying/focusing acquisitions. First, we setI equal to 1 for interstate acquisitions, and 0 for intrastate acquisitions. Second, we setIequal to 1 for activity diversifying acquisitions, and 0 for activity focusing ac- quisitions. Finally, we setIequal to 1 for interstate and diversifying acquisitions, and 0 for intrastate and focusing acquisitions. The initial results of the cross-sectional re- gression tests are reported in Table 4.
14In several instances the 1% outliers for the six variables include the same firms.
15We repeated the analysis for the other event window CAR1;0and the conclusions are identical.
16We also examined regression results using the natural log of the book value of the target bank divided by the book value of the bidder bank in place of LOGSIZE. In all cases the results and conclusions are the same.
Table 4 reports results for the sample using various measures of diversification.
Regressions (1) and (2) examine the impact of geographic diversification (Iequal 1 for an interstate acquisition, and 0 for an intrastate acquisition). Regression (1) in Table 4 includes data on the full sample (n¼41017) and regression (2) omits the outlier observations (n¼370). Regression (3) examines activity diversification (I equal 1 for a diversifying acquisition, and 0 for an activity focusing acquisition). Fi- nally, Regression (4) examines both measures (Iequal 1 for an interstate and activity diversifying acquisition, and 0 for an intrastate and activity focusing acquisition).
Notice that in all regressions the diversification dummy variable,I, is significant in explaining the announcement period AR to bank acquisitions. Consistent with the results in Table 3, diversifying acquisitions (geographically and by activity) produce significantly smaller (and negative) announcement period returns relative to focusing acquisitions. Further, outliers do not affect these results.
The regression results also document that the incentive-based compensation vari- ables affect the bidder’s abnormal announcement period returns. The variables CE- OEQ and OPTSB are positive and statistically significant in all four regressions at the 1% and 5% level, respectively. These results suggest that the larger the CEO’s stake in the firm (either through stock or options owned), the larger the abnormal return to the bidder bank’s shareholders. Indeed, as the CEO holds more equity in the bank, his/her financial wealth is more directly affected by the stock market’s reaction to the acquisition. Thus, the CEO has a greater incentive to undertake only value increasing acquisitions. In other words, the CEO’s interests are aligned with other shareholders when he has a higher financial stake in the bank. These results lend support to Jensen and Murphy’s (1990a,b) results that the pay–performance compensation contracts of CEOs are crucial in resolving the conflict of interest be- tween managers and shareholders and maximize firm value. Further, our results sug- gest that the presence or omission of outliers does not affect the results.
We next examine the impact of other corporate governance and control variables.
Table 4 indicates that the percentage of outside directors (PEROUT) is positively related to AR (consistent with previous research on non-bank firms). This suggests that a larger percentage of outside directors results in larger bidder bank AR. CEO age, the total number of directors on the board, and block ownership of equity do not appear to affect AR. The coefficient onD1 is positive and significant suggesting that (consistent with previous research) cash financed acquisitions produce higher AR. The coefficient onD3 is insignificant indicating that abnormal announcement pe- riod returns were statistically equivalent before and after passage of the Riegle–Neal Act.
The results in Table 4 suggest the existence of non-value-maximizing behavior on the part of bank managers undertaking diversifying (both geographic and activity) acquisitions. If corporate governance mechanisms used to control the shareholder- manager conflict are less effective for diversifying acquisitions than for focusing ac- quisitions, diversifying acquisitions are less likely to be value maximizing. Therefore,
17We use only 410 of the 423 observations due to limited option data.