Vol. 18, No. 3, 2003, 298 – 316
A RESEARCH NOTE:
THE IMPACT OF ACCOUNTING METHODS
ON THE QUALITY OF EARNINGS
Suwardjono
Universitas Gadjah Mada
ABSTRAK
Suwardjono (2003) menguji apakah terdapat perbedaan kualitas laba (earnings) antara perusahaan yang menggunakan metoda kos penuh (full cost/FC) dan yang menggunakan metoda upaya sukses (successful efforts/SE). Dengan metoda regresi untuk data kuartal-perusahaan (pooled cross-sectional regression) dan data dari Institutional Brokers Estimate System (IBES), hasil penelitian menunjukkan bahwa reaksi pasar terhadap laba (diukur dengan earnings response coefficient/ERC) bagi perusahaan SE secara statistis lebih besar dibanding dengan reaksi pasar bagi perusahaan FC. Temuan ini konsisten dengan temuan dalam penelitian sebelumnya.
Temuan di atas menimbulkan pertanyaan (puzzling) mengingat pasar di bursa saham Amerika dianggap efisien dengan investor canggih sehingga pasar mampu untuk mengenali perubahan laba karena substansi ekonomik atau kosmetik. Penggunaan pooled cross-sectional regression dapat merupakan penyebab hasil yang meragukan tersebut. Catatan riset ini menyelidiki lebih lanjut hasil penelitian ini dengan menguji kembali hipotesis yang diajukan dengan metoda regresi spesifik-perusahaan (firm-specific regression). Tujuan penelitian ini adalah untuk merekonsiliasi apakah perbedaan reaksi pasar tersebut memang sudah semestinya atau apakah perbedaan tersebut semata-mata karena metoda pengujian.
Penyelidikan lebih lanjut menunjukkan bahwa dengan regresi spesifik-perusahaan, metoda FC menghasilkan kualitas laba yang paling tidak sama baik dengan, bahkan dalam beberapa hal lebih baik daripada, metoda SE. Hasil ini kontradiksi dengan temuan sebelumnya. Akan tetapi, tes spesifikasi model (Bartlett dan korelasi Pearson) menunjukkan bahwa pendekatan pooled cross-sectional regression menghasilkan estimasi yang melemahkan reaksi pasar terhadap laba perusahaan FC.
Keywords: successful efforts, full cost, quality of earnings, earnings response coefficient, cross-sectional regression methodology, firm-specific regression methodology, oil and gas industry.
INTRODUCTION
Full cost and successful efforts are two competing accounting methods that account for exploration and development expenditures in the oil and gas industry. The Financial Accounting Standards Board recommended that all companies follow the successful efforts
cost as an acceptable method of accounting for exploration cost would cause undesirable economic impact.
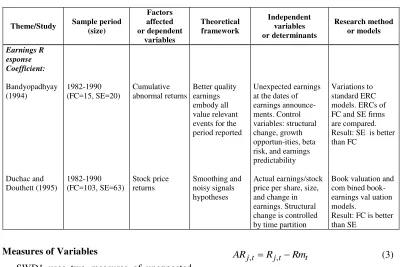
Bandyopadhyay (1994) addresses the earnings quality issue by examining whether SE and FC earnings are priced differently by the market during 1982-1990 period. He finds that the pooled cross-sectional earnings response coefficients (ERCs) of SE firms are greater than those of FC firms over the entire sample period. Using The Value Line predictive measure, he shows that his SE and FC sample firms do differ in terms of earnings predictability. The mean SE earnings predictability is statistically greater than the mean FC earnings predictability at = 0,05. The overall results suggest that the quality of SE earnings is superior to FC earnings. The findings support the early FASB’s argument that SE earnings are more useful to the market. Using cross-sectional regression, Suwardjono (2003) [hereafter SWD1] supports this finding. On the other hand, Duchac and Douthett (1995) examine how the choice between FC and SE methods of accounting affects the value relevance of earnings in the oil and gas industry. By estimating book valuation models and using data from COMPUSTAT for the years 1982-1990, they measure the strength of the association between annual security returns and earnings levels. Their results show that the association is statistically stronger (significant at = 0,05) for FC firms than for SE firms in periods of declining oil prices and reduced exploration activities (1986-1990). The results support the argument advanced by Pincus (1993) that an accounting method (in this case FC) is chosen to reflect managers’ private information and expectations about the economic prospects of their firms. In other words, managers should have discretion to choose SE or FC to reflect managers’ private information and expectation about the firms’ prospects.
While the issue of whether the market discerns differently to the quality of earnings
by FC and SE firms is still debatable, the findings of Bandyopadhyay (1994) and SWD1 are puzzling due to the fact that the market where the data originated is efficient and sophisticated. In such a market, it is conceivable that there should be no difference in reaction to the information conveyed by the earnings of FC and SE firms. Investors are sophisticated enough to distinguish between accounting numbers which reflect economic changes and those which reflect cosmetic changes. Therefore, it is imperative to investigate further whether the superiority of SE over FC method is due to substantive difference or due to model misspecification.
It is specifically stated in SWD1 that one important limitation of his study is that pooled cross-sectional regression is used to estimate the association strength between unexpected earnings and stock returns. Cross-sectional estimations ignore across-firm differences in unexpected earnings variances which may affect the overall results. If these conditions are not met, pooled estimations may be misspecified and thus the results are questionable. Teets and Wasley (1996), for example, provide evidence that, under certain conditions, short-window earnings response coefficients estimated from pooled time-series cross-sectional regression [as applied in Bandyopadhyay (1994) and SWD1] are systematically smaller than corresponding averages of firm-specific coefficients estimated from individual firm time-series regressions. The purposes of this research note are to reevaluate and reestimate the models in SWD1 by applying firm-specific estimation and to compare the results of both approaches. The estimation is performed to test the following working hypothesis:
Literature Review
SWD1 provides descriptions of relevant literature in the area of association studies in general and in oil and gas industry specifically. Association studies have progressed from evaluating the information content of earnings to investigating the earnings response coefficient. The need for a proxy for market expectation has afforded earnings forecasting an important role in the market-based accounting studies. Most studies show that analysts’ earnings forecasts are the best surrogates for market expectation compared to mechanical models. The relation between unexpected earnings and stock returns is not only a useful measure of earnings information content and quality but also a vehicle to evaluate a differential impact of accounting policy choices on the capital market. The theory and empirical results of the association and ERC studies provide a framework for this study.
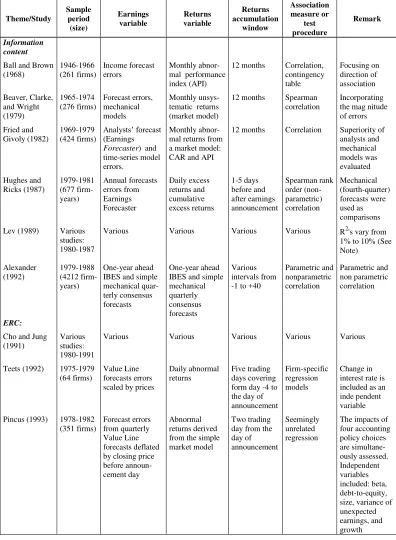
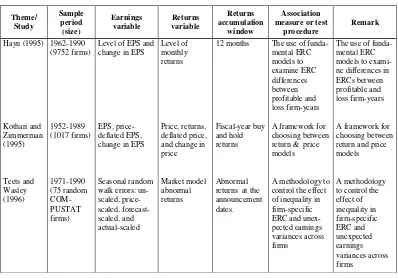
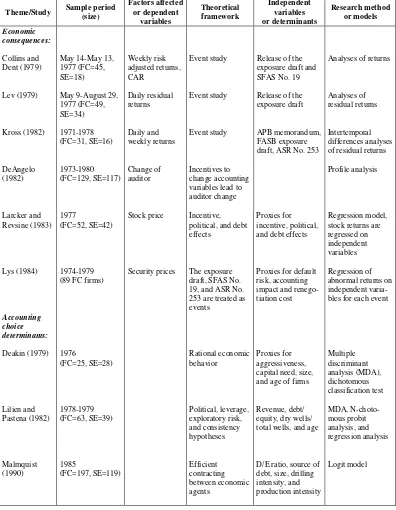
The application of association theory to the oil and gas industry’s FC and SE controversy ranges from assessing the economic consequence of the mandatory accounting change to examining the quality of earnings provided by firms adopting a different accounting method. Most studies in the oil and gas industry focus on the economic impact of SFAS No. 19 rather than on the information content or quality of earnings. Table 1 summarizes the features of association studies and Table 2 summarizes the features of studies in the oil and gas industry.
Estimation Issue
Teets (1992) and Teets and Wasley (1996) find that firm-specific estimations are more appropriate and more robust than pooled estimation. This conclusion is robust when
firms have heterogeneous firm-specific ERCs and unexpected earnings variances. This issue is very relevant since a linear relation between unexpected earnings and cumulative abnormal returns is assumed. Under certain conditions where the individual firm coefficients or the firm-specific variances of unexpected earnings are identical, the two methods will provide the same results. However, if there is a systematic relation between the firm-specific coefficients and firm-specific time-series unexpected earnings variances, any differences in estimates will not be random. Using random samples, Teets and Wasley (1996) find that ERCs and unexpected earnings variances differ cross-sectionally and ERCs are negatively correlated with unexpected earnings. This negative relation results in pooled estimates that are downward biased relative to the average of firm-specific estimates. They further suggest that before using pooled estimation, the equality of coefficients or unexpected variances and the relation between ERCs and unexpected earnings should be tested. When the equality and no-relation hypotheses are rejected, the pooled estimation model may be misspecified and results in incorrect estimates and inferences about the magnitudes and differences in ERCs across groups of firms. It is suspected that the puzzling results of previous studies asserting the superiority of SE method is caused by inequality of interfirm ERCs and interfirm correlation between unexpected earnings and ERCs.
RESEARCH METHOD
Table 1. Selected Research Studies on Association measure or
test procedure
Remark
Information content
Ball and Brown (1968)
Beaver, Clarke, and Wright (1979)
Fried and Givoly (1982)
Hughes and Ricks (1987)
Lev (1989)
Income forecast errors
Forecast errors, mechanical models Analysts’ forecast (Earnings
Forecaster) and
time-series model errors.
Annual forecasts errors from Earnings Forecaster
Various
Monthly abnor- mal performance index (API)
Monthly unsys- tematic returns (market model)
Monthly abnor- mal returns from a market model: CAR and API
Daily excess returns and cumulative excess returns
Various
12 months
12 months
12 months
1-5 days before and after earnings announcement
Spearman rank order (non-parametric) correlation
Various
Focusing on direction of association
Incorporating the mag nitude of errors
Superiority of analysts and mechanical models was evaluated
Mechanical (fourth-quarter) forecasts were used as
One-year ahead IBES and simple mechanical quar-terly consensus forecasts
Various
Value Line forecasts errors scaled by prices
Forecast errors from quarterly Value Line forecasts deflated by closing price before announ-cement day
One-year ahead IBES and simple mechanical quarterly consensus forecasts
Various
Daily abnormal returns
Abnormal returns derived from the simple market model
Various intervals from -1 to +40
Various
Five trading days covering form day -4 to the day of announcement.
Two trading day from the day of announcement
Parametric and nonparametric
Parametric and non parametric correlation
Various
Change in interest rate is included as an inde pendent variable
Tabel 1 (continued)
Selected Research Studies on Association
Theme/ Study
Sample period (size)
Earnings variable
Returns variable
Returns accumulation
window
Association measure or test
procedure
Remark
Hayn (1995)
Kothari and Zimmerman (1995)
Teets and Wasley (1996)
1962-1990 (9752 firms)
1952-1989 (1017 firms)
1971-1990 (75 random COM-PUSTAT firms)
Level of EPS and change in EPS
EPS, price-deflated EPS, change in EPS
Seasonal random walk errors: un- scaled, price-scaled, forecast-scaled, and actual-scaled
Level of monthly returns
Price, returns, deflated price, and change in price
Market model abnormal returns
12 months
Fiscal-year buy and hold returns
Abnormal returns at the announcement dates.
The use of funda-mental ERC models to examine ERC differences between profitable and loss firm-years
A framework for choosing between return & price models
A methodology to control the effect of inequality in firm-specific ERC and unex-pected earnings variances across firms
The use of funda-mental ERC models to exami-ne differences in ERCs between profitable and loss firm-years
A framework for choosing between return and price models
A methodology to control the effect of inequality in firm-specific ERC and unexpected earnings variances across firms
Note:
Lev (1989) summarizes returns-earnings research evidence to assess the usefulness of earnings and research agenda in this area. Cho and Jung (1991) assess the progress of research related to ERC.
Earnings forecasting is required in association studies. However, earning forecasting studies are not in themselves association studies. Therefore, they are not represented in this table.
Table 2
Selected Research Studies on Accounting for Oil and Gas Exploration Costs
Theme/Study Sample period (size)
Factors affected or dependent
variables
Theoretical framework
Independent variables or determinants
Research method or models Economic
consequences:
Collins and Dent (1979)
Lev (1979)
Kross (1982)
DeAngelo (1982)
May 14-May 13, 1977 (FC=45, SE=18)
May 9-August 29, 1977 (FC=49, SE=34)
1971-1978 (FC=31, SE=16)
1973-1980 (FC=129, SE=117)
Weekly risk adjusted returns, CAR
Daily residual returns
Daily and weekly returns
Change of auditor
Event study
Event study
Event study
Incentives to change accounting variables lead to auditor change
Release of the exposure draft and SFAS No. 19
Release of the exposure draft
APB memorandum, FASB exposure draft, ASR No. 253
Analyses of returns
Analyses of residual returns
Intertemporal differences analyses of residual returns
Profile analysis
Larcker and Revsine (1983)
Lys (1984)
Accounting choice determinants:
Deakin (1979)
Lilien and Pastena (1982)
Malmquist (1990)
1977
(FC=52, SE=42)
1974-1979 (89 FC firms)
1976
(FC=25, SE=28)
1978-1979 (FC=63, SE=39)
1985
(FC=197, SE=119)
Stock price
Security prices
Incentive, political, and debt effects
The exposure draft, SFAS No. 19, and ASR No. 253 are treated as events
Rational economic behavior
Political, leverage, exploratory risk, and consistency hypotheses
Efficient contracting between economic agents
Proxies for incentive, political, and debt effects
Proxies for default risk, accounting impact and renego-tiation cost
Proxies for aggressiveness, capital need, size, and age of firms
Revenue, debt/ equity, dry wells/ total wells, and age
D/E ratio, source of debt, size, drilling intensity, and production intensity
Regression model, stock returns are regressed on independent variables
Regression of abnormal returns on independent varia-bles for each event
Multiple discriminant analysis (MDA), dichotomous classification test
MDA, N-choto-mous probit analysis, and regression analysis
Table 2 (continued)
Selected Research Studies on Accounting for Oil and Gas Exploration Costs
Theme/Study Sample period (size)
Research method or models
Earnings R esponse Coefficient:
Bandyopadhyay (1994)
Duchac and Douthett (1995)
1982-1990 (FC=15, SE=20)
1982-1990 (FC=103, SE=63)
Cumulative abnormal returns
Stock price returns
Better quality earnings embody all value relevant events for the period reported
Smoothing and noisy signals hypotheses
Unexpected earnings at the dates of earnings announce- ments. Control variables: structural change, growth opportun-ities, beta risk, and earnings predictability
Actual earnings/stock price per share, size, and change in earnings. Structural change is controlled by time partition
Variations to standard ERC models. ERCs of FC and SE firms are compared. Result: SE is better than FC
Book valuation and com bined book-earnings val uation models.
Result: FC is better than SE
Measures of Variables
SWD1 uses two measures of unexpected earnings: simple unexpected earnings (SUE) and adjusted unexpected earnings (AUE). SUE for each firm-quarter is defined as (see SWD1, page 182 for description of the terms):
p
AUE is measured as a residual error of the following firm-quarter cross-sectional regres-sion model (see SWD1, pages 182-183 for description of the equation terms):
p abnormal return (CAR) are measured using the following adjusted market model (see SWD1, page 184 for description of the terms):
t
Significance Test
To test the differential impact of SE and FC method on the quality of earnings, the follow-ing pooled cross-sectional interaction model is estimated:
that there is a differential impact of FC and SE the quality of earnings. Using this estimation model, SWD1 finds that ERCs for SE firms are statistically larger (at a = 0.05) than for FC firms for two windows ([-2,0] and [-1,0]) before and one window ([0,2]) after the announcement date. These results are consistent with those of previous studies, especially Bandyopadhyay (1994).1
Alternative Tests
Another way to test the cross-sectional differential impact of accounting is to regress CAR on unexpected earnings using pooled cross-sectional data. This model can be expressed as follows:
j,q
This simple regression model is estimated for each group of firms (FC and SE). Statisti-cally significant Chow-F indicates that there is a difference in ERC between the two groups. The coefficient of adjusted unexpected earnings in equation (6) is the ERC. Teets and Wasley (1996) refer to this approach as cross-sectional regression methodology (CSRM) and the ERC can be expressed in the following similar results of using SUE and AUE may be due to the fact that both estimations use the pooled cross-sectional approach which ignores the variation in unexpected earnings across the firms. The rest of the analyses in this research note will focus only on the AUE.
Firm-specific ERC
Teets and Wasley (1996) demonstrate that firm-specific coefficients and variances do differ cross-sectionally and find that ERCs and unexpected earnings variances are negatively correlated. This negative correlation results in much smaller ERCs relative to the simple average of firm-specific coefficients. There-fore, the alternative statistical test in this study is based on averages of firm-specific ERCs. Following Teets (1992), firm-specific ERCs are obtained by estimating the following announcement date for quarter q. Equation (8) is estimated for each individual firm based on a time-series of available quarterly data. Coefficient 1 is a firm-specific ERC, relating unexpected earnings to stock returns. Coefficients 1 for the entire sample are partitioned into two groups based on accounting method. The hypothesis that the average responses to unexpected earnings for FC firms and SE firms may be stated in terms of comparing each group’s mean 1. Teets and Wasley (1996) call this approach a firm-specific coefficient methodology (FSCM) and formulate mean ERC for each group of firms as follows:
According to Teets and Wasley (1996), the CSRM ERCs and FSCM mean ERCs will be equal if the following conditions are met: (1) all firms’ ERCs are the same
(2) all firm-specific AUE variances are iden-tical, even if the firm-specific ERCs differ (3) there is no systematic relation between
firm-specific ERCs and firm-specific variances of AUEs
The FSCM ERCs will be systematically larger than the corresponding CSRM ERCs if the relation in condition (3) is negative, and vice versa if the relation is positive. Teets (1992) and Teets and Wasley (1996) state that firm-specific estimations (FSCM) are more appropriate and more robust than pooled estimation (CSRM) if the above conditions are not met. That is when firms have hetero-geneous firm-specific ERCs and unexpected earnings variances. In this research note, Bartlett test [Neter and Wasserman (1974)] is used to test the homogeneity of variances across group of firms. Pearson correlation is used to test the relation between ERCs and AUE variances.
Bandyopadhyay (1994) shows that the ERCs during relatively high level of explo-ration activity are more pronounced than those during low level of exploration activity. Based
on analyses of the number of active rigs and crude oil prices for 1984-1995, the periods 1984-1985 and 1990 can be characterized as high level periods while periods 1986-1989 and 1991-1995 as low level periods. To measure the impact of exploration intensity to the overall ERCs and to compare with cross-sectional time-partitioned data in SWD1, firm-specific ERCs will also be partitioned according to these time partitions.
In summary, the hypothesis that there is a difference in ERCs between FC firms and SE firms is tested by estimating pooled cross-sectional simple regression models. These simple regression results are then compared with the results of firm-specific estimations. Which result is more reliable will depend on whether the above three conditions are violated.
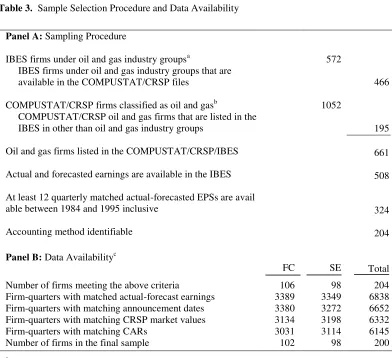
Data and Sample Selection
Table 3. Sample Selection Procedure and Data Availability
Panel A: Sampling Procedure
IBES firms under oil and gas industry groupsa
IBES firms under oil and gas industry groups that are available in the COMPUSTAT/CRSP files
COMPUSTAT/CRSP firms classified as oil and gasb
COMPUSTAT/CRSP oil and gas firms that are listed in the IBES in other than oil and gas industry groups
Oil and gas firms listed in the COMPUSTAT/CRSP/IBES
Actual and forecasted earnings are available in the IBES
At least 12 quarterly matched actual-forecasted EPSs are avail able between 1984 and 1995 inclusive
Accounting method identifiable
572
1052
466
195
661
508
324
204
Panel B: Data Availabilityc
FC SE Total
Number of firms meeting the above criteria
Firm-quarters with matched actual-forecast earnings Firm-quarters with matching announcement dates Firm-quarters with matching CRSP market values Firm-quarters with matching CARs
Number of firms in the final sample
106 3389 3380 3134 3031 102
98 3349 3272 3198 3114 98
204 6838 6652 6332 6145 200
a
BES industry groups: 60101-60110, 60701, 60702, 110201, and 110202.
b
Based on the following SIC codes: Bituminous coal mining (1221), Crude petroleum and natual gas (1311), Drilling oil and gas wells (1381), Oil and gas field exploration (1382), Oil and gas field services (1389), Petroleum refining (2911), Oil and gas field machineries (3533), Pipe lines and ex natural gas (4610), Electric services (4911), Natural gas transmission (4922), Natural gas transmission and distribution (4923), Natural gas distribution (4924), Electric and other services (4931), Cogeneration-Sm power producer (4991), Petroleum bulk stations (5171), Petroleum ex bulk (5172), Oil royalty traders (6792), and Mineral royalty traders (6795). These industries are also represented in Malmquist’s (1990) sample.
c
After actual extraction of data items from the databases. All figures, except for number of firms, represent firm-quarter units.
EMPIRICAL RESULTS
Pooled-Cross-Sectional ERC Tests
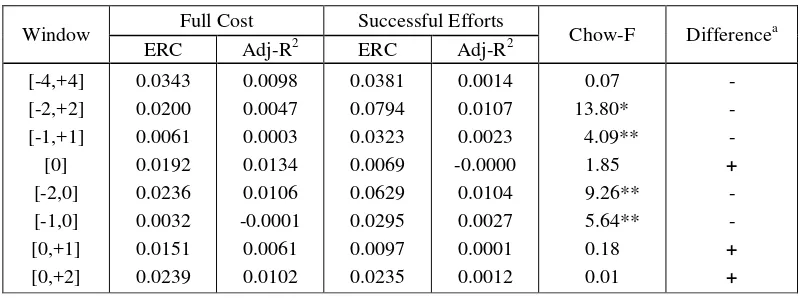
Table 4 presents summaries of the simple regression results for return intervals around, before, and after the announcement date. The
power of the models is relatively low. The differences in ERC are negative (higher ERC for SE firms) and statistically significant around the announcement date but the differences are reversed and statistically insignificant at and after the announcement date. These differences in reactions suggest that the market needs more time to react to earnings of FC firms which are on the average smaller firms. This interpretation is evident from the results at the announcement date. At the announcement date, in which the level of information is comparable for both groups of firms, the market reacts positively to both FC and SE earnings but the difference is statisti-cally insignificant. As more information of FC firms gets into the market after the announ-cement date, the market reacts more to earnings announcements by FC firms even though the differences are statistically insignificant.
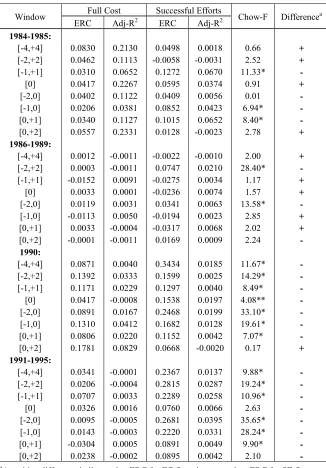
The results of time-partitioned estimations are presented in Table 5. The estimations do not provide apparent evidence that the levels of exploration activities affect the differences in ERCs between FC and SE firms. An interesting observation is that the reaction patterns for 1984-1985 and 1986-1989 are
somewhat similar but different from the patterns for 1990 and 1991-1995. In the first two periods, on the average the market reacts more to SE firms before the announcement date but then the differences disappear at and after the announcement date. In the last two periods, on the other hand, the market reacts more to SE firms for almost all return intervals and in most cases the differences are statistically significant. Time partitioning estimations fail to support the finding that differences in ERC between FC firms and SE firms are more pronounced during periods of high activities.
The simple regression model estimations provide similar results to those of interaction models discussed in SWD1. The pooled cross-sectional estimation approach together with the differences in reaction lag might have explained the previous finding that the market reacts more to earnings of SE firms. Again, it should be noted that pooled cross-sectional estimations ignore across-firm differences in unexpected earnings variances which may affect the overall results. If these conditions are not taken into account, pooled estimations may be misspecified and thus the results are questionable.
Table 4. Pooled Cross-Sectional Regression Coefficients (ERCs) for the Entire Period: Model (6)
Window Full Cost Successful Efforts Chow-F Differencea
ERC Adj-R2 ERC Adj-R2
[-4,+4] [-2,+2] [-1,+1]
[0] [-2,0] [-1,0] [0,+1] [0,+2]
0.0343 0.0200 0.0061 0.0192 0.0236 0.0032 0.0151 0.0239
0.0098 0.0047 0.0003 0.0134 0.0106 -0.0001 0.0061 0.0102
0.0381 0.0794 0.0323 0.0069 0.0629 0.0295 0.0097 0.0235
0.0014 0.0107 0.0023 -0.0000 0.0104 0.0027 0.0001 0.0012
0.07 13.80* 4.09**
1.85 9.26** 5.64**
0.18 0.01
- - - + - - + +
a
A positive difference indicates that ERC for FC firms is greater than ERC for SE firms. * Statistically significant at p < 0.01
Table 5. Pooled Cross-Sectional Regression Coefficients for Each Time Partition
Window Full Cost Successful Efforts Chow-F Differencea
ERC Adj-R2 ERC Adj-R2
A positive difference indicates that ERC for FC firms is greater than ERC for SE firms. * Statistically significant at p < 0.01
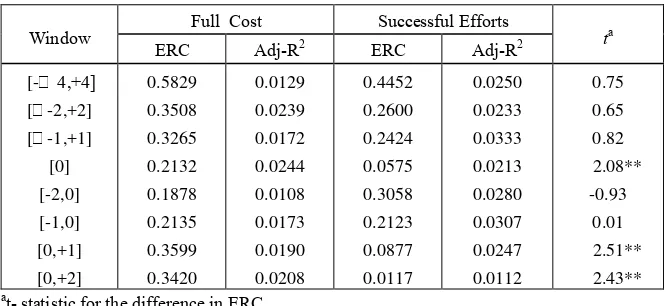
Firm-Specific Analyses
The average estimations for each group of firms and for several return intervals are presented in Table 6. The ERCs range from 0.1878 to 0.5829 for FC firms and from 0.0117 to 0.4452 for SE firms. These ERCs are five to seventeen times higher than the ERCs of the pooled cross-sectional regressions. The R2's are still low with the maximums of 0.0244 for FC firms and 0.0333 for SE firms. The ERCs for FC firms are higher than those of FC firms
for most intervals. The ERCs for FC firms are statistically higher than those for SE firms at the event day and in the intervals after the announcement date. This suggests that the market needs more time to react to earnings of FC firms which are on the average smaller firms. As more information of FC firms arrives into the market after the announcement date, the market reacts more to earnings releases by FC firms.
Table 6. Mean ERCs from Firm-Specific Regressions for the Entire Period
Window
Full Cost Successful Efforts
ta
ERC Adj-R2 ERC Adj-R2
[- 4,+4] [-2,+2] [-1,+1]
[0] [-2,0] [-1,0] [0,+1] [0,+2]
0.5829 0.3508 0.3265 0.2132 0.1878 0.2135 0.3599 0.3420
0.0129 0.0239 0.0172 0.0244 0.0108 0.0173 0.0190 0.0208
0.4452 0.2600 0.2424 0.0575 0.3058 0.2123 0.0877 0.0117
0.0250 0.0233 0.0333 0.0213 0.0280 0.0307 0.0247 0.0112
0.75 0.65 0.82 2.08**
-0.93 0.01 2.51** 2.43**
a
t- statistic for the difference in ERC. * Statistically significant at p < 0.01 ** Statistically significant at p < 0.05
Side-by-side comparisons of the results from pooled and firm-specific estimations are shown in Table 7. Opposite to the results from pooled estimations, the ERCs for FC firms from firm-specific estimations are relatively higher in almost all return intervals. Standard t-tests for differences in mean ERCs indicate that the differences are statistically significant at and after the announcement date (return intervals [0], [0,1], and [0,2]). The difference for [-2,0] return interval is negative. However, unlike Bandyopadhyay’s (1994) finding, the difference is statistically insignificant. While ERCs for SE firms are higher before the announcement date under pooled cross-sectional model, the ERCs are lower at and
after the announcement date under firm-specific model.
R2 increases 2.67 times (from 0.0069 to 0.0183) for FC firms and 6.86 times (from 0.0036 to 0.0247) for SE firms. Thus, firm-specific models better explain the variation of abnormal returns.
Table 8 presents the results for firm-specific estimations using time-partitioned data. The results, however, should be interpreted with caution since partitioning firm-specific estimation into four subperiods leaves high periods (1984-1985 and 1990) with only five observations or fewer for each firm. Given this limitation, there is no apparent
evidence that levels of activities affect the overall results. In all four subperiods, no difference in ERC is statistically significant although in most cases ERCs for FC firms are lower than for SE firms. The levels of significance, however, differ from the results of pooled cross-sectional estimations in Table 4 in which the SE firms dominate FC firms in the market sensitivity to unexpected earnings not only in magnitude but also in statistical significance especially for subperiods 1990 and 1991-1995.
Table 7. Comparions of Results for Pooled Cross-Sectional and Firm-Specific Estimations for the Entire Period
Return interval
Cross-sectional coefficients Firm-specific coefficients
FC SE Differencea FC SE Differenceb
[-4,+4] [-2,+2] [-1,+1] [0] [-2,0] [-1,0] [0,+1] [0,+2]
0.0343 0.0200 0.0061 0.0192 0.0236 0.0032 0.0151 0.0239
0.0381 0.0794 0.0323 0.0069 0.0629 0.0295 0.0097 0.0235
-0.0038 -0.0594* -0.0262**
0.0123 -0.0393** -0.0263**
0.0054 0.0004
0.5829 0.3508 0.3265 0.2132 0.1878 0.2135 0.3599 0.3420
0.4452 0.2600 0.2424 0.0575 0.3058 0.2123 0.0877 0.0117
0.1377 0.0908 0.0841 0.1557**
-0.1180 0.0012 0.2722** 0.3303**
a
Chow test is used to measure the statistical significance of the difference.
b Standard t-test procedure is performed to test the statistical significance of the difference.
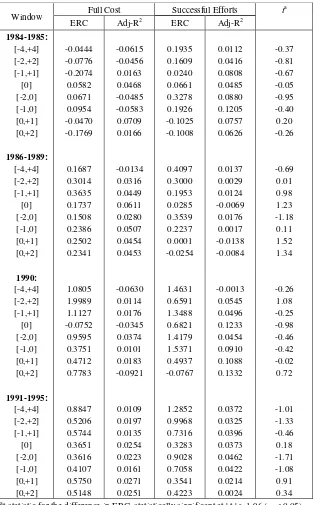
Table 8. Mean ERCs from Firm-Specific Regressions for Each Time Partition
Window Full Cost Successful Efforts t
a
Specification Tests
The above analyses show that two different estimation approaches result in two different outcomes. Pooled cross-sectional estimations provide a general inference that the ERCs for SE firms are statistically larger than for FC firms while firm-specific estimations provide an opposite conclusion or at least a different conclusion that ERCs for SE firms are not statistically larger than for FC firms for the announcement dates and for intervals follow-ing the announcements. The opposite or different results may be attributed to differen-ces in the speed by which information gets into the market for FC and SE firms. These diffe-rences are mitigated by adjusting the unex-pected earnings measure using an earnings expectation model at the date of earnings announcement. This refinement however may not capture the lag in information speed. Another plausible explanation is that the pooled cross-sectional estimations are misspe-cified due to cross-sectional heterogeneity in firm-specific ERCs or unexpected earnings variances. If equality of coefficients (of firm-specific unexpected earnings variances) is rejected, it is likely that cross-sectional estimates of coefficients are downward biased especially for a group with less homogeneity.
To test the validity of this argument, Bartlett test is performed to determine if AUE variances are homogeneous across firms in each group (FC and SE). B-statistics of Bartlett
test (equivalent to 2) are 12,727.0 for FC group and 7,639.0 for SE group. Both statistics are statistically significant at less than 0.01 level with 101 and 97 degrees of freedom, respectively. These statistics indicate that FC firms are more heterogeneous than SE firms. To assess the severity of unequal AUE variances in biasing coefficients downward, a correlation analysis is performed. Table 9 presents coefficients of correlation between firm-specific ERCs and AUE variances for each group of firms. The results indicate that in all cases ERCs are negatively related to AUE variances. More importantly, in most cases where the correlations are statistically significant for FC firms, the coefficients are also higher for FC firms (return intervals [-4,+4], [-2,+2], and [0,2]). This higher associations for FC firms might have caused unduly downward-biased estimates of FC firms and thus result in statistically significant lower full cost ERCs under pooled cross-sectional estimations. Indeed, the use of firm-specific estimation approach is a way to control for the impact of across-firm unequal AUE variances. This research note provides evidence that firm-specific ERCs of FC and SE firms are almost twenty times higher than those ERCs based on pooled cross-sectional regression. Also, firm-specific ERCs for FC firms are statistically higher than firm-specific ERCs for SE firms for the announcement date and following the earnings announcement.
Table 9. Pearson Corelations Between Firm-Specific ERCs and Adjusted Unexpected Earnings Variances
Return internal
Full Cost Successful Efforts
Coefficient Prob > | t | Coefficient Prob > | t | [-4,+4]
[-2,+2] [-1,+1]
[0] [-2,0] [-1,0] [0,+1] [0,+2]
-0.3646 -0.4431 -0.2012 -0.1017 -0.1682 -0.2475 -0.0754 -0.4702
0.0002 0.0001 0.0426 0.3089 0.0910 0.0121 0.4511 0.0001
-0.1878 -0.1937 -0.2056 -0.1710 -0.2340 -0.2696 -0.1592 -0.1196
In summary, the results of this research note demonstrate that the market reacts stronger to FC earnings than to SE earnings when firm-specific estimation models are applied. These results contradict those of pooled cross-sectional estimations. However, the Bartlett test reveals that the firm-specific estimation approach is more robust and better specified than the pooled cross-sectional approach. Therefore, this note rejects the hypothesis of equal ERCs between FC firms and SE firms and concludes that ERCs for FC firms are higher than those for SE firms. The implication of this finding is discussed in the following conclusions.
CONCLUSIONS
Pooled cross-sectional and firm-specific simple regressions are estimated for measuring the magnitude of earnings response coefficients (ERCs) of FC and SE firms. Estimations of simple regression models using a pooled cross-sectional approach produce results supporting previous findings that ERCs for SE firms are higher than those for FC firms. The differences in ERCs are statistically significant only for return intervals before (and including) the announcement date. When firm-specific estimations are performed, the significance of the differences dissipates and the ERCs for FC firms are higher than those of SE firms for return intervals after (and including) the announcement date. Further specification tests reveal that the unexpected earnings variances are not homogeneous across firms and the ERCs are negatively related to these firm-specific variances. More impor-tantly, the homogeneity test also shows that variances of FC firms are more heterogeneous than those of SE firms and thereby ERC estimates of FC firms are unduly downward biased. This result explains the statistically significant higher ERC for SE firms when pooled cross-sectional models are estimated.
As Teets and Wasley (1996) suggest, if there is a systematic relation between the
firm-specific coefficients and firm-firm-specific time-series unexpected earnings variances, any differences in estimates will not be random. They further suggest that before using pooled estimation, the equality of coefficients or unexpected variances and the relation between ERCs and unexpected earnings should be tested. When the equality and no-relation hypotheses are rejected, the pooled estimation model may be misspecified and results in inaccurate estimates and incorrect inferences about the magnitudes of and the differences in ERCs across groups of firms.
The above specification tests suggest that the firm-specific estimations are more appro-priate than the pooled estimations. Therefore, the general conclusion is that the ERCs for FC firms are higher than (or at least the same as) the ERCs for SE firms. This conclusion par-tially supports the findings by Duchac and Douthett (1995) who use earnings levels analysis. Also, this conclusion is more in line with the descriptive result that forecasts for the FC firms are more accurate than forecasts for the SE firms.
that managers should be given a discretion to choose accounting methods that best reflect managers’ private information and expec-tations about their firms’ economic status and prospects. Whether SE method can be imposed on the basis of uniformity, as suggested by the FASB, is an unresolved empirical question.
This research note confirms the general suggestion of Teets and Wasley (1996) that before using pooled estimation, the equality of coefficients or unexpected variances and the relation between ERCs and unexpected earnings should be tested. When the equality and no-relation hypotheses are rejected, the pooled estimation models may be misspecified and may result in incorrect estimates and inferences about the magnitudes and differences in ERCs across groups of firms.
REFERENCES
Alexander, J. C. 1992. Earnings Surprise, Market Efficiency, and Expectations. Financial Review 27 (November): 475-502.
_____. 1995. Refining the Degree of Earnings Surprise: A Comparison of Statistical and Analysts’ Forecasts. Financial Review 30 (August): 469-506.
Ball R. and P. Brown. 1968. An Empirical Evaluation of Accounting Income Numbers. Journal of Accounting Research 6 (Autumn): 159-178.
Bandyopadhyay, S. P. 1994. Market Reaction to Earnings Announcements of Successful Efforts and Full Cost Firms in the Oil and Gas Industry. Accounting Review 69 (October): 657-674.
Beaver, W. H. 1968. The Information Content of Annual Earnings Announcements. Journal of Accounting Research (Supplement): 67-92.
Beaver, W. H., R. Clarke, and W. F. Wright. 1979. The Association Between Unsystematic Security Returns and the
Magnitude of Earnings Forecast Errors. Journal of Accounting Research 17 (Autumn): 316-340.
Cho, J. Y. and K. Jung. 1991. Earnings Response Coefficients: A Synthesis of Theory and Empirical Evidence. Journal of Accounting Literature 10: 85-116. Collins, D. W. and W. T. Dent. 1979. The
Proposed Elimination of Full Cost Accounting in the Extractive Petroleum Industry. Journal of Accounting and Economics 1 (March): 3-44.
Deakin, E. B. 1979. An Analysis of Differences Between Non-major Oil Firms Using Successful Efforts and Full Cost Methods. The Accounting Review 54 (October): 722-734.
DeAngelo, L. E. 1982. Mandated Successful Efforts and Auditing Choice. Journal of Accounting and Economics 4 (December): 171-203.
Duchac, J. E. and E. B. Douthett. 1995. The Impact of Accounting for Oil and Gas Reserves on the Relation between Returns and Earnings. Working Paper(January).
Financial Accounting Standards Board (FASB). 1977. Statement of Financial Accounting Standards No. 19: Financial Accounting and Reporting by Oil and Gas Producing Companies, Stamford. CT: FASB.
Fried, D. and D. Givoly. 1982. Financial Analysts' Forecasts of Earnings: A Better Surrogate for Market Expectations. Journal of Accounting and Economics 4 (October): 85-107.
Hayn, C. 1995. The Information Content of Losses. Journal of Accounting and Economics 20 (September): 125-153. Hughes, J. S. and W. E. Ricks. 1987.
Imhoff, E. A. and G. J. Lobo. 1992. The Effect of Ex Ante Earnings Uncertainty on Earnings Response Coefficients. The Accounting Review 67 (April): 427-439. Kothari, S. P. and J. L. Zimmerman. 1995.
Price and Return Models. Journal of Accounting and Economics 20 (September): 155-192.
Lev, B. 1989. On the Usefulness of Earnings and Earnings Research: Lessons and Directions from Two Decades of Empi-rical Research. Journal of Accounting Research 27 (Supplement): 153-201. _____. 1979. The Impact of Accounting
Regulation on the Stock Market: The Case of Oil and Gas Companies. Accounting Review 54 (July): 485-503.
Lilien, S. and V. Pastena. 1981. Intramethod Comparability: The Case of the Oil and Gas Industry. The Accounting Review 56 (July): 690-703.
Lys, T. 1984. Mandated Accounting Changes and Debt Covenants: The Case of Oil and Gas Accounting. Journal of Accounting and Economics 6 (April): 39-95.
Malmquist, D. H. 1990. Efficient Contracting and the Choice of Accounting Method in
the Oil and Gas Industry. Journal of Accounting and Economics 12 (January): 173-205.
Neter, J. and W. Wasserman. 1974. Applied Linear Models. Richard D. Irwin, Inc. Pincus, M. 1993. Accounting Methods and
Differential Stock Market Response to the Announcement of Earnings. Journal of Accounting, Auditing, and Finance 8 (Summer): 221-246.
Suwardjono. 2003. The Impact of Accounting Methods on the Quality of Earnings: The Case of Oil and Gas Industry. Journal of Indonesian Economy and Business, Vol. 18, No. 2: 175-195.
Teets, Walter R. 1992. The Association Between Stock Market Responses to Earnings Announcements and Regulation of Electric Utilities. Journal of Accounting Research 30: 274-285.